Tunable Laser Market Size & Overview:
Get More Information on Tunable Laser Market - Request Sample Report
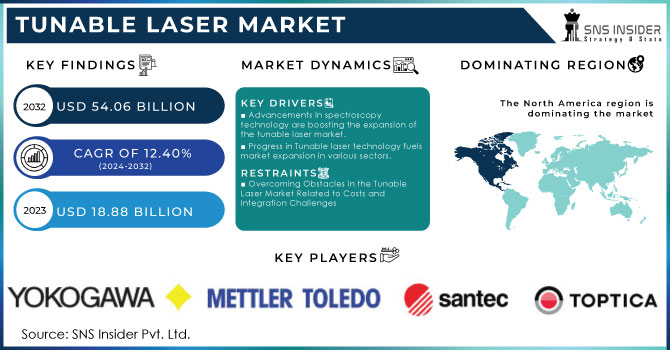
The Tunable Laser Market Size was valued at USD 18.88 Billion in 2023 and it is expected to reach USD 54.06 Billion by 2032 with a growing CAGR of 12.4% over the forecast period 2024-2032.
The tunable laser market is seeing consistent expansion, propelled by its rising use in sectors like telecommunications, healthcare, and spectroscopy. Adjustable lasers, which provide the capability to modify the wavelength of light they emit, are crucial in dense wavelength division multiplexing (DWDM) setups, allowing for increased data transmission speeds and enhanced network efficiency. In the field of healthcare, they are used for medical imaging and diagnosis. The increasing need for accurate measurement tools in research and manufacturing is also driving market growth. Due to the progress in laser technology, especially the creation of ultrafast tunable lasers, and the increased demand for high-speed, secure communication networks, especially in 5G infrastructure, the market is expected to grow substantially.
The healthcare industry is expected to drive substantial growth in the tunable laser market as its utilization in cancer treatment, dermatology, ophthalmology, and surgical procedures expands. The capability of tunable lasers to modify wavelengths for precise tissue targeting improves non-invasive imaging methods such as optical coherence tomography, important for high-quality tissue imaging. This increase is being fueled by a need for less invasive procedures, better diagnostics, and improved therapeutic results. For instance, adjustable lasers are essential in activities like tattoo removal, retinal surgery, and acne treatment, where the ability to change wavelengths is important. Increasing numbers of chronic illnesses and an aging worldwide populace continue to drive the need for new and advanced medical technologies. A projected 1,958,310 new cancer cases and 609,820 deaths are expected in the U.S. in 2023, increasing the demand for medical imaging technologies utilizing tunable lasers. The market's growth will be further boosted by the ongoing development of laser technologies, including real-time image control and automatic wavelength selection, during the forecast period.
Tunable Laser Market Dynamics
Drivers
-
Advancements in spectroscopy technology are boosting the expansion of the tunable laser market.
Advancements in spectroscopy techniques, particularly diode laser spectroscopy, are fueling the growth of the tunable laser market by enabling unparalleled precision in monitoring color changes during laser sweeps. This advancement establishes higher benchmarks for frequency metrology and broadens its applications, such as in quantum communication and metrology. The increasing popularity of Tunable Continuous-Wave (CW) laser spectroscopy is attributed to its high photon flux, frequency versatility, and usefulness in molecular spectroscopy, gas detection, and LIDAR applications. This technique provides excellent signal-to-noise ratios (SNR), which is perfect for detecting small amounts of gases and conducting precise measurements. The increasing need for adjustable lasers in sectors like healthcare, telecommunications, and defense is being driven by these abilities. Additionally, spectroscopy based on frequency combs, which was awarded a Nobel Prize in 2005, provides incredibly precise frequency measurements—up to 18 decimal places. Nevertheless, the drawbacks, like insufficient power per comb mode and intricate stabilization systems, underscore the benefits of adjustable continuous wave lasers.
-
Progress in Tunable laser technology fuels market expansion in various sectors.
The increasing need for cost-effective high-bandwidth data transfer capabilities in different sectors is driving significant growth in the tunable laser market. The increasing number of electronics users is fueling the demand for better data transfer quality, leading to a significant increase in the use of tunable lasers in telecommunications and data centers. These lasers play a key role in various uses such as nanotechnology, solar cells, photoluminescence research, and medical imaging technology, highlighting their flexibility and significance in cutting-edge technological procedures. The flexibility of Optical Parametric Oscillator (OPO) lasers is demonstrated by their ability to be adjusted to generate a broad range of wavelengths. Their transformation from intricate, uncoordinated systems to unified, ready-to-use devices increases their attractiveness in business environments. This change has allowed scientists and producers to use pulse-driven adjustable lasers in important tasks such as mass spectrometry, spectroscopy, and photoacoustic imaging, making them essential in both academic and industrial sectors. The advancement of OPO lasers showcases a larger pattern in which academic studies are leading to new commercial product ideas, highlighting the laser industry's active expansion.
Restraints
-
Overcoming Obstacles in the Tunable Laser Market Related to Costs and Integration Challenges
The tunable lasers market is primed for significant expansion, but it must overcome major obstacles that may impede its development. The significant expenses linked to tunable laser systems serve as a major obstacle, especially for smaller businesses and new companies that might find it challenging to afford such cutting-edge technology. The complex manufacturing techniques used to make these lasers lead to increased production costs, causing higher prices for consumers. Moreover, the complexity of integrating tunable lasers into current systems often necessitates specialized knowledge that is lacking in many industries. This lack of knowledge could cause potential buyers to be hesitant about implementing these technologies. Furthermore, the fast rate of technological progression requires ongoing research and development, putting additional financial pressure on manufacturers. The demand for skilled workers who can operate and maintain these advanced systems worsens the current skills deficit in the workforce. With the rise of automation and advanced technologies in industries, offering proper training and opportunities for upskilling becomes essential in tackling these obstacles. It is crucial to conquer these challenges in order to fully maximize the tunable laser market's potential and guarantee its longevity in a competitive environment.
Segment Analysis of Tunable Laser Market
by Type
In the year 2023, the Continuous-Wave (CW) category led the tunable laser industry, representing about 40.44% of the overall earnings. The significant growth of this sector is mainly fueled by its wide-ranging uses in different fields, such as telecommunications, spectroscopy, and biomedical imaging. Businesses like Coherent Inc. have developed high-tech continuous-wave laser systems designed for challenging tasks, improving accuracy and effectiveness. For example, Coherent introduced the Verdi V-10, a high-power continuous wave laser tailored for biomedical uses, demonstrating advancements in dependability and output consistency.Thorlabs introduced a new series of adjustable laser sources designed for fiber optics and metrology applications, highlighting the versatility of continuous-wave lasers in meeting various market demands. These developments highlight the growing dependence on CW lasers for fast data transmission and optical communication systems, adding to their significant market presence.As industries look for more effective and adaptable laser options, the continuous-wave sector is expected to see ongoing expansion, mirroring overall trends in the tunable laser industry. It is anticipated that advancements in CW laser technologies will broaden their use across various industries and further establish their dominant position in the market.
by Application
Based on Application, Spectroscopy is captured the largest share revenue in Tunable Laser market with 39.56% in 2023. This control is credited to the important function that tunable lasers have in different spectroscopic methods, allowing scientists and businesses to examine materials with great accuracy. Thorlabs and Coherent Inc. are leading the way in innovation in this field. The Tunable Laser Source recently introduced by Thorlabs is tailor-made for spectroscopy applications, aiming to improve the capabilities of researchers in different scientific fields. The field of time-resolved spectroscopy has been greatly enhanced by Coherent's release of the Mira 900, a tunable femtosecond laser system, which provides excellent stability and tunability for various experiments. These developments highlight the growing need for advanced spectroscopic instruments in pharmaceuticals, environmental monitoring, and materials science, which are contributing to the expansion of the tunable laser market.
Tunable Laser Market Regional Outlook
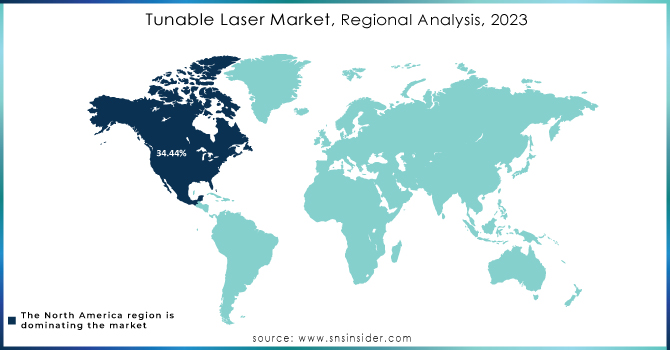
North America led the tunable laser market in 2023, accounting for around 34.44% of the overall revenue. Significant funding in research and development in areas like medical imaging, telecommunications, and environmental monitoring is fueling this leadership role. Thorlabs and Coherent Inc. have both made significant progress in product development. Thorlabs introduced a new line of tunable laser systems designed for optical coherence tomography (OCT) to improve diagnostic capabilities in healthcare. In the same vein, Coherent introduced the Tunable Laser Source for advanced spectroscopy, demonstrating its dedication to groundbreaking solutions. Aside from corporate progress, the U.S. government has been actively supporting research projects to improve laser technology, encouraging partnerships between academia and industry. Having prestigious universities and research institutions like MIT and Stanford has boosted innovation in the area. The collaboration between businesses and universities highlights North America's strong position in the tunable laser market, leading to continued growth and technological progress.
In 2023, Asia-Pacific became the quickest-growing region in the tunable laser market, propelled by rapid technological progress and rising investments in industries like telecommunications, healthcare, and industrial automation. Nations such as China, Japan, and India lead the way in this expansion. An example is when Fujikura Ltd. released its latest tunable laser system for optical communication, with the goal of improving data transfer rates and network effectiveness. In the meantime, Nippon Laser & Electronics unveiled a flexible tunable laser for use in medical diagnostics, especially in endoscopy, highlighting the increasing overlap of laser technology and healthcare. The Indian government has raised the funding for research in photonics and laser technology in alignment with its "Make in India" campaign, which aims to boost local manufacturing and creativity. This program aims to promote partnerships between universities and technology firms, boosting the area's research capacities and range of products. With these changes taking place, it is anticipated that the Asia-Pacific region will keep up its pace and play a key role in the worldwide tunable laser market.
Get Customized Report as per Your Business Requirement - Request For Customized Report
Key Players
Some of the key Players in Tunable Laser Market with product and offering:
-
Yokogawa Electric (Tunable Laser Solutions)
-
Toptica Photonics (Tunable Lasers for Research and Industry)
-
Focused Photonics (Optical Systems and Tunable Lasers)
-
NEC Corporation (Tunable Laser Technologies)
-
Santec Corporation (Optical Components and Tunable Lasers)
-
Mettler Toledo (Laser Solutions for Analytical Applications)
-
Hubner GmbH & Co KG (Tunable Laser Systems)
-
Agilent Technologies (Precision Tunable Lasers)
-
NeoPhotonics Corporation (Tunable Laser Modules)
-
Luna Innovations (Tunable Laser Solutions)
-
Coherent Inc. (Mephisto Tunable Lasers)
-
Hüpersensory Technologies (Optical Parametric Oscillator Lasers)
-
Laser Quantum (Taurus Series Tunable Lasers)
-
Spectra-Physics (Innova Series Tunable Lasers)
-
MKS Instruments (Tunable Diode Laser Systems)
-
Thorlabs (Tunable Lasers for Scientific Applications)
-
Xenics (Tunable Laser Products for Infrared Applications)
-
Lightwave Logic (Advanced Tunable Laser Technologies)
-
OptoSigma Corporation (Optical Components and Tunable Lasers)
-
NKT Photonics (Tunable Laser Solutions for Medical and Industrial Applications)
-
Others
Recent Development
-
October 2023: EFFECT Photonics, a company that creates reliable optical solutions, confirmed the successful testing of their complete InP-based tunable laser PIC (photonic integrated circuit). This essential component provides energy to the digital Pico integrated tunable laser assembly (pITLA) tunable lasers. Tunable lasers are crucial for coherent optical systems that facilitate Dense Wavelength Division Multiplexing (DWDM). DWDM allows network operators to boost their network capacity without the need to expand the fiber infrastructure. Photonics company named EFFECT.
-
October 2023: NIRRIN Technologies, a pioneer in creating analytical systems to transform analysis for downstream bio-processing applications, showcased three HPTLS applications in poster presentations: buffer validation, detection of ultrafiber/de-fiber endpoints, and protein quantification without dilution. NIRRIN HPTLS utilizes NIR spectral technology and advanced tunable laser sources to provide a distinct and measurable protein signature with precise accuracy and a wide dynamic range.
-
June, 2024, tunable lasers have achieved "black box" status, evolving into plug-and-play devices that integrate seamlessly into larger systems. Many cutting-edge products are emerging from academic research, where professors often establish companies to commercialize their innovations by merging off-the-shelf components with specialized parts for advanced applications.
-
August, 2024, the International Society for Optics and Photonics revealed an innovative diode laser spectroscopy method that effectively monitors the color variations in sweeping lasers, setting new standards for frequency metrology and practical applications.
| Report Attributes | Details |
|---|---|
| Market Size in 2023 | USD 18.88 Billion |
| Market Size by 2032 | USD 54.06 Billion |
| CAGR | CAGR of 12.4% From 2024 to 2032 |
| Base Year | 2023 |
| Forecast Period | 2024-2032 |
| Historical Data | 2020-2022 |
| Report Scope & Coverage | Market Size, Segments Analysis, Competitive Landscape, Regional Analysis, DROC & SWOT Analysis, Forecast Outlook |
| Key Segments | • By Type (Continuous-Wave, Ultrafast, Amplified Laser, High Energy Pulsed, Others) • By Frequency (1.26um-1.36um (O-Band), 1.57um-1.63um (L-Band), 1.53um-1.57um (C-Band), 1.46um-1.53um (S-Band), 0.77um-0.91um (Ultra-Narrow Linewidth), 1.36um-1.46um (E-Band), 1.63um-1.68um (U-Band), 2um) • By Application (Spectroscopy, Metrology, Laser Cooling, Optical Fiber Communication, Others) • By Vertical (Manufacturing, Aerospace & Defense, Healthcare, Networking, Semiconductor, Energy & Utilities, Telecommunication, Others) |
| Regional Analysis/Coverage | North America (US, Canada, Mexico), Europe (Eastern Europe [Poland, Romania, Hungary, Turkey, Rest of Eastern Europe] Western Europe] Germany, France, UK, Italy, Spain, Netherlands, Switzerland, Austria, Rest of Western Europe]), Asia-Pacific (China, India, Japan, South Korea, Vietnam, Singapore, Australia, Rest of Asia-Pacific), Middle East & Africa (Middle East [UAE, Egypt, Saudi Arabia, Qatar, Rest of Middle East], Africa [Nigeria, South Africa, Rest of Africa], Latin America (Brazil, Argentina, Colombia, Rest of Latin America) |
| Company Profiles | Yokogawa Electric, Toptica Photonics, Focused Photonics, NEC Corporation, Santec Corporation, Mettler Toledo, Hubner GmbH & Co KG, Agilent Technologies, NeoPhotonics Corporation, Luna Innovations, Coherent Inc., Hüpersensory Technologies, Laser Quantum, Spectra-Physics, MKS Instruments, Thorlabs, Xenics, Lightwave Logic, OptoSigma Corporation, and NKT Photonics & Others |
| Key Drivers | • Advancements in spectroscopy technology are boosting the expansion of the tunable laser market. • Progress in Tunable laser technology fuels market expansion in various sectors. |
| RESTRAINTS | • Overcoming Obstacles in the Tunable Laser Market Related to Costs and Integration Challenges |
Frequently Asked Questions
Ans: The Tunable Laser Market grow at a CAGR of 12.4% over the forecast period of 2024-2032.
Ans: The primary driving force behind the growth of the tunable laser market is the rising need for high-performance optical communication systems and advanced spectroscopic applications, fueled by the growth of data centers and the requirement for improved bandwidth in telecommunications.
Ans: The Continuous-wave segment dominated the Tunable Laser Market.
Ans: The Tunable Laser Market size was valued at USD 18.88 Billion in 2023 and it is expected to reach USD 54.06 Billion by 2032
Ans: North America dominated the Tunable Laser Market in 2023.
Get in Touch
