2-Ethylhexanol Market Analysis & Overview
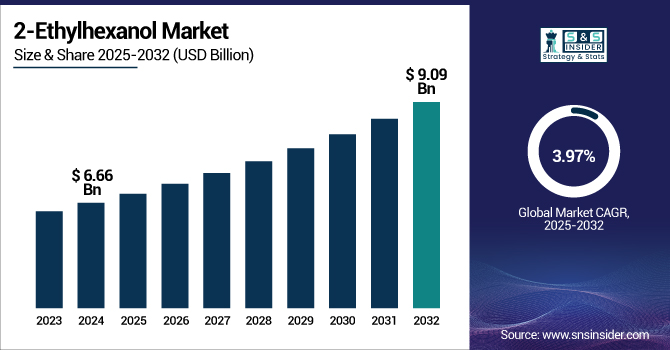
The 2-Ethylhexanol Market size was valued at USD 6.66 billion in 2024 and is expected to reach USD 9.09 billion by 2032, growing at a CAGR of 3.97% over the forecast period of 2025-2032.
To Get more information on 2-Ethylhexanol Market - Request Free Sample Report
The 2-Ethylhexanol (2-EH) market growth is majorly propelled by the increasing expansion of the paints, coatings, and adhesives industry. 2-EH is an essential raw material for the production of 2-EH acrylate, which has a wide range of applications in paints, coatings, and adhesives. Shifting focus toward increasing consumption of these products, especially from the construction and automotive industries, is contributing to the 2-ethylhexanol market growth.
For instance, the USD 26 billion U.S. paint and coatings industry employs 300,000 workers and is essential for many sectors, including construction, automotive, and manufacturing.
Petrochemicals, most notably 2-ethylhexanol, are a major feedstock from which those coatings get their raw materials. This, in turn, drives the demand for 2-EH in various adhesive and coating formulations within the industry.
For instance, according to the National Paint and Coatings Association (NPCA), more than USD 14 billion in architectural coatings and USD 8.7 billion in industrial OEM coatings were shipped in 2021 alone.
2-Ethylhexanol Market Dynamics
Drivers
-
Rising Demand for Plasticizers Drives the Market Growth
2-Ethylhexanol(2-EH) is one of the main feedstocks for dioctyl phthalate (DOP) production, which in turn is driving the global 2-Ethylhexanol(2-EH) market. They are used primarily to improve the plasticity, hardness, and heat adaptability of polyvinyl chloride (PVC), which is widely used for construction materials, medical devices, automotive interiors, and consumer goods. Growing demand for flexible PVC, coupled with rising global infrastructure development and consumer goods production, particularly in developing nations, continues to drive consumption of 2-EH.
For instance, in August 2024, BASF signed a Memorandum of Understanding (MoU) with UPC Technology Corporation to supply 2-Ethylhexanol and N-Butanol from its upcoming Oxo plant at the Zhanjiang Verbund site, set to commence operations in 2025.
Restrain
-
Availability of Substitutes May Hamper the Market Growth
The availability of substitutes might challenge the 2-Ethylhexanol market growth shortly. With increasing awareness of the environmental and health hazards of conventional plasticizers, such as the phthalate-based dioctyl phthalate (DOP) originating from 2-EH, the demand for safer and more sustainable alternatives has increased. Citrate, epoxidized soy oil, and other bio-based plasticizers that assert lower toxicity and environmentally friendly properties are driving the demand for the non-phthalate plasticizer market. More and more industries, including automotive, construction, and medical devices, are embracing these substitutes focused on sustainable products. These plasticizers have become more and more famous in the market, thus posing a direct threat to the market for 2-EH-based plasticizers and may restrict the overall 2-EH plasticizer market growth.
Opportunity
-
Technological Advancements in 2-EH Production Creating Opportunities for Market Growth
Manufacturers are investing and focusing on technological developments in the production of 2-Ethylhexanol (2-EH), which is creating lucrative opportunities for the growth of the overall market. As these developments continue, an increasingly energy-efficient, less expensive, and greener way to manufacture 2-EH is being developed by companies. Advancements in catalytic processes and better exploitation of raw materials can lower production costs as well as waste emissions of the materials. Improvements in plant design and automation are also making production more scalable and streamlined for manufacturers, helping them to better address growing 2-EH demand.
The U.S. Department of Energy (DOE) announced in October 2023 a USD 78 million investment for decarbonizing chemical manufacturing. This funding contains a USD 40 million renewal for the Rapid Advancement in Process Intensification Deployment (RAPID) Institute to advance new process technologies that minimize energy use and greenhouse gas emissions from chemical production.
It aims to incorporate sustainable feedstocks and low-carbon energy sources into manufacturing processes and could boost the manufacturing efficiency of chemicals, such as 2-EH.
2-Ethylhexanol Market Segmentation Analysis
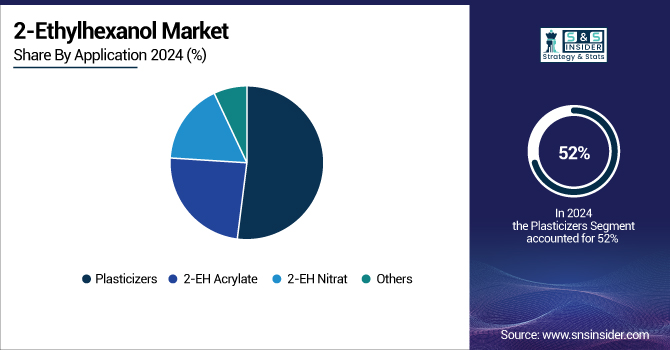
By Application
The plasticizers segment held the largest 2-ethylhexanol market share, around 52% in 2024. Plasticizers are essential for improving the flexibility, durability, and performance of plastic products, especially polyvinyl chloride (PVC). PVC is an extremely versatile material used across a wide range of industries, from construction to automotive, medical devices, and all flexible packaging. Dioctyl phthalate (DOP) and DOP alternative plasticizers are generated using 2-Ethylhexanol raw material and are important polyvinyl chloride (PVC) plasticizers. Increasing global demand for PVC-based products, including those in building and construction and automotive applications, drives plasticizer demand higher.
2-EH Acrylate held a significant market share and was the fastest-growing segment during the forecast period. 2-EH chemical Acrylate is a multifunctional monomer used to tailor the performance profile of various products, including enhancing flexibility, adhesion, and weather resistance. This is especially important when creating high-performance coatings and adhesives, both of which are crucial in automotive, construction, and industrial manufacturing areas. With urbanization, infrastructure development, and a shift toward innovative and long-lasting coatings in the automotive and construction sectors, demand for durable and high-quality coatings is also expected to boost the market.
2-Ethylhexanol Market Regional Outlook
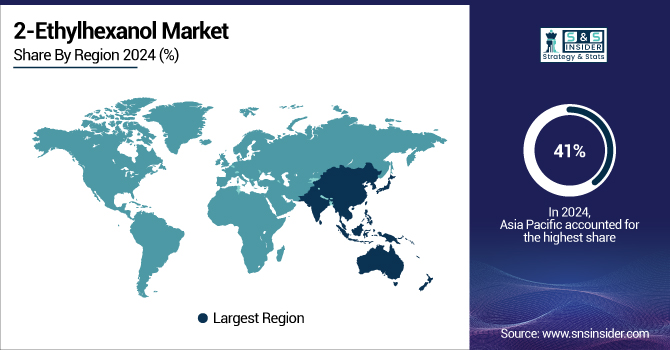
Asia Pacific held the largest market share, around 41%, in 2024. The demand for automotive components, coatings, adhesives, and packaging materials in the growing manufacturing sector, especially in emerging economies such as China and India, is expected to drive the demand for phenolic products. In addition to this, the Asia-Pacific region is also experiencing an increase in the use of sustainable and high-performance materials, which is expected to boost the demand for 2-ethylhexanol.
Moreover, the region is also showing a high market share due to major investments in infrastructure development, especially in the automotive and construction industries, along with the rising adoption of newer technologies. Government initiatives promoting industrialization are also bolstering demand, such as China's "Made in China 2025" strategy and India's "Make in India" drive, which is further augmenting 2-Ethylhexanol demand. This large-scale industrial activity, rapid urbanization, and increasing consumers in the Asia-Pacific region propel the 2-ethylhexanol market growth.
Moreover, for instance, according to UN COMTRADE, China exported USD 482 million of phenols in 2024, ranking it among the top global exporters of phenols.
North America held a significant market share and is a growing region in the forecast period. It is because there are many global manufacturers situated in the region that are involved with the production of 2-Ethylhexanol and 2-Ethylhexanol derivatives, which are majorly utilized in the production of plasticizers, coatings, adhesives, and other chemicals etc. Well-established automotive and construction industry in countries like the U.S. and Canada boosts the demand for these products, especially for flexible PVC, which utilizes 2-Ethylhexanol-based plasticizers. This is also aided by technological advances in manufacturing, supportive regulations, and access to raw feedstock like propylene in the region.
The U.S. Market size was valued at USD 1.04 billion in 2024 and is expected to reach USD 1.44 billion by 2032, growing at a CAGR of 4.19% in the forecast period 2025-2032. This is due to the growing demand for 2-Ethylhexanol, primarily in plasticizers, coatings, and adhesives, leading to strategic investments and expansions across the industry. The increased market demand for sustainable and renewable-based 2-EH products also fits in with the worldwide push toward greener chemical manufacturing.
Moreover, Dow Inc. has a fairly large 2-EH presence in North America from which to capitalize on the increasing demand growth, including its production, namely its large production of 2-EH by converting its widespread C4 production via propylene oxide.
Europe held a significant market share in 2023. It is owing to a well-established industrial ecosystem along with high demand from the plasticizer and coatings applications, coupled with a developing focus on sustainable chemical synthesis in the region. Germany, France, and the Netherlands are leading countries in 2-EH production and demand, mainly due to the well-established automotive and construction industries in these countries and the vast consumption of plasticized PVC in the automotive and construction sectors.
For instance, by 2031, it is anticipated that Germany will use about 55.34 kilotonnes of 2-EH in the production of adhesives.
Get Customized Report as per Your Business Requirement - Enquiry Now
Key Players
2-Ethylhexanols Companies
BASF SE, SABIC, Eastman Chemical Company, Dow Chemical Company, ExxonMobil Chemical, Grupa Azoty, OXEA GmbH, LG Chem, China National Petroleum Corporation (CNPC), KH Neochem Co., Ltd.
These key players help to understand the 2-Ethylhexanol market share, 2-Ethylhexanol market analysis, 2-Ethylhexanol Market Trends, and 2-Ethylhexanol industry trends.
Recent Development:
-
In 2025, OQ Chemical Launched an improved bio-based 2-ehtylhexanol product based on renewable feedstocks, providing a more sustainable choice for plasticizers in PVC production.
-
In February 2024, Eastman Chemical Company (USA) partnered with Dentist Group Nord Pal Plast, a mechanical recycler, to increase efficiency for recycled plastics and improve recycling capacity.
| Report Attributes | Details |
|---|---|
| Market Size in 2024 | USD 6.66 Billion |
| Market Size by 2032 | USD 9.09 Billion |
| CAGR | CAGR of 3.97% From 2025 to 2032 |
| Base Year | 2024 |
| Forecast Period | 2025-2032 |
| Historical Data | 2021-2023 |
| Report Scope & Coverage | Market Size, Segments Analysis, Competitive Landscape, Regional Analysis, DROC & SWOT Analysis, Forecast Outlook |
| Key Segments | • By Application (Plasticizers, 2-EH Acrylate, 2-EH Nitrate, Others) |
| Regional Analysis/Coverage | North America (US, Canada, Mexico), Europe (Germany, France, UK, Italy, Spain, Poland, Turkey, Rest of Europe), Asia Pacific (China, India, Japan, South Korea, Singapore, Australia, Rest of Asia Pacific), Middle East & Africa (UAE, Saudi Arabia, Qatar, South Africa, Rest of Middle East & Africa), Latin America (Brazil, Argentina, Rest of Latin America) |
| Company Profiles | BASF SE, SABIC, Eastman Chemical Company, Dow Chemical Company, ExxonMobil Chemical, Grupa Azoty, OXEA GmbH, LG Chem, China National Petroleum Corporation (CNPC), KH Neochem Co., Ltd. |
Frequently Asked Questions
Ans: Asia Pacific led the 2-Ethylhexanol Market in the region with the highest revenue share in 2023.
Ans: Rising demand for plasticizers drives the market growth.
Ans: Plasticizers will grow rapidly in the 2-Ethylhexanol Market from 2025 to 2032.
Ans: The expected CAGR of the global 2-Ethylhexanol Market during the forecast period is 3.97%.
Ans: The 2-Ethylhexanol Market was valued at USD 6.66 billion in 2024.
Get in Touch
