Epoxidized Soybean Oil Market Report Scope & Overview:
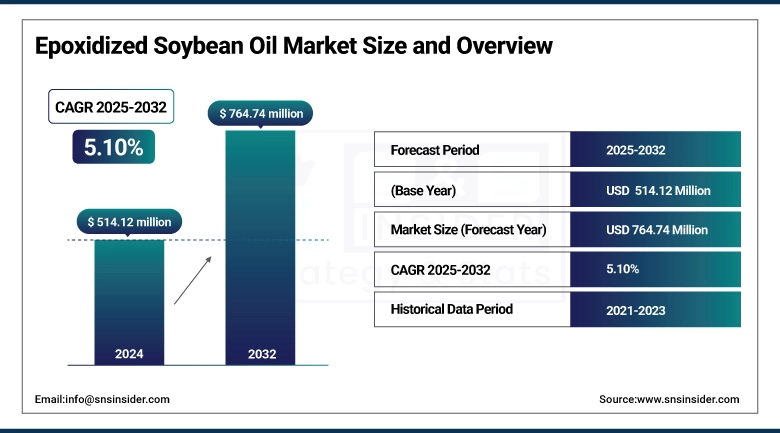
The Epoxidized Soybean Oil Market size was valued at USD 514.12 million in 2024 and is expected to reach USD 764.74 million by 2032, growing at a CAGR of 5.10% over the forecast period of 2025-2032.
Growing regulations to replace phthalates with bio-based plasticizers in end-use applications have led to the acceleration of the epoxidized soybean oil market and the subsequent growth of the epoxidized soybean oil market size, along with the epoxidized soybean oil market share of greener chemistries. Cargill has also completed a large expansion and modernization of its facility in Sidney, Ohio, in 2023 to expand capacity for epoxidized oil production, which will follow the accessorizing as the top-rated epoxidized soybean oil companies in the world. Meanwhile, the development and process intensification of hydrogen peroxide catalysts were the focus of the market exploration of epoxidized soybean oil, leading to yield improvement and low cost.
Epoxidized Soybean Oil Market Size and Forecast
-
Market Size in 2024: USD 514.12 Million
-
Market Size by 2032: USD 764.74 Million
-
CAGR: 5.10% from 2025 to 2032
-
Base Year: 2024
-
Forecast Period: 2025–2032
-
Historical Data: 2022–2024
To Get more information on Epoxidized Soybean Oil Market - Request Free Sample Report
Epoxidized Soybean Oil Market Trends
-
Increasing demand for eco-friendly plasticizers is driving ESBO adoption, with bio-based plasticizers growing at over 6–7% CAGR, replacing phthalates in PVC applications.
-
Strong growth in the food & beverage packaging industry is boosting ESBO usage, as it is widely used as a stabilizer in PVC, with over 65% of ESBO demand coming from packaging applications.
-
Rising regulatory restrictions on phthalate-based plasticizers in regions like Europe and North America are accelerating ESBO adoption, with over 70% of manufacturers shifting toward non-toxic alternatives.
-
Expansion of soybean production is ensuring raw material availability, with global soybean output exceeding 370 million metric tons annually, supporting stable ESBO supply.
-
Growing use in adhesives, coatings, and lubricants is widening application scope, contributing to a market growth rate of around 5–6% CAGR globally.
On the demand side, sales of certified biobased products reached $20.2 billion in fiscal 2022, resulting in a strong adoption of SOEPs in the food & beverages, personal & healthcare, and industrial applications. This spike has increased epoxidized soybean oil market share for personal & healthcare by an estimated of about 15% from 2022 to 2025, paving the way for consistent epoxidized soybean oil market size growth through 2025.
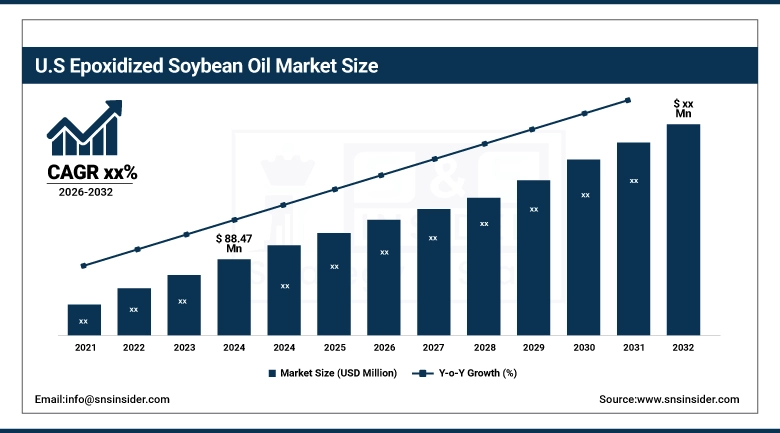
The U.S. led the North American epoxidized soybean oil market with a revenue size of USD 88.47 million, accounting for 72% market share. Through FDA-approved food-film applications, the U.S. represented 72% of fermentation production from the region, and Canada's bio-plastics incentives resulted in a 10% increase in epoxidized oil. This increased output, in turn, solidifies North America's position as the continent with the fastest-growth rate for PVC packaging, with Mexico driving most of the recent growth.
Epoxidized Soybean Oil Market Dynamics
Drivers
-
Accelerated Demand Due to Regulatory Mandates Promoting Phthalate Plasticizers Substitute Trends Impacting Growth of Epoxidized Soybean Oil Market
Strict regulations from government entities like the U.S. EPA and the European Chemicals Agency have resulted in the phase-out of toxic phthalates in plastics, spurring industry to find less harmful substitutes, like epoxidized soybean oil. From 2022 onwards, this trend resulted in a steady increase of ESBO as a replacement in flexible PVC applications and food contact material. This favorable regulatory landscape is fuelling the growth of the epoxidized soybean oil market, leading to its increased adoption as an environmentally safe alternative in green manufacturing.
-
Rising Demand for Epoxidized Soybean Oil To accelerate consumer shift toward sustainably sourced plasticizers
Green plasticizers are gaining importance, both for the consumer and industry. The United Soybean Board claims that 68% of all companies plan to adopt sustainable plasticizing agents, like ESBO, by 2026. Collaborations, like Hallstar’s partnership with a natural cosmetics company, illustrate how sustainability requests are impacting Epoxidized Soybean Oil Market Trends. The move will make Soybean oil epoxidation products have additional relevance in a broad range of applications, and it will boost Epoxidized Soybean Oil Market Research and growth over the forecast period.
Restraints
-
Competition With Alternate Bio-Based Plasticizer Is Likely to Hinder the Market Penetration of Epoxidized Soybean Oil
Epoxidized soybean oil competes with cheaper and similar alternatives, which include epoxidized linseed oil, citrates, and adipates. Di-isononyl adipate gained prominence in 2023, with a global plasticizer market share of 4%. Moreover, castor oil derivatives are preferred in Asian markets because they are easily available and are cheaper. Such competition serves to stifle the epoxidized soybean oil market share and further discourages players from entering into the industry where high sensitivity to price prevails.
-
Limited Awareness of Epoxidized Soybean Oil Benefits in Emerging Applications Restrains Adoption
Although there is established evidence on environmental and technological benefits, high-value industries, such as electronics and biocomposites, hardly exploit epoxidized soybean oil. In the U.S., only 18% of domestic advanced material formulators have dabbled with ESBO, while 27% have been using epoxidized soybean oil, according to a joint 2022 report done by the American Soybean Association and the NREL. The lack of awareness, in turn, hampers the innovation and technology spread and penetrates towards the unexplored segments, which restricts the Epoxidized Soybean Oil Market Size and limits its diversification into next-generation sustainable materials.
Epoxidized Soybean Oil Market Segments
By Application
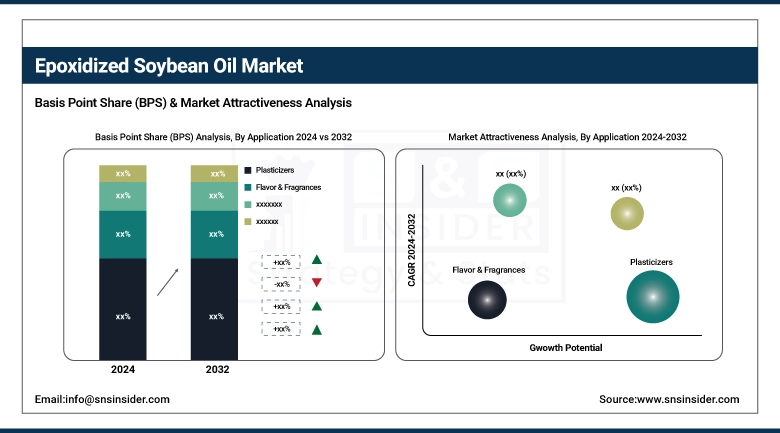
Plasticizers dominated and accounted for 52.8% of the market share in 2024. “PVC flexible” is one of these, where listings with the EPA Safer Choice have driven adoption of ESBO into municipality water-safe piping and food-grade films. According to the American Chemistry Council, usage of ESBO-based plasticizers in “vinyl wrap” applications alone showed a 10% increase year on year in 2023. Ramped-up joint ventures of Epoxidized Soybean Oils Companies with leading PVC compounders have underpinned the dominance of plasticizers.
Pigment dispersion agents are growing at the highest CAGR of 6.7% in the forecast period 2025 to 2032. Their growth is thanks to eco-labeling requirements in Europe, where the European Chemicals Agency reported a 15% rise in approvals for bio-based paint in 2023. The subsegment of “industrial-grade ESBO dispersant” is dominating, with the introduction of certified formulation for waterborne paints by BASF and Hallstar Innovations. This is one of the important factors driving the market in global epoxidized soybean oil market.
By Raw Material
Soybean oil dominated the product segment in 2024, accounting for 61% of the market. Its management demonstrates deep penetration of PVC plasticizer markets, with the approvals of the FDA for food-contact and USDA BioPreferred for epoxidized soybean oil. According to the Biotechnology Innovation Organization, more than 70% of certified bio-based plasticizer applications used epoxidized soybean oil products, emphasizing the importance of the “PVC food‐film” subsegment. Unwavering home-grown soybean reserves in concert with assimilative processing, owing to leading companies, have bolstered them in their lead.
The hydrogen peroxide is projected to grow at the highest CAGR of 5.8% in the forecast period of 2025-2032. Its meteoric rise comes from cutting-edge green epoxidation technology approved by the U.S. Department of Energy that achieved a 20% reagent savings during pilot campaigns. Breaking down the subsegments, the “industrial-grade peroxide” subsegment is leading, driven by scalable, low-waste catalytic systems embraced by Cargill and Arkema. These trends are transforming the Epoxidized Soybean Oil Market Analysis to make it greener.
By End-use Industry
In 2024, Food & Beverages dominated with a 34.5% market share. This is driven by the PVC food-contact packaging subsegment, as FDA approval and USDA BioPreferred purchases have expanded ESBO use in cling films and conveyor belts. According to the Soy-Based Products Council, orders for ESBO-modified films from major grocers have increased by 12% in 2023. Leading epoxidized soybean oil players utilize these endorsements to lock in long-term supply contracts.
Personal & healthcare is the fastest-growing and is expected to grow at a CAGR of 7.2% during the forecast period of 2025–2032. The growth comes from biocare labeling regulations, and in 2023, the American Medical Association noted that certified bio-based medical tubing saw a 20% increase. This is due to a virtual monopoly in this segment by Epoxidized Soybean Oils Companies, which led device manufacturers have partner with, making the “medical-grade ESBO plasticizer” a dominant subsegment. This transition is a prime example of changing Epoxidized Soybean Oil Market Trends toward health-safe materials.
Epoxidized Soybean Oil Market Regional Analysis
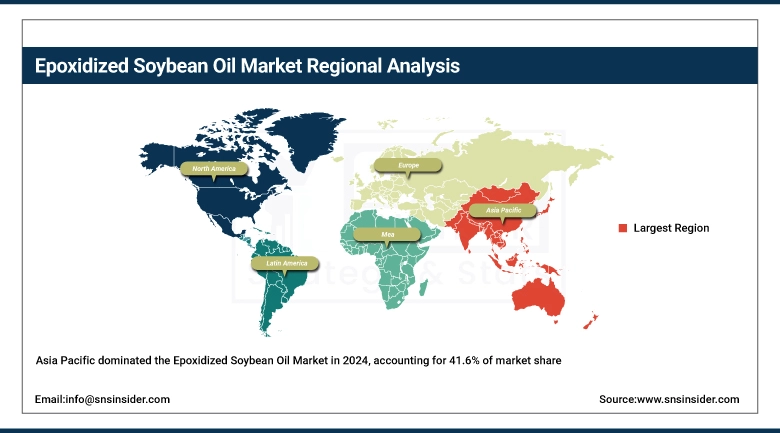
Asia Pacific dominated with a 41.6% share in 2024, fueled by rapid PVC production growth in China and India. China’s five-year bio-economy plan prioritized epoxidized oil integration, increasing local ESBO output by 18% in 2023, according to the Ministry of Industry and Information Technology. India’s incentives for bio-based plasticizers led to Hallstar’s new epoxidation plant in Gujarat. These dynamic investments and government support solidify Asia Pacific’s leadership.
Get Customized Report as per Your Business Requirement - Enquiry Now
North America emerged as the fastest-growing region with the highest CAGR of 23.9% in the forecast period of 2025 to 2032. Its rapid growth is propelled by robust demand for bio-based plasticizers in food-contact PVC and automotive seals, along with USDA BioPreferred procurement, with federal ESBO purchases jumping 15% in 2023.
In 2024, Europe is the second largest market, owning a 24.5% share, led by phthalic anhydrides substituted by epoxidized soybean oil under the framework of REACH. ECHA-certified ESBO dispersants for use in waterborne coatings have driven adoption with an increase of 12% in industrial paint formulations, led by Germany. The other is the sustainable packaging mandates from France, which promoted the soybean oil epoxidation products for flexible films. The Europe region holds the largest revenue share in the global Epoxidized Soybean Oils market as a result of regional regulations and industry partnerships focused on green epoxidation R&D within key European Epoxidized Soybean Oils Companies.
LAMEA is poised for growth due to stable soybean harvests and expanding PVC markets. Brazil's National Soybean Association reported a 9% rise in epoxidation capacity in 2023, focusing on food-contact and agricultural films. Argentina's new ESBO processing lines, under its bio-economy program, align with regional trends toward sustainable materials. The Middle East & Africa region benefits from petrochemical diversification and green initiatives, with the UAE's BioEconomy Strategy and South Africa’s incentives supporting pilot ESBO production. These factors contribute to a 5% increase in bio-preferred plasticizer tenders, boosting market share in infrastructure and packaging applications.
Key Players
The major competitors in the epoxidized soybean oil market include Arkema S.A., Cargill, Incorporated, CHS Inc., NAN YA Plastics Corporation (Formosa Plastics Group), Valtris Specialty Chemicals, Galata Chemicals LLC, Adeka Corporation, Zhejiang Jiaao Enprotech Stock Co., Ltd., Hairma Chemicals (GZ) Ltd., INBRA Indústrias Químicas Ltda
Recent Developments
-
December 2024: Valtris Specialty Chemicals promoted Plas-Chek and Lankroflex ESBOs for flexible PVC, highlighting food-safe, renewable, and Kosher-certified options for diverse applications.
-
September 2024: Mexico launched an antidumping probe into ESBO imports from Brazil and China, covering 85–99% pure content, citing potential injury from underpriced shipments.
| Report Attributes | Details |
|---|---|
| Market Size in 2024 | USD 514.12 million |
| Market Size by 2032 | USD 764.74 million |
| CAGR | CAGR of 5.10% From 2025 to 2032 |
| Base Year | 2024 |
| Forecast Period | 2025-2032 |
| Historical Data | 2021-2023 |
| Report Scope & Coverage | Market Size, Segments Analysis, Competitive Landscape, Regional Analysis, DROC & SWOT Analysis, Forecast Outlook |
| Key Segments | •By Raw Material (Soybean Oil, Hydrogen Peroxide, Others) •By Application (Plasticizers, Pigment Dispersion Agents, Flavor & Fragrances, Functional Fluids, Fuel Additives, Others) •By End-use Industry (Food & Beverages, Personal & Healthcare, Adhesives & Sealants, Automotive & Transportation, Others) |
| Regional Analysis/Coverage | North America (US, Canada, Mexico), Europe (Germany, France, UK, Italy, Spain, Poland, Turkey, Rest of Europe), Asia Pacific (China, India, Japan, South Korea, Singapore, Australia, Rest of Asia Pacific), Middle East & Africa (UAE, Saudi Arabia, Qatar, South Africa, Rest of Middle East & Africa), Latin America (Brazil, Argentina, Rest of Latin America) |
| Company Profiles | Arkema S.A., Cargill, Incorporated, CHS Inc., NAN YA Plastics Corporation (Formosa Plastics Group), Valtris Specialty Chemicals, Galata Chemicals LLC, Adeka Corporation, Zhejiang Jiaao Enprotech Stock Co., Ltd., Hairma Chemicals (GZ) Ltd., INBRA Indústrias Químicas Ltda |
Frequently Asked Questions
Ans: Asia Pacific dominated the Epoxidized Soybean Oil Market in 2024, driven by PVC production growth and strong bioeconomy support in China and India.
Ans: Leading Epoxidized Soybean Oil Market players include Arkema, Cargill, CHS Inc., Valtris, NAN YA Plastics, and Galata Chemicals.
Ans: Plasticizers dominate the Epoxidized Soybean Oil Market, especially in flexible PVC applications used in food-grade films and pipes.
Ans: Soybean oil leads the Epoxidized Soybean Oil Market with a 61% share due to its widespread integration in PVC applications.
Ans: The Epoxidized Soybean Oil Market is expected to reach USD 764.74 million by 2032, growing steadily with a 5.10% CAGR.
Get in Touch
