3D Printing High-Performance Plastic Market Size Analysis:
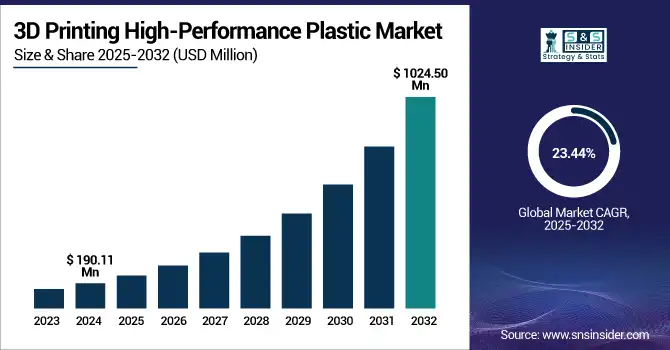
The 3D Printing High-Performance Plastic Market size was valued at USD 190.11 million in 2024 and is expected to reach USD 1,024.50 million by 2032, growing at a CAGR of 23.44% over the forecast period of 2025-2032.
The 3D printing high-performance plastic market is being propelled by the increasing need for durable and lightweight parts from aerospace, healthcare, and defense, contributing to the high demand for advanced materials such as PEEK and PEKK. Key trends in the high-performance plastic 3D printing market, such as carbon-fiber reinforcement, powder-reuse in SLS technology, and inventory digitalization for better efficiency in additive manufacturing markets, are being taken into account. Leading 3D printing high-performance plastics firms are concentrating on personalized implants and sustainability to boost the 3D printing high-performance plastics market share.
For instance, in April 2023, VESTAKEEP i4 3DF PEEK was used during the first U.S. spinal surgeries, by Evonik, meeting ASTM F2026 norms. In addition, the company debuted VESTAKEEP iC4612 and iC4620 in October 2023, the world’s first carbon-fiber reinforced PEEK filaments suitable for permanent implants, a breakthrough in 3D print materials innovation.
These developments demonstrate robust 3D printing high-performance plastic market expansion due to pioneering 3D printing high-performance plastic market value analysis and preference for high-value polymers.
3D Printing High-Performance Plastic Market Size and Forecast:
-
Market Size in 2024: USD 190.11 million
-
Market Size by 2032: USD 1,024.50 million
-
CAGR: 23.44% from 2025 to 2032
-
Base Year: 2024
-
Forecast Period: 2025–2032
-
Historical Data: 2022–2023
To Get more information on 3D Printing High-Performance Plastic Market - Request Free Sample Report
3D Printing High-Performance Plastic Market Trends
-
Increasing adoption of additive manufacturing in aerospace, automotive, and healthcare industries is significantly driving demand for high-performance plastics due to their superior strength-to-weight ratio and thermal resistance.
-
Rising preference for lightweight and durable materials such as PEEK, PEKK, and ULTEM in functional prototyping and end-use production parts is accelerating market growth.
-
Continuous advancements in 3D printing technologies, including selective laser sintering (SLS) and fused deposition modeling (FDM), are enhancing material compatibility and print precision for high-performance polymers.
-
Growing demand for customized and complex geometrical components across industrial applications is expanding the utilization of engineering-grade thermoplastics in additive manufacturing.
-
Expansion of industrial-scale 3D printing facilities and integration of digital manufacturing workflows are improving production efficiency and reducing material waste.
-
Increasing R&D investments by material manufacturers to develop bio-based and recyclable high-performance plastics are supporting sustainability initiatives within the additive manufacturing ecosystem.
-
Emerging applications in medical implants, dental components, and high-temperature electrical parts are creating new revenue opportunities for high-performance 3D printing plastics.
3D Printing High-Performance Plastic Market Drivers:
-
FDA clearances accelerate the adoption of implant-grade PEEK materials in medical applications
The 3D printing high-performance plastic is gaining traction on account of the FDA approvals of PEEK implants. VESTAKEEP i4 3DF PEEK Filament from Evonik received 510(k) clearance in April 2023 for spinal implants. A year later, in April of 2024, 3D Systems also obtained FDA clearance for its VSP PEEK cranial implant, which has been seen to reduce material waste by as much as 85%. These clearances confirm the clinically safe use of PEEK & PEKK and increase PEEK & PEKK penetration, steering forward 3D-printing high-performance plastic market gains in the medical industry.
-
Implementation of powder recycling in SLS processes improves sustainability and reduces manufacturing costs
Recycling of powder not used in SLS is causing sustainability and cost effectiveness to increase throughout the 3D printing highly competitive plastic market. As per the Metal Powder Industries Federation, 98% of non-sintered powder is recyclable in powder bed fusion processes, with minimal harm. This practice saves up to 15% on material costs, and it is conducive to circular manufacturing. Thanks to the inclusion of recycling procedures, companies are maximizing the utility of polymers as well as enhancing the productivity and cost efficiency of powder-based 3D printing materials for mass production. This is consistent with growing needs in the additive manufacturing market for cost-effective and environmentally friendly solutions.
3D Printing High-Performance Plastic Market Restraints:
-
The high price of implant-grade PEEK & PEKK filaments limits widespread market access.
Although PEEK/PEKK filaments have been high on performance, it is still far too costly for most applications beyond aerospace and medical. According to 3D Systems, while FDA-cleared cranial implants can save up to 85% in material waste, full-scale production is still costly. It’s resource-intensive for hospitals and clinics to invest in, and its cost prohibits widespread uptake. This price barrier shrinks 3D printing high-performance plastic market share in wide-ranging industrial practices, hence retarding the move of functional part manufacturing into price sensitive areas.
3D Printing High-Performance Plastic Market Segmentation Analysis:
By Type
PEEK & PEKK dominated the type segment with a 33.8% market share in 2024, owing to widespread application across powertrain parts. automobiles Delphi Technologies PEEK & PEKK for high-temperature fuel pump housing, providing 15% mass savings vs metal along with far superior thermal stability while meeting SAE J2010. It has already been found that PEEK performs under 200 °C engine environments by the United States Department of Energy’s Vehicle Technologies Office, which, in turn, solidifies its lead in making 3D printed high-performance plastic vehicle analysis with consistent lightweight material.
Reinforced high-performance plastics grew fastest with a 24.6% CAGR from 2025 to 2032, driven by advanced glass-fiber composites in rail applications. With Alstom, the 2024 trials of 3-D printed glassfibre-reinforced PPSU coupler components in 3-D resulted in a 25% weight reduction and met EN 45545 fire standards. The use of recycled fiber composites in passenger car interiors gained the stamp of approval from the Federal Railroad Administration. These advances speak to 3D printed high performance plastic market dynamics that are moving towards materials which are effective, sturdy, cost-efficient, and additive manufacturing market-share-strengthening.
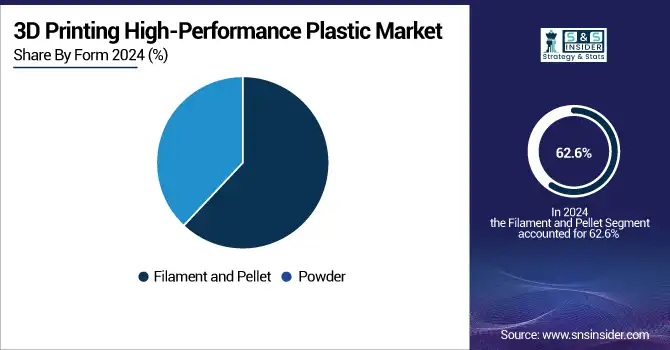
By Form
Filament and pellet form dominated with a 62.6% market share in 2024, in dental laboratories. Ivoclar Vivadent’s 2023 introduction of PEEK filament for 3D-printed dental crowns made their products biocompatible under ISO 10993 regulations and cut milling waste by 30 percent. The American Dental Association released recommendations that supported filament materials for 3D printing when producing custom prosthetics, thus widely popularising their use within dental services. These reasons reassert why filament and pellet are the basis of the 3D printing high-performance materials market for accurate patient-specific dental applications.
Powder form is the fastest growing with a 23.56% CAGR through 2032, fueled by orthopedic implant production. The Food and Drug Administration’s white paper on powder-bed fusion in 2022 has confirmed that 95% of virgin PEEK powders remain specification-compliant after three cycles of reuse, thus vastly improving sustainability and the overall ratio of cost of ownership. SLS-printed PEEK hip joint prototypes of ZB likewise met ASTM F3091 mechanical requirements, indicating that they could be used clinically when formally launched in 2023. These announcements highlight the strategic move to powder-based 3D printing materials into high-performance plastics.
By Technology
FDM/FFF dominated with a 58.4% market share in 2024, due to broad availability in academic research. In 2023, the National Institute of Standards and Technology found that 95% of samples printed with PEEK filament were measured accurately to within 0.1 mm, which would lead to greater accuracy in the prototyping process. Schools like MIT with the Additive Manufacturing Laboratory were incorporating multi-material PEEK workflows that helped validate designs quickly. These factors confirm why FDM/FFF remains the leading platform in the 3D printing high-performance plastic market analysis, bridging research innovation and industrial application.
Selective laser sintering is the fastest-growing with a 23.63% CAGR through 2032, widely propelled by global aerospace certification programs. The 2021 Federal Aviation Administration 3D printing roadmap included support for PEEK SLS parts for non-critical aircraft interiors after stringent testing revealed that components retained 90% of their tensile strength across four cycles of re-use. The qualification of SLS-printed PEEK brackets by Honeywell Aerospace in 2022 to SAE AMS 7031 standards saw a 15% reduction in weight. These developments are further evidence that SLS is shaping additive manufacturing trends for durable, high-performance 3D printing materials.
By Application
Prototyping dominated with a 47.3% market share in 2024, driven rapidly by customized hearing aid shells. In 2022, researchers at the Department of Energy's Oak Ridge National Laboratory found that FDM-printed PEEK prototypes cut development cycles by 35% and saved mechanical fidelity. Engineering at Purdue University incorporates high-performance plastic prototyping into the capstone project to expedite student-led creative design. These academic and research-based activities define 3D printing high-performance plastic market study, validating prototyping as the base application for the emerging technologies of additive manufacturing market.
Functional part manufacturing is the fastest growing with a 23.73% CAGR through 2032, spurred by on-demand automotive tool production. Within the U.S. Department of Defense’s Equipping Force, a directive to 2023 was established authorizing SLS-printed PEEK jigs, capable of with a 40% reduction in tooling lead time. It was proven that PEEK fixtures are able to improve precision in the assembly line with MCoE directive, and reinforced PEEK fixture was tested at Michigan Lab of Ford Motor Company for assembly line integration. These projects reveal the dynamic 3D printing high performance plastic market trends, and the trend of the movement from prototyping to end-use production in the additive manufacturing market applications.
By End-use Industry
Medical and healthcare dominated with a 29.2% market share in 2024, driven rapidly by customized hearing aid shells. A 2022 study by the National Institutes of Health found PEEK-printed ear molds resulted in 25% fewer fitting adjustments and better clinical patient comfort. Siemens Healthineers launched new PEEK & PEKK cartridges for audiology in-office manufacturing under ISO 13485, improving clinical processes. “This is a prime example of 3D plastic printing market expansion being the product of customized applications, with medical being at the forefront of driving additive manufacturing dynamics.
Aerospace and defense is the fastest growing with a 24.04% CAGR through 2032, led by next-generation unmanned aerial vehicle component printing. U.S. Air Force Research Laboratory’s 2023 assessment that SLS-printed PEEK fairings met MIL-STD-810H impact standards and reduced drone weight by 18%. Boeing uses carbon-fiber reinforced PEEK for landing gear brackets, which were qualified at Boeing’s Phantom Works division to SAE AMS 7032 for increased toughness. These scenarios illustrate the market trends of additive manufacturing and the increasing importance of 3D printing in the defense market with a focus on high-performance plastics innovations.
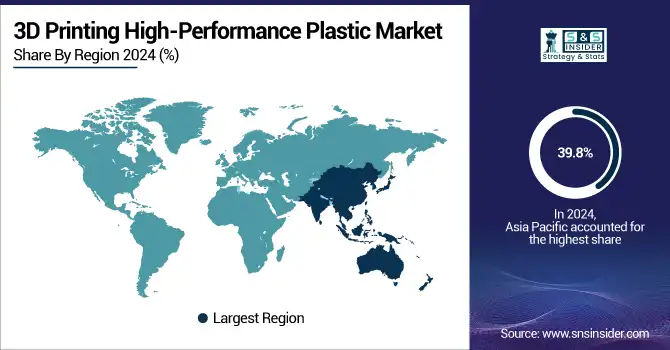
3D Printing High-Performance Plastic Market Regional Insights:
The North American market was the largest high-performance plastic for 3D printing with a market size of 39.8% in 2024, owing to strong federal support for research and industry adoption of PEEK & PEKK materials. SLS 3D printed PEEK. In fact, in 2023, the U.S. National Institute of Standards and Technology found that SLS-printed PEEK parts fell within a 0.05 mm dimensional tolerance in 95% of builds, which makes prototyping and short runs easier. Canada’s National Research Council-certified powder-bed fusion recycling protocols reduced polymer waste by 12%, contributing to the area’s reputation as a leader in sustainable, high-performance 3D printing material.
The U.S. accounted for approximately 70% of North America’s demand in 2024with a market size of USD 53.04 million in 2024 and is projected to reach a value of USD 282.46 million by 2032, anchored by government support for medical and aerospace additive manufacturing. US Department of Department of Energy’s Oak Ridge National Lab even announced PEEK & PEKK filament prototypes reduced powertrain development time by 30% and the Federal Aviation Administration initiated flying machines with SLS-printed PEEK brackets for non-critical aircraft interiors ASTM F2020, already under SAE AMS 7031. In relation to the 3D printing high performance plastic market, these new programs enhance the U.S position of dominance.
Asia Pacific is the second-dominant region in the 3D printing high-performance plastic market with a 27.4% share in 2024 and is the fastest-growing with a 23.94% CAGR, driven by national standards and manufacturing investments. In 2023, the China National Additive Manufacturing Standardization Committee also published guidelines for PEEK SLS to promote its industrialization, also Japan’s Ministry of Economy, Trade and Industry provided ¥1 billion ($US90M) in funding to encourage PEEK powder re-use research. China accounted for almost 50% of demand in the region, driven by PEEK & PEKK capacity increases of 25% in Shanghai and local material initiatives.
Get Customized Report as per Your Business Requirement - Enquiry Now
3D Printing High-Performance Plastic Market Key Players:
The major 3D printing high-performance plastic market competitors include Evonik Industries AG, Arkema S.A., Solvay SA, SABIC, Victrex plc, BASF SE, Dow Inc., DuPont de Nemours, Inc., Hexcel Corporation, and Ensinger GmbH.
Recent Developments in the 3D Printing High-Performance Plastic Market:
-
In March 2025, Evonik announced 3DChimera as its official U.S. distributor for high‑flexibility, high‑temperature‑resistant INFINAM PA12 powders, optimized for industrial powder‑bed fusion
| Report Attributes | Details |
|---|---|
| Market Size in 2024 | USD 190.11 million |
| Market Size by 2032 | USD 1,024.50 million |
| CAGR | CAGR of 23.44% From 2025 to 2032 |
| Base Year | 2024 |
| Forecast Period | 2025-2032 |
| Historical Data | 2021-2023 |
| Report Scope & Coverage | Market Size, Segments Analysis, Competitive Landscape, Regional Analysis, DROC & SWOT Analysis, Forecast Outlook |
| Key Segments | •By Type (Polyamide (PA), Polyetheramide (PEI), Polyetheretherketone (PEEK) and Polyetherketoneketone (PEKK), Reinforced HPPs, Others) •By Form (Filament and Pellet, Powder) •By Technology (Fused Deposition Modelling (FDM)/Fused Filament Fabrication (FFF), Selective Laser Sintering (SLS)) •By Application (Prototyping, Tooling , Functional Part Manufacturing) •By End-use Industry (Medical and Healthcare, Aerospace and Defense, Transportation, Oil and Gas, Consumer Goods, Others) |
| Regional Analysis/Coverage | North America (US, Canada, Mexico), Europe (Germany, France, UK, Italy, Spain, Poland, Turkey, Rest of Europe), Asia Pacific (China, India, Japan, South Korea, Singapore, Australia, Rest of Asia Pacific), Middle East & Africa (UAE, Saudi Arabia, Qatar, South Africa, Rest of Middle East & Africa), Latin America (Brazil, Argentina, Rest of Latin America) |
| Company Profiles | Evonik Industries AG, Arkema S.A., Solvay SA, SABIC, Victrex plc, BASF SE, Dow Inc., DuPont de Nemours, Inc., Hexcel Corporation, Ensinger GmbH |
Frequently Asked Questions
The medical industry leads adoption with FDA-cleared PEEK implants and ISO-certified custom audiology applications.
The aerospace sector boosts growth with qualified SLS-printed PEEK parts for UAVs and aircraft interiors.
PEEK & PEKK dominate the type segment with a 33.8% market share due to powertrain and aerospace applications.
The 3D Printing High-Performance Plastic market is projected to grow at a CAGR of 23.44% from 2025 to 2032.
The 3D printing high-performance plastic market size was valued at USD 190.11 million in 2024.
Get in Touch
