3D Sensor Market Size & Trends:
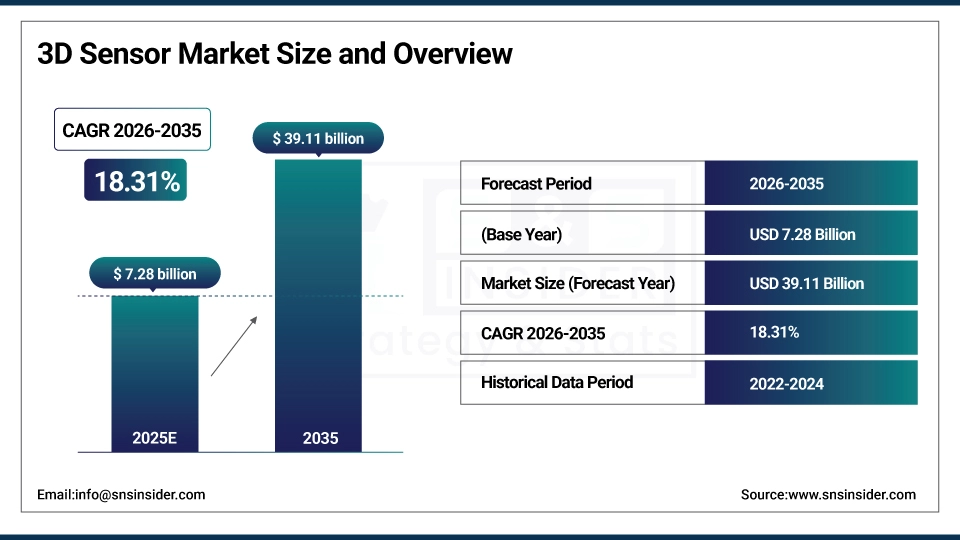
The 3D Sensor Market Size is estimated at USD 7.28 Billion in 2025E and is projected to reach USD 39.11 Billion by 2035, growing at a CAGR of 18.31% during 2026–2035.
The 3D Sensor Market analysis provide a picture of the 3D sensing technologies, depth perception processes, device architectures, and how these technologies are being used in different industries. During the forecast period, the market is likely to increase because there is a growing need for spatial awareness, machine vision accuracy, real-time depth mapping, and object recognition in industrial automation, automotive safety systems, consumer electronics, and healthcare applications.
3D sensors are increasingly embedded in over 2.4 billion smart devices, vehicles, and industrial systems globally by 2025 due to the advancements in imaging technologies, AI-based perception algorithms, and integration of depth-sensing modules in compact form factors.
3D Sensor Market Size and Growth Projection:
-
Market Size in 2025E: USD 7.28 Billion
-
Market Size by 2035: USD 39.11 Billion
-
CAGR: 18.31% (2026–2035)
-
Base Year: 2025
-
Forecast Period: 2026–2035
-
Historical Data: 2022–2024
To Get more information on 3D Sensor Market - Request Free Sample Report
3D Sensor Market Trends
-
Rising adoption of ADAS and autonomous vehicles is increasing the use of 3D sensors for object detection, collision avoidance, and real-time mapping.
-
Growing integration of facial recognition and gesture sensing in consumer electronics is driving large-scale adoption of time-of-flight and structured light 3D sensors.
-
Emphasis on Industry 4.0 and smart manufacturing is boosting demand for 3D vision sensors in robotics, quality inspection, and automated material handling.
-
Advancements in AI-enabled image processing and edge computing are improving the accuracy, speed, and reliability of 3D sensing solutions.
-
Expansion of medical imaging, robotic surgery, and patient monitoring is supporting increased use of 3D sensors for precise depth measurement and visualization.
-
Focus on miniaturization, low power consumption, and cost efficiency is accelerating integration of 3D sensors into wearables, AR/VR devices, and IoT platforms.
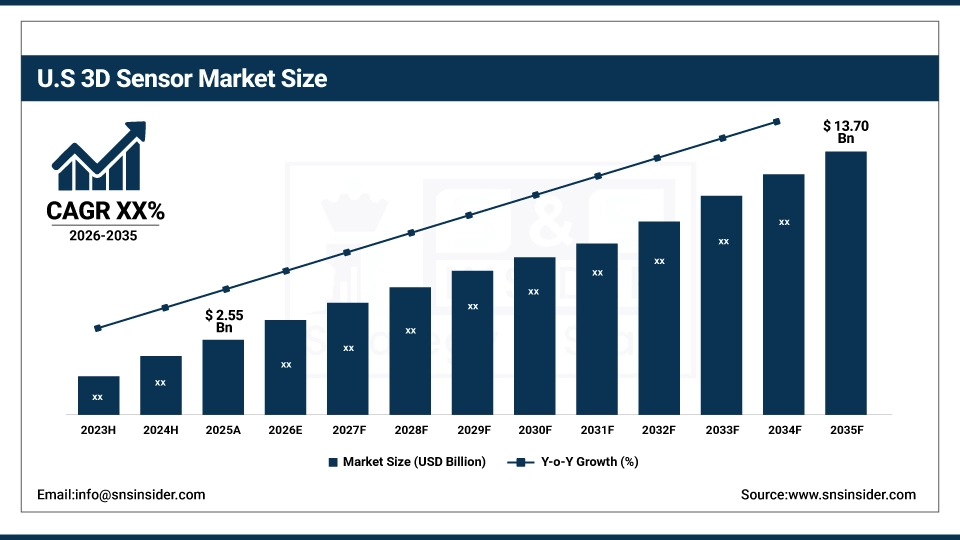
U.S. 3D Sensor Market Size Outlook
In 2025, the U.S. 3D Sensor market was worth USD 2.55 billion. By 2035, it is expected to be worth USD 13.70 billion. Strong investments in self-driving cars, industrial automation, defense imaging systems, and new consumer devices are driving growth. The U.S. is a prominent player in the development and commercialization of 3D sensor technology since a lot of people use AI-driven vision systems and the country spends a lot of money on defense and semiconductor research and development.
3D Sensor Market Growth Drivers:
-
Rising Demand for Advanced Perception and Depth Sensing Technologies
The 3D Sensor Market is growing as there is a lot of need for accurate spatial perception. More and more applications in car safety systems, industrial robotics, smart logistics, consumer electronics, and medical imaging depend on accurate depth measurement and 3D visualization. 3D sensors make it possible to find objects, measure distances, and map the environment in real time. This greatly increases safety, automation efficiency, and user experience.
Automakers are adding 3D sensors to ADAS and self-driving cars to help them find lanes, recognize pedestrians, and avoid obstacles. Industrial automation systems also use 3D vision sensors to improve the precision of robotic guiding, defect identification, and dimensional inspection. These new uses are making the need for superior 3D sensing technologies even stronger across several sectors.
By 2025, shipments of 3D sensors are expected to top 1.1 billion units, thanks to their growing use in smartphones, cars, and industrial equipment.
3D Sensor Market Restraints:
-
High System Costs and Integration Complexity
High system costs and complicated integration are still major problems for the 3D Sensor Market. Advanced 3D sensing technologies, such as time-of-flight modules, structured light systems, and high-resolution image sensors, need advanced optics, calibration, and computing power. These things make the bill of materials more expensive and make it harder for applications that need to keep prices down.
Adding 3D sensors to current systems often needs unique hardware interfaces, software algorithms, and AI-based data processing, which makes development take longer and costs more. Also, performance that is sensitive to things like lighting, temperature, and surface reflectivity can make it hard to use in some situations. These problems make it hard for small and medium-sized enterprises to embrace, even when there is a lot of long-term demand.
3D Sensor Market Opportunities:
-
Expansion of Autonomous Systems and Smart Devices
The 3D Sensor Market has a big opportunity to grow because more and more autonomous systems and smart gadgets are being used. 3D sensors are becoming more and more important for autonomous vehicles, drones, service robots, and smart infrastructure to find their way, recognize objects, and be aware of their surroundings. Improvements in AI and edge computing are making it possible to process 3D data more quickly, which opens up new uses and makes systems work better.
To make smartphones, tablets, laptops, and AR/VR gadgets safer, easier to use, and more immersive, consumer electronics companies keep adding 3D sensors to these products. In healthcare, the growing usage of robotic surgery and non-invasive diagnostic systems makes the need for high-precision 3D sensing technology even stronger. Sensor makers that offer scalable, accurate, and cost-effective solutions can take advantage of these developments to build their businesses.
By 2025, more than 34% of the world's demand for 3D sensors is estimated to come from autonomous and smart device applications.
3D Sensor Market Segmentation Analysis
-
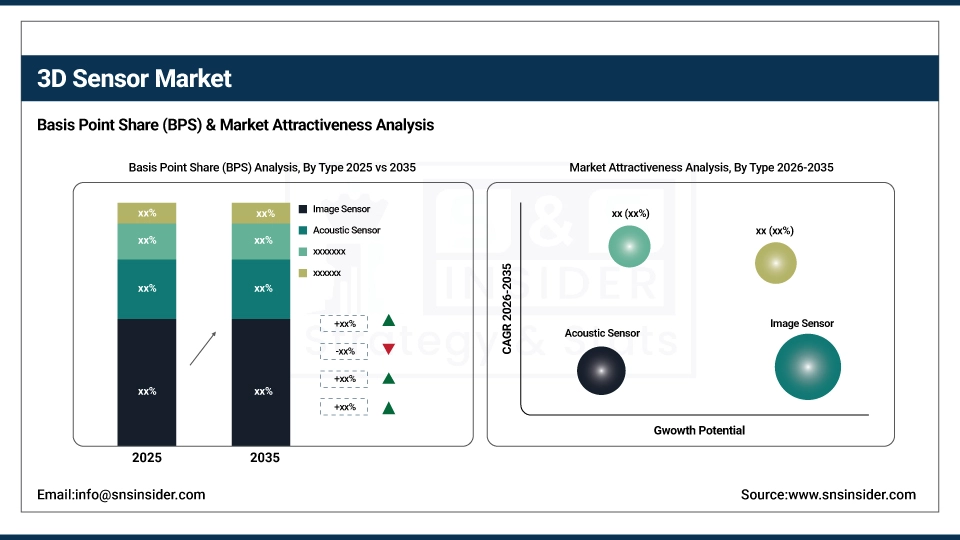
By Type, Image Sensors held the largest market share of 41.28% in 2025, while Accelerometers are expected to grow at the fastest CAGR of 14.62% during 2026–2035.
-
By Technology, Time-of-Flight dominated with a 36.94% share in 2025, while Structured Light is projected to expand at the fastest CAGR of 15.18% during the forecast period.
-
By End User, Consumer Electronics accounted for the highest share of 38.56% in 2025, while Automotive is forecasted to grow at the fastest CAGR of 14.91% during 2026–2035.
By Type, Image Sensors Dominate While Accelerometers Expand Rapidly
Image sensors make up the majority of the 3D sensor market since they are used in a wide range of devices, including smartphones, industrial vision systems, automotive cameras, and medical imaging equipment. These sensors can be used in many different ways to make high-resolution depth maps, recognize faces, and find objects. In 2025, more than 820 million devices had image-based 3D sensing modules, which made them even more popular.
Accelerometers are the fastest-growing segment of the market as they are being used more and more in motion tracking, gesture recognition, and inertial sensing in cars, consumer electronics, and wearable devices. The growing use of sensor fusion technologies is speeding up the use of accelerometers in 3D perception systems.
By Technology, Time-of-Flight Dominates While Structured Light Expands Rapidly
Time-of-Flight (ToF) technology is the best on the market since it can accurately calculate depth, sense things across great distances, and work well in different lighting circumstances. Smartphones, car LiDAR systems, and industrial automation platforms all use ToF sensors a lot. More than 600 million ToF-based sensors were sent globally in 2025.
Structured Light is the technology that is growing the fastest due to its use in high-precision fields like facial recognition, 3D scanning, and medical imaging. The growing adoption of projection technology in consumer electronics and healthcare is being helped by constant advancements in accuracy and processing algorithms.
By End User, Consumer Electronics Dominate While Automotive Expands Rapidly
Consumer Electronics dominate the 3D Sensor Market as manufacturers integrate depth sensing into smartphones, tablets, gaming devices, and AR/VR headsets. 3D sensors enhance biometric security, immersive experiences, and interactive interfaces. In 2025, over 55% of flagship smartphones incorporated at least one 3D sensing module.
Automotive is the fastest-growing end-user segment, driven by rising adoption of ADAS and autonomous driving technologies. Vehicle manufacturers increasingly deploy 3D sensors for driver monitoring, surround-view systems, and obstacle detection, reinforcing strong growth prospects through 2035.
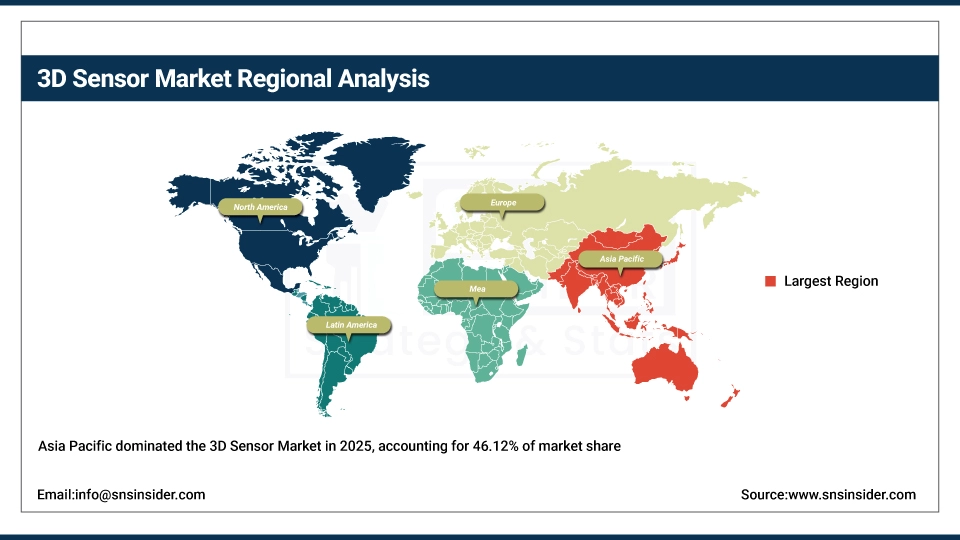
Asia Pacific 3D Sensor Market Insights:
Asia Pacific had the biggest share of the 3D Sensor Market in 2025, with an estimated 46.12% due to the large-scale production of electronics, strong semiconductor ecosystems, and high use of smartphones, automotive electronics, and industrial automation in China, Japan, South Korea, and Taiwan. Continued investments in smart factories and AI-enabled sensors help the region stay at the top.
Get Customized Report as per Your Business Requirement - Enquiry Now
China 3D Sensor Market Insights:
China's 3D sensor market is growing quickly as it has a huge base of consumer electronics, more electric vehicles are being made, and the government is supporting efforts to localize semiconductors. China makes up more than 40% of demand in the Asia-Pacific region. 3D cameras, facial recognition, and machine vision systems are becoming very popular in both consumer and industrial sectors.
North America 3D Sensor Market Insights:
In 2025, North America had around 26.4% share of the global 3D Sensor Market. This was due to early acceptance of advanced sensing technologies, high levels of research and development funding, and the widespread usage of 3D sensors in self-driving cars, healthcare imaging, and industrial robotics. The area benefits from the tight cooperation between developers of sensors, AI software, and system integrators.
U.S. 3D Sensor Market Insights:
The U.S. leads the North American market, contributing nearly 78% of regional revenue, due to the high demand from autonomous vehicles, defense, medical diagnostics, and smart manufacturing. High investments in LiDAR, time-of-flight (ToF), and AI-enabled 3D vision systems continue to support sustained growth.
Europe 3D Sensor Market Insights:
Europe accounted for around 21.8% of the global 3D Sensor Market in 2025, owing to the strong automotive production, Industry 4.0 adoption, and demand for precision sensing in robotics and quality inspection. Regulatory emphasis on safety and automation further supports steady regional growth.
Germany 3D Sensor Market Insights:
Germany represents over 32% of the European market owing to its advanced automotive and industrial automation sectors. High adoption of 3D vision systems for robotic guidance, metrology, and smart factories positions Germany as a core European hub for 3D sensor deployment.
Latin America 3D Sensor Market Insights:
In 2025, Latin America had about 3.4% of the global market. This was because important economies were slowly adopting industrial automation, smart infrastructure, and car production. More money is going into logistics automation and security systems, which is making demand in the area go up.
Brazil 3D Sensor Market Insights:
Brazil held around 45% of the Latin American market due to its automobile assembly, warehouse automation, and the growing usage of 3D sensors in surveillance and access control systems. Government programs that encourage digitization are also helping people adopt it.
Middle East & Africa 3D Sensor Market Insights:
The Middle East & Africa region accounted for about 2.3% of the global 3D Sensor Market in 2025, driven by smart city projects, infrastructure modernization, and growing use of 3D sensing in security, construction, and healthcare.
United Arab Emirates 3D Sensor Market Insights:
The UAE leads the regional market, contributing over 35% of MEA demand, supported by smart city initiatives, biometric security deployment, and investments in AI-driven infrastructure. Adoption of 3D sensors in transportation, surveillance, and healthcare is propelling the market growth globally.
3D Sensor Market Competitive Landscape
Infineon Technologies AG
Infineon Technologies AG is a top global semiconductor business that specializes in power systems, sensors, and security solutions. It was founded in 1999 and has its main office in Germany. The company is a major player in 3D sensing thanks to its innovative sensor ICs that are utilized in consumer electronics, industrial automation, and cars. Its portfolio includes applications for depth sensing, motion detection, and industrial vision.
-
In 2024, Infineon expanded its sensor portfolio with enhanced industrial-grade 3D sensing solutions targeting robotics, factory automation, and smart infrastructure.
Microchip Technology Inc.
Microchip Technology Inc. is a leading supplier of microcontrollers, analog devices, and embedded control solutions. The company was formed in 1989 and is based in the U.S. The business makes 3D sensor systems possible by providing processing, connection, and timing solutions that are utilized in industrial automation, medical devices, and consumer electronics. Its platforms make it possible to get data reliably and integrate sensors in real time.
-
In 2023, Microchip introduced new embedded processing and sensor interface solutions optimized for real-time 3D sensing and industrial IoT applications.
Sony Group Corporation
Sony Group Corporation, which was founded in 1946 and has its main office in Japan, is a world leader in imaging and sensor technology. Sony's CMOS image sensors are used in a lot of consumer electronics, automotive, and entertainment applications, such as optical 3D sensing, motion capture, and depth mapping. The company's sensors work well with great resolution, speed, and minimal noise.
-
In 2024, Sony launched advanced CMOS sensors designed for next-generation 3D depth sensing and machine vision applications.
KEYENCE CORPORATION
KEYENCE Corporation, which is situated in Japan and was founded in 1974, is one of the best companies in the world in making sensing and factory automation technology. The company sells a wide range of 3D sensors, vision systems, and laser measurement tools that are utilized in smart manufacturing, quality control, and robotics. KEYENCE is noted for its non-contact measurement methods that are very accurate and models that can be set up quickly.
-
In 2023, KEYENCE introduced next-generation 3D vision sensors with improved depth accuracy and faster processing for automated inspection systems.
Top 3D Sensor Companies are:
-
Microchip Technology Inc.
-
Sony Group Corporation
-
KEYENCE CORPORATION
-
Microsoft Corporation
-
Intel Corporation
-
Qualcomm Technologies Inc.
-
Texas Instruments
-
Cognex Corporation
-
LMI Technologies Inc.
-
ifm efector, inc.
-
ASUSTeK Computer Inc.
-
Panasonic Corporation
| Report Attributes | Details |
|---|---|
| Market Size in 2025E | USD 7.28 Billion |
| Market Size by 2035 | USD 39.11 Billion |
| CAGR | CAGR of 18.31 % From 2026 to 2035 |
| Base Year | 2025E |
| Forecast Period | 2026-2035 |
| Historical Data | 2022-2024 |
| Report Scope & Coverage | Market Size, Segments Analysis, Competitive Landscape, Regional Analysis, DROC & SWOT Analysis, Forecast Outlook |
| Key Segments | • By Type (Acoustic Sensor, Accelerometer, Image Sensor, Others) • By Technology (Projected Light/ Structured Light, Stereo Vision, Time-of-Flight, Ultrasound) • By End User (Industrial, Automotive, Logistics, Aerospace & Defense, Consumer Electronics, Healthcare & Medical Devices) |
| Regional Analysis/Coverage | North America (US, Canada), Europe (Germany, UK, France, Italy, Spain, Russia, Poland, Rest of Europe), Asia Pacific (China, India, Japan, South Korea, Australia, ASEAN Countries, Rest of Asia Pacific), Middle East & Africa (UAE, Saudi Arabia, Qatar, South Africa, Rest of Middle East & Africa), Latin America (Brazil, Argentina, Mexico, Colombia, Rest of Latin America). |
| Company Profiles | Infineon Technologies AG (Germany), Microchip Technology Inc. (USA), Sony Group Corporation (Japan), KEYENCE CORPORATION (Japan), STMicroelectronics (Switzerland), Microsoft Corporation (USA), Intel Corporation (USA), Qualcomm Technologies Inc. (USA), Texas Instruments (USA), Occipital Inc. (USA), Cognex Corporation (USA), LMI Technologies Inc. (Canada), SOFTKINETIC (Belgium), Optima S.A. (France), ifm Efector, Inc. (Germany), ASUSTeK Computer Inc. (Taiwan), Panasonic Corporation (Japan). |
Get in Touch
