Actigraphy Device Market Report Scope & Overview:
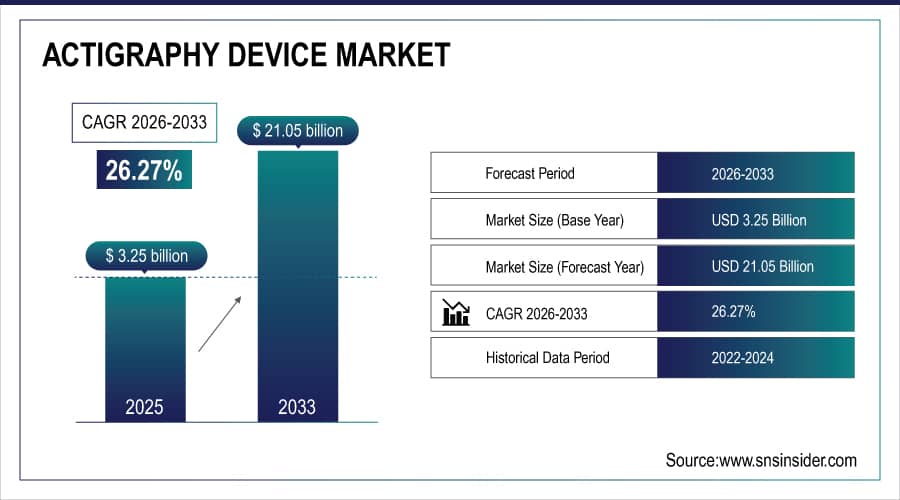
The Actigraphy Device Market size is estimated at USD 3.25 billion in 2025 and is expected to reach USD 21.05 billion by 2033, growing at a CAGR of 26.27% over the forecast period 2026-2033.
Actigraphy Device Market is growing due to increasing prevalence of sleep disorders, rising adoption of remote patient monitoring, and growing awareness about circadian rhythm health. Healthcare providers and consumers are adopting wearable and non-wearable actigraphy solutions for objective sleep assessment, chronic disease management, and mental health monitoring. Technological advancements in sensor accuracy, AI integration for data analysis, and expansion of telehealth services further drive the market’s rapid expansion globally.
76% of sleep laboratories integrated advanced actigraphy devices with AI analytics improving sleep disorder diagnosis accuracy by 45% and enabling remote patient monitoring for 60% more cases compared to traditional methods.
To Get More Information On Actigraphy Device Market - Request Free Sample Report
Actigraphy Device Market Size and Forecast
-
Market Size in 2025E: USD 3.25 Billion
-
Market Size by 2033: USD 21.05 Billion
-
CAGR: 26.27% from 2026 to 2033
-
Base Year: 2025E
-
Forecast Period: 2026–2033
-
Historical Data: 2022–2024
Actigraphy Device Market Trends
-
Rising integration of actigraphy devices with AI and machine learning algorithms for automated sleep stage classification and predictive health analytics
-
Increasing adoption of multi-sensor wearable actigraphs combining accelerometry with heart rate variability, skin temperature, and SpO2 monitoring
-
Growing convergence of clinical-grade actigraphy with consumer wearable devices like smartwatches and fitness bands for continuous health monitoring
-
Expansion of cloud-based actigraphy platforms enabling remote patient monitoring and longitudinal sleep pattern analysis
-
Rising focus on validation studies and regulatory approvals for actigraphy devices in clinical sleep medicine applications
The U.S. Actigraphy Device Market is estimated at USD 1.18 billion in 2025E and is expected to reach USD 7.52 billion by 2033, growing at a CAGR of 25.95% from 2026-2033.
U.S. Actigraphy Device Market is driven by high prevalence of sleep disorders, strong reimbursement policies for sleep studies, and advanced healthcare infrastructure. Increasing adoption of telehealth services, growing geriatric population with sleep issues, and rising consumer health awareness further accelerate market growth.

Actigraphy Device Market Growth Drivers:
-
Rising global sleep disorders and circadian disruptions are driving demand for objective actigraphy monitoring in clinical and home settings.
The increasing prevalence of insomnia, sleep apnea, restless leg syndrome, and shift work sleep disorder has led to high demand for accurate sleep monitoring products. Compared with subjective sleep diaries or polysomnography on a single night, actigraphy offers objective, long duration measurements of sleep-wake patterns. The increasing use of actigraphy in sleep medicine by physicians is due to the fact that identification of sleep disorders, assessment of treatment response, and management of chronic conditions heavily affecting sleep have become standard clinical practices using actigraphy. Such clinical validation and increasing awareness are key forces of market development in all treating settings.
72% of sleep clinics adopted actigraphy as standard adjunct to polysomnography increasing diagnostic throughput by 50% and enabling longitudinal sleep pattern assessment for 40% more patients.
Actigraphy Device Market Restraints:
-
Limited Reimbursement Coverage and Regional Regulatory Variability Continue to Restrict Widespread Clinical Adoption Despite Proven Utility
Actigraphy faces reimbursement challenges in many healthcare systems, with inconsistent coverage policies across insurers and countries. While some regions recognize actigraphy for specific indications, such as circadian rhythm disorders or insomnia, others classify it as investigational or non-covered. This variability creates uncertainty for healthcare providers considering investment in actigraphy technology. Additionally, regulatory classifications differ, with some countries requiring rigorous medical device approvals while others permit consumer-grade classification, creating market fragmentation and slowing standardized clinical adoption.
In 2025, only 45% of the U.S. private insurers provided consistent actigraphy reimbursement, while 60% of European countries had varying coverage policies limiting standardized clinical adoption pathways.
Actigraphy Device Market Opportunities:
-
Growth of Remote Patient Monitoring and Telehealth is Creating Strong Opportunities for Home-based Actigraphy in Chronic and Post-discharge Care
Several health systems have notable reimbursement barriers in regards to actigraphy, characterized by varying coverage policies by insurers and by country. Actigraphy has been approved for certain limited uses in some regions such as circadian rhythm disorder and insomnia but is considered investigational/non-covered in other regions. This difference creates uncertainty for health care providers considering actigraphy technology investment. Moreover, regulatory classifications range from requiring strict medical device approval in some countries to consumer grade classification elsewhere, resulting in a fragmented market with gradual standardization in clinical implementation.
In 2025, 68% of remote patient monitoring programs incorporated actigraphy devices improving medication adherence tracking by 55% and reducing hospital readmissions for sleep-related complications by 40%.
Actigraphy Device Market Segment Analysis
-
By Product Type: Wrist Actigraphs led with 38.4% share, while Wearable Devices is the fastest-growing segment with CAGR of 29.8%.
-
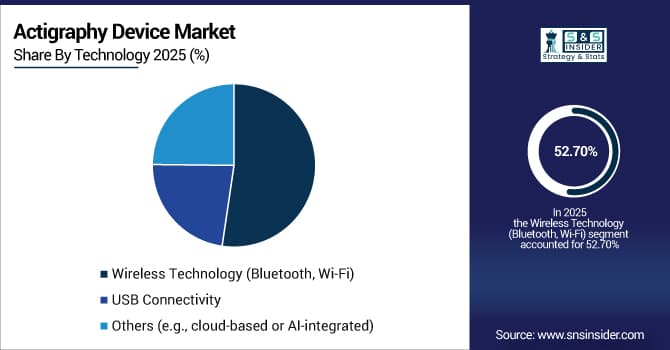
By Technology: Wireless Technology led with 52.7% share, while Cloud-Based Integration is the fastest-growing segment with CAGR of 31.2%.
-
By Application: Sleep Disorder Monitoring led with 41.3% share, while Mental Health Monitoring is the fastest-growing segment with CAGR of 28.9%.
-
By End User: Hospitals & Clinics led with 34.6% share, while Home Care Settings is the fastest-growing segment with CAGR of 32.4%.
By Product Type: Wrist Actigraphs Led the Market, while Wearable Devices is the Fastest-growing Segment in the Market
Wrist Actigraphs dominate the market space as they are the original form factor, validated in clinical research for decades. Designed for sleep-wake monitoring, they provide high accuracy, long battery life, and solid data collection capabilities and their data is classified as medical-grade. Sleep medicine has helped them maintain their leadership position in large part thanks to their acceptance within sleep medicine, generalizability across populations, and regulatory clearances for clinical use appropriately.
Wearable Devices (Smartwatches and Fitness Bands) segment is expected to be the fastest-growing segment owing to the increasing consumer adoption, technological advancements, and surging health consciousness. Modern consumer wearables also incorporate sophisticated accelerometers and photoplethysmography sensors, which are capable of reasonable sleep tracking. Their 24/7 wearability, smartphone integration, and multi-functionality drive mass adoption.
By Technology: Wireless Technology Dominate the Market, while Cloud-Based Integration is the Fastest-growing Segment in the Market
Wireless Technology (Bluetooth and Wi-Fi) is the leading segment in the market due to convenience, automatic data synchronization, and reduced user burden. Wireless connectivity enables seamless data transfer to paired devices, eliminating manual downloading and reducing data loss. This technology supports real-time monitoring applications, remote patient management, and easier integration with electronic health records.
Cloud-Based Integration is poised to be the fastest-growing technology segment as it enables scalable data storage, advanced analytics, and multi-user access. Cloud platforms allow researchers and clinicians to aggregate data from multiple devices, apply sophisticated algorithms, and generate comprehensive reports. This technology also supports longitudinal studies, population health research, and telemedicine applications.
By Application: Sleep Disorder Monitoring Segment Dominate the Market, while Mental Health Monitoring is the Fastest-growing Segment Globally
Sleep Disorder Monitoring leads as the original and most validated application of actigraphy technology. Actigraphy provides objective measurement of sleep parameters essential for diagnosing insomnia, circadian rhythm disorders, and sleep-related movement disorders. Its ability to monitor sleep patterns across multiple nights in natural environments offers advantages over single-night laboratory polysomnography for certain conditions.
Mental Health Monitoring is the fastest-growing application due to increasing recognition of sleep's bidirectional relationship with psychiatric conditions. Actigraphy objectively measures sleep disturbances in depression, bipolar disorder, ADHD, and anxiety, providing biomarkers for diagnosis, treatment selection, and outcomes monitoring. Research demonstrates that sleep parameters predict relapse in mood disorders and response to psychotherapy.
By End User: Hospitals & Clinics Segment Led the Market, while Home Care Settings is the Fastest-growing Segment in the Market
Hospitals & Clinics dominate due to established diagnostic pathways, trained personnel, and reimbursement structures. Sleep centers, neurology departments, and pulmonary clinics incorporate actigraphy into comprehensive sleep evaluation protocols. The technology aids differential diagnosis, treatment monitoring, and outcomes assessment within structured clinical workflows. Institutional purchasing power, volume requirements, and integration with existing medical equipment maintain this segment's leadership despite growth in other settings.
Home Care Settings are the fastest-growing end-user segment driven by telehealth expansion, aging-in-place initiatives, and patient preference for home-based monitoring. Home actigraphy eliminates travel burdens, enables assessment in natural environments, and supports chronic disease management. The COVID-19 pandemic accelerated this trend by necessitating remote monitoring solutions. Insurance coverage for home sleep testing and remote patient monitoring programs further supports growth, making home care the most rapidly expanding actigraphy application environment.
Actigraphy Device Market Regional Analysis:
North America Actigraphy Device Market Insights:
In 2025, North America held the largest share in the Actigraphy Device Market with a 44.2% share due to the subsequent range of advanced infrastructures in healthcare facilities, high burden of sleep disorders, established reimbursement frameworks, and presence of potential manufacturers producing such devices. The area market leadership we continued witnessing was also driven by growing telehealth adoption, rising awareness for mental health, and investments in research to support sleep medicine.

Get Customized Report as Per Your Business Requirement - Enquiry Now
Asia Pacific Actigraphy Device Market Insights:
The region Asia Pacific is anticipated to grow at the highest CAGR of approximately 29.8% during 2026–2033 owing to the enhancing healthcare access, increasing geriatric population with sleep problems, rising medical tourism for sleep diseases and growing awareness regarding health. Increased middle class, digital health programs and localization of manufacturing device manufacturing accelerates market growth in all countries in the region.
Europe Actigraphy Device Market Insights:
Europe is holding a significant share in the Actigraphy Device Market in 2025 owing to the strict regulatory frameworks for medical devices, along with established sleep medicine practices, and universal healthcare coverage in several countries. Growing emphasis on mental health services, aging population with sleep concerns, and research collaborations across EU nations further strengthened Europe’s position in the market.
Middle East & Africa and Latin America Actigraphy Device Market Insights:
The growing healthcare infrastructure, rising awareness towards sleep health, increasing medical tourism, and growing adoption of digital health technology are the contributing factors to the steady growth of the Actigraphy Device Market in 2025 across the Middle East & Africa and Latin America together. Market growth across these regions was further augmented by the government health initiatives, expanding private health care sectors and epidemiological transition toward chronic diseases.
Actigraphy Device Market Competitive Landscape:
Philips Healthcare
Philips Healthcare is a global leader in health technology headquartered in the Netherlands, specializing in sleep and respiratory care solutions. Its actigraphy portfolio includes both clinical-grade devices for sleep laboratories and consumer-oriented wearables integrated with its digital health ecosystem. Philips emphasizes connected care, combining actigraphy data with other health parameters for comprehensive patient management. The company's strong presence in sleep medicine, extensive clinical validation, and integration with its broader healthcare solutions maintain its competitive position.
-
January 2024, Philips launched next-generation Actiwatch devices with 14-day battery life and enhanced motion detection algorithms validated against polysomnography across diverse patient populations.
Fitbit (Google)
Fitbit, now part of Google, is a leading consumer wearable company headquartered in the United States, specializing in activity trackers and smartwatches with advanced sleep tracking capabilities. Its devices utilize actigraphy principles combined with heart rate variability and SpO2 monitoring for comprehensive sleep analysis. Fitbit's massive user base, continuous algorithm improvements, and integration with Google's health platform position it uniquely at the intersection of consumer wellness and clinical applications, driving adoption through both direct-to-consumer and healthcare partnership channels.
-
March 2025, Fitbit launched Sleep Profile Pro with FDA-cleared sleep staging algorithms, bringing clinical-grade actigraphy analysis to consumer devices with 92% accuracy compared to PSG.
ActiGraph LLC
ActiGraph LLC, headquartered in the United States, is a specialized medical device company focused exclusively on wearable activity and sleep monitoring technologies. The company's research-grade actigraphy devices are considered gold-standard in scientific studies, with thousands of peer-reviewed publications validating their accuracy. ActiGraph serves primarily research institutions, pharmaceutical trials, and academic medical centers requiring high precision and regulatory compliance. Its focus on scientific rigor, extensive validation libraries, and customizable analytics platforms maintain its leadership in the research segment.
-
October 2023, ActiGraph introduced CenterPoint Insight Platform combining actigraphy data with ecological momentary assessment for comprehensive behavioral phenotyping in clinical trials and observational studies.
Actigraphy Device Market Key Players
Some of the Actigraphy Device Market Companies
-
Fitbit (Google)
-
ActiGraph LLC
-
ResMed Inc.
-
Withings (Nokia)
-
Oura Health
-
Axivity Ltd.
-
CamNtech Ltd.
-
Condor Instruments
-
SleepImage (MyCardio)
-
SOMNOmedics GmbH
-
Computed International
-
Ambulatory Monitoring Inc.
-
MotionWatch (CamNtech)
-
McRoberts BV
-
Actical (Phillips Respironics)
-
Bittium Corporation
-
Xiaomi Corporation
| Report Attributes | Details |
|---|---|
| Market Size in 2025 | USD 3.25 Billion |
| Market Size by 2033 | USD 21.05 Billion |
| CAGR | CAGR of 26.27% From 2026 to 2033 |
| Base Year | 2025 |
| Forecast Period | 2026-2033 |
| Historical Data | 2022-2024 |
| Report Scope & Coverage | Market Size, Segments Analysis, Competitive Landscape, Regional Analysis, DROC & SWOT Analysis, Forecast Outlook |
| Key Segments | • By Product Type (Wrist Actigraphs, Wearable Devices [Smartwatches, Fitness Bands], Non-wearable Actigraphy Devices, Software & Accessories) • By Technology (Wireless Technology [Bluetooth, Wi-Fi], USB Connectivity, Others [e.g., cloud-based or AI-integrated]) • By Application (Sleep Disorder Monitoring, Chronic Disease Monitoring, Mental Health Monitoring, Movement Disorders, Others [e.g., fatigue, circadian rhythm studies]) • By End User (Hospitals & Clinics, Sleep Laboratories, Home Care Settings, Academic & Research Institutions, Others [e.g., sports science, corporate wellness]) • By Distribution Channel (Direct Sales, Retail Pharmacies, Online Pharmacies) |
| Regional Analysis/Coverage | North America (US, Canada, Mexico), Europe (Germany, France, UK, Italy, Spain, Poland, Turkey, Rest of Europe), Asia Pacific (China, India, Japan, South Korea, Singapore, Australia, Rest of Asia Pacific), Middle East & Africa (UAE, Saudi Arabia, Qatar, South Africa, Rest of Middle East & Africa), Latin America (Brazil, Argentina, Rest of Latin America) |
| Company Profiles | Philips Healthcare, Fitbit (Google), ActiGraph LLC, Garmin Ltd., Apple Inc., ResMed Inc., Withings (Nokia), Oura Health, Axivity Ltd., CamNtech Ltd., Condor Instruments, SleepImage (MyCardio), SOMNOmedics GmbH, Computed International, Ambulatory Monitoring Inc., MotionWatch (CamNtech), McRoberts BV, Actical (Phillips Respironics), Bittium Corporation, Xiaomi Corporation |
Frequently Asked Questions
North America dominated the Actigraphy Device Market in 2025.
The actigraphy device market companies are Philips Healthcare, Fitbit (Google), ActiGraph LLC, Garmin Ltd., Apple Inc., ResMed Inc., Withings (Nokia), Oura Health, Axivity Ltd., CamNtech Ltd., Condor Instruments, SleepImage (MyCardio), SOMNOmedics GmbH, Computed International, Ambulatory Monitoring Inc., MotionWatch (CamNtech), McRoberts BV, Actical (Phillips Respironics), Bittium Corporation, Xiaomi Corporation and other players.
Rising global sleep disorders and circadian disruptions are driving demand for objective actigraphy monitoring in clinical and home settings.
The Actigraphy Device Market size is estimated at USD 3.25 billion in 2025 and is expected to reach USD 21.05 billion by 2033.
The Actigraphy Device Market is expected to grow at a CAGR of 26.27% from 2026 to 2033.
Get in Touch
