Video On Demand Market Report Scope & Overview:
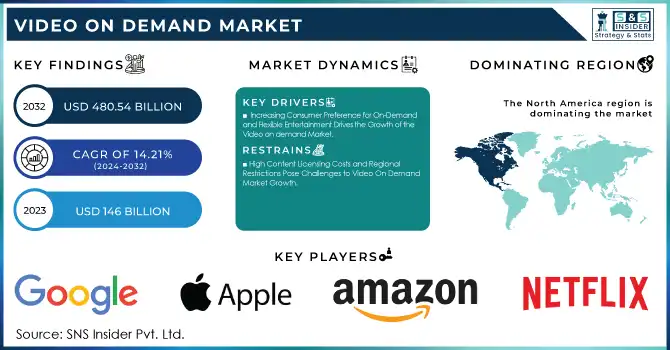
The Video On Demand Market was valued at USD 146 billion in 2023 and is expected to reach USD 480.54 billion by 2032, growing at a CAGR of 14.21% from 2024-2032.
Get more information on Video On Demand Market - Request Free Sample Report
The Video On Demand market has seen remarkable growth as consumers shift away from traditional TV viewing in favor of streaming platforms, which offer greater convenience and flexibility. This transformation has been fueled by the widespread availability of high-speed internet and the proliferation of affordable smartphones and smart TVs, which have brought VOD services to a global audience. As streaming services gain popularity, consumers now demand instant access to a variety of content, including movies, TV shows, and documentaries, prompting service providers to continually expand their libraries and improve user experiences. In 2024, the global OTT user base is projected to increase to 3.71 billion from 3.50 billion, with users spending 17 hours weekly streaming online video content. In line with this growth, Fox Corporation announced plans to launch Tubi, a free, ad-supported streaming service, in the UK, further catering to the increasing demand for accessible, cost-effective entertainment.
In response to this demand, there has been a noticeable shift towards personalized content and subscription-based models, with platforms like Netflix, Amazon Prime, and Disney+ leading the way with exclusive original programming. Netflix, for example, had around 282.7 million paid subscribers worldwide as of the third quarter of 2024, reflecting its success in attracting a global audience. These platforms have redefined consumer expectations, encouraging many to abandon traditional cable in favor of more flexible, cost-effective streaming options. Furthermore, VOD services are increasingly integrating advanced recommendation algorithms and social media features, creating a more engaging and tailored viewing experience that keeps users connected and loyal to the platform. This shift highlights the growing preference for personalized, on-demand content in the streaming era.
The VOD market is ripe with opportunity, especially in emerging markets where expanding internet infrastructure presents the potential for rapid growth. This growth is further supported by the rise of local content and regional services, which cater to the specific preferences and cultures of diverse demographics. As consumer tastes evolve, VOD providers are finding new ways to monetize their offerings through ad-supported models, hybrid subscriptions, and interactive content, with the potential to revolutionize the market through the inclusion of niche content, esports, live events, and virtual reality experiences. This dynamic landscape ensures a promising and ever-evolving future for the VOD market.
Market Dynamics
Drivers
-
Increasing Consumer Preference for On-Demand and Flexible Entertainment Drives the Growth of the Video on demand Market
With traditional broadcast television offering rigid programming schedules, viewers are increasingly turning to streaming platforms for the convenience of watching content at their own pace and convenience. This demand is largely driven by the widespread use of smartphones, smart TVs, and internet-connected devices that allow consumers to access content from anywhere, at any time. The ability to pause, skip, and binge-watch entire seasons has reshaped viewing habits, making streaming services more appealing than traditional TV. This flexibility in content consumption, coupled with the rise of on-demand video libraries and personalized recommendations, has made VOD platforms like Netflix, Hulu, and Amazon Prime Video highly attractive to a diverse range of consumers, from casual viewers to dedicated binge-watchers. As more consumers prioritize convenience and content variety, VOD providers continue to see strong subscriber growth, which is a major factor in the market's ongoing expansion.
-
Rise in Subscription-Based and Advertising-Based Models Fosters Revenue Growth in the VOD Market
Subscription-based models, such as those used by Netflix, Disney+, and Amazon Prime Video, offer viewers unlimited access to content for a fixed monthly fee, which has proven to be a reliable revenue stream. These models provide predictable income for platforms, allowing for reinvestment into content creation and user experience improvements. On the other hand, advertising-supported VOD platforms like YouTube, Peacock, and Hulu provide free content to users, which attracts a different demographic of consumers, especially in cost-sensitive markets. By offering free or lower-cost content in exchange for ads, these platforms generate substantial revenue from advertisers who benefit from precise targeting of consumer segments. The combination of these models allows VOD platforms to cater to a wider range of consumers, thus fueling both subscriber acquisition and increased advertising revenue. This dual approach strengthens the financial stability of VOD services, further accelerating the growth of the market.
Restraints
-
High Content Licensing Costs and Regional Restrictions Pose Challenges to Video On Demand Market Growth
Despite the rapid growth of the Video On Demand market, there are significant challenges related to high content licensing costs and regional restrictions that could hinder further expansion. VOD platforms often face the burden of acquiring licenses for popular films, TV shows, and other exclusive content from studios, production companies, and rights holders. The cost of these licenses can be prohibitively expensive, especially when platforms aim to provide a diverse library of content that appeals to a global audience. This is particularly problematic for smaller, emerging platforms competing with dominant players like Netflix, Amazon Prime, and Disney+, which have substantial financial resources. Additionally, regional restrictions and geo-blocking present a barrier to content accessibility, as certain content may be available only in specific countries or regions due to licensing agreements. This limits the ability of global audiences to access the full content libraries of streaming platforms, affecting user satisfaction and limiting the growth potential in certain markets. Consequently, these challenges require VOD platforms to continuously negotiate content rights and explore innovative strategies to manage costs while maintaining user engagement.
Segment Analysis
By Offering Type
In 2023, the Solutions segment dominated the Video On Demand market, capturing approximately 65% of the revenue share. This dominance is attributed to the growing demand for comprehensive VOD platforms that offer end-to-end solutions for content distribution, management, and streaming. Organizations in media, entertainment, and other industries increasingly seek solutions that provide seamless user experiences, high-quality streaming, and customizable features. The shift towards subscription-based models and on-demand content access has further fueled the demand for integrated solutions that address the evolving needs of both content providers and consumers.
The Services segment is expected to grow at the fastest compound annual growth rate of about 15.56% from 2024 to 2032. This growth is driven by the increasing demand for services such as content licensing, platform management, and technical support as VOD platforms expand. As media companies and streaming providers focus on enhancing their service offerings, the need for specialized services, including customer support, content distribution, and platform integration, continues to rise. This trend reflects the growing importance of robust services in enabling the scalability and success of VOD platforms
By Monetization Model
In 2023, the Subscription Video on Demand (SVOD) segment dominated the Video On Demand market, accounting for approximately 57% of the revenue share. This dominance is driven by the increasing consumer preference for ad-free, on-demand content with a consistent, monthly subscription model. SVOD platforms, offering exclusive content such as original programming from services like Netflix and Disney+, have cultivated loyal subscriber bases, ensuring steady revenue streams and long-term growth. As consumers seek flexibility and value, SVOD remains the primary revenue driver within the VOD market.
The Advertising-Supported Video on Demand (AVOD) segment is expected to grow at the fastest CAGR of around 16.89% from 2024 to 2032. This rapid growth can be attributed to the rising demand for cost-effective, ad-supported content options that allow viewers to access a wide range of entertainment without the commitment of a subscription. As more consumers seek free, high-quality content and advertisers increasingly turn to digital platforms for targeted marketing, AVOD offers an appealing solution for both users and advertisers, fueling its expansion in the VOD landscape.
By Platform Type
In 2023, the Smart TVs segment led the Video On Demand market with the highest revenue share of approximately 51%. This dominance can be attributed to the growing adoption of Smart TVs that offer seamless integration with popular VOD platforms, enabling users to easily stream content in high-definition on larger screens. As the demand for home entertainment continues to rise, Smart TVs have become central to delivering a superior viewing experience, providing consumers with easy access to a wide range of streaming services and on-demand content at their convenience.
The Smartphones segment is expected to grow at the fastest compound annual growth rate of around 15.84% from 2024 to 2032. The surge in mobile device usage, coupled with improvements in screen quality and internet connectivity, has made smartphones a popular choice for on-the-go video consumption. With the increasing availability of affordable smartphones and the rise of mobile-first streaming platforms, consumers are increasingly turning to their devices for quick access to entertainment, driving the segment's rapid growth in the VOD market.
By Content Type
In 2023, the Movies segment dominated the Video On Demand market, capturing around 40% of the revenue share. This dominance is largely driven by the continued popularity of films across various genres, attracting large audiences who prefer the flexibility of on-demand streaming. With the rise of global streaming platforms offering exclusive movie releases, consumers have become increasingly drawn to VOD services for immediate access to the latest blockbusters, classic films, and original content, solidifying the Movies segment's leading position.
The Educational/Fitness Programs segment is expected to grow at the fastest compound annual growth rate of approximately 18.41% from 2024 to 2032. This rapid growth is fueled by the increasing demand for online learning and wellness content, particularly as consumers seek more flexible and accessible ways to improve their skills and health. The rise of personalized fitness programs and educational content, supported by advancements in digital technology, is making these offerings more appealing to a broad audience, driving the segment's expansion in the VOD market.
Regional Analysis
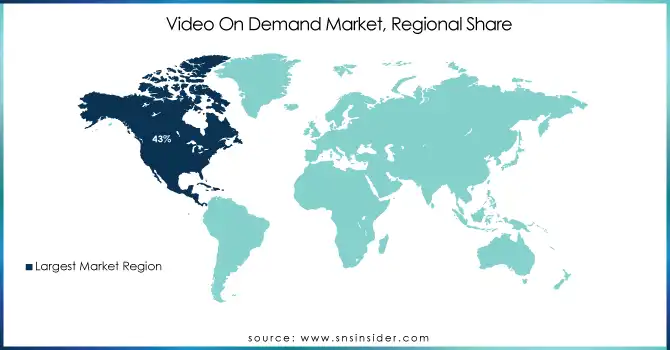
In 2023, North America dominated the Video On Demand (VOD) market with the highest revenue share of approximately 43%. This dominance is driven by a combination of high disposable incomes, advanced internet infrastructure, and a strong consumer preference for digital entertainment. The presence of leading VOD platforms such as Netflix, Amazon Prime, and Hulu, along with a mature market for original content production, has made North America the largest and most lucrative region for VOD services, reinforcing its market leadership.
The Asia Pacific region is expected to grow at the fastest compound annual growth rate of around 15.94% from 2024 to 2032. This growth can be attributed to rapid digitalization, increasing internet penetration, and a large, young, tech-savvy population eager to embrace streaming services. As local content production flourishes and regional players expand their offerings, the growing demand for affordable and accessible entertainment will drive the region's rapid expansion in the VOD market.
Need any customization research on Video On Demand Market - Enquiry Now
Key Players
-
Netflix (Streaming service, Netflix Originals)
-
Amazon (Amazon Prime Video, Amazon Fire TV)
-
Google (YouTube, Google TV)
-
The Walt Disney Company (Disney+, ESPN+)
-
Apple (Apple TV+, Apple TV)
-
Warner Bros Discovery (HBO Max, Discovery+)
-
Comcast Corporation (Peacock, Xfinity Stream)
-
Paramount Global (Paramount+, Pluto TV)
-
Sony (Sony Crackle, PlayStation Video)
-
Fox Corporation (Tubi, Fox Now)
-
Facebook, Inc. (Facebook Watch, Instagram TV)
-
Telefonaktiebolaget LM Ericsson (Ericsson Media Solutions, Ericsson Video Processing)
-
Verizon Communications Inc. (Fios TV, Verizon 5G Home Internet)
-
Roku (Roku Channel, Roku Express)
-
Reliance Jio (JioCinema, JioTV)
-
DISH (Sling TV, DISH Anywhere)
-
Sky (Sky Go, Now TV)
-
TargetVideo (TargetVideo Streaming, TargetVideo On Demand)
-
DirecTV (DirecTV Stream, AT&T TV)
-
Fujitsu (Fujitsu Media Solutions, Fujitsu Video Cloud)
-
Midwest Tape LLC (Hoopla Digital, Library Streaming Solutions)
-
Vubiquity Inc. (Vubiquity Content Services, Vubiquity Video Distribution)
-
Fandango Media LLC (Vudu, FandangoNOW)
-
Edgio (Edgio Streaming, Edgio Video Delivery)
-
Dacast Inc. (Dacast Streaming Platform, Dacast Video Hosting)
Recent Developments:
-
In September 2024, Google announced plans to phase out Video Action Campaigns in favor of the AI-powered Demand Gen campaigns, aiming to enhance reach, creative flexibility, and audience targeting.
-
In January 2025, Walt Disney and Fubo are nearing a deal to merge their online live TV businesses, with Disney taking a 70% stake in the new venture. The merger would create the second-largest digital pay-TV provider, combining Hulu + Live TV and Fubo’s services to reach 6 million subscribers.
-
In February 2024, Prime Video and Sony Pictures Television launched the 'Sony Pictures–Stream' channel in India, offering a wide selection of international films and TV shows curated for Indian audiences through Prime Video Channels.
| Report Attributes | Details |
|---|---|
| Market Size in 2023 | USD 146 Billion |
| Market Size by 2032 | USD 480.54 Billion |
| CAGR | CAGR of 14.21% From 2024 to 2032 |
| Base Year | 2023 |
| Forecast Period | 2024-2032 |
| Historical Data | 2020-2022 |
| Report Scope & Coverage | Market Size, Segments Analysis, Competitive Landscape, Regional Analysis, DROC & SWOT Analysis, Forecast Outlook |
| Key Segments | • By Offering Type (Solutions, Services) • By Monetization Model (Subscription Video on Demand, Transactional Video on Demand, Advertising-Supported Video on Demand, Free Ad-Supported Streaming TV, Electronic-Sell-Through) • By Deployment Model (Cloud, On-Premises) • By Platform Type (Smartphones, Tablets/Laptops, Smart TVs, Other Platform Types) • By Content Type (Movies, Music, TV Shows/Web Series, Educational/Fitness Programs, Other Content Types) |
| Regional Analysis/Coverage | North America (US, Canada, Mexico), Europe (Eastern Europe [Poland, Romania, Hungary, Turkey, Rest of Eastern Europe] Western Europe] Germany, France, UK, Italy, Spain, Netherlands, Switzerland, Austria, Rest of Western Europe]), Asia Pacific (China, India, Japan, South Korea, Vietnam, Singapore, Australia, Rest of Asia Pacific), Middle East & Africa (Middle East [UAE, Egypt, Saudi Arabia, Qatar, Rest of Middle East], Africa [Nigeria, South Africa, Rest of Africa], Latin America (Brazil, Argentina, Colombia, Rest of Latin America) |
| Company Profiles | Netflix, Amazon, Google, The Walt Disney Company, Apple, Warner Bros Discovery, Comcast Corporation, Paramount Global, Sony, Fox Corporation, Facebook, Inc., Telefonaktiebolaget LM Ericsson, Verizon Communications Inc., Roku, Reliance Jio, DISH, Sky, TargetVideo, DirecTV, Fujitsu, Midwest Tape LLC, Vubiquity Inc., Fandango Media LLC, Edgio, Dacast Inc. |
| Key Drivers | • Increasing Consumer Preference for On-Demand and Flexible Entertainment Drives the Growth of the Video on demand Market • Rise in Subscription-Based and Advertising-Based Models Fosters Revenue Growth in the VOD Market |
| RESTRAINTS | • High Content Licensing Costs and Regional Restrictions Pose Challenges to Video On Demand Market Growth |
Frequently Asked Questions
Ans. Netflix had around 282.7 million paid subscribers worldwide as of Q3 2024.
Ans. North America dominated the Video On Demand market with a 43% revenue share in 2023.
Ans. The Subscription Video on Demand (SVOD) segment dominated the market with 57% of the revenue share in 2023.
Ans. The AVOD segment is expected to grow at a CAGR of around 16.89% from 2024 to 2032.
Ans. Video On Demand Market was valued at USD 146 billion in 2023 and is expected to reach USD 480.54 billion by 2032, growing at a CAGR of 14.21% from 2024-2032.
Get in Touch
