Retail Cloud Market Key Insights:
To get more information on Retail Cloud Market - Request Sample Report
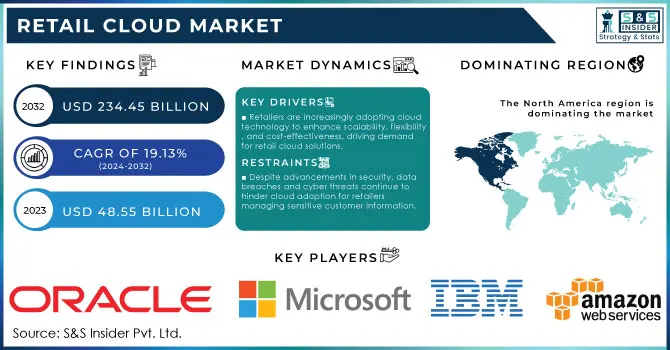
The Retail Cloud Market size was valued at USD 48.55 billion in 2023 and is expected to grow to USD 234.45 billion by 2032 with a growing CAGR of 19.13% over the forecast period of 2024-2032.
The Retail Cloud Market is rapidly evolving, driven by the increasing need for businesses to enhance customer experiences and streamline operations. Retailers are adopting cloud-based solutions to improve their agility and efficiency in an ever-competitive landscape. The shift to cloud technology allows retailers to leverage advanced data analytics, enabling them to better understand customer preferences and optimize inventory management. This transformation is further fueled by the rise of omnichannel retailing, where seamless integration between online and offline channels is crucial for meeting customer expectations. One of the significant trends in the Retail Cloud Market is the growing importance of data security and privacy. As retailers migrate to the cloud, they are increasingly focused on protecting sensitive customer information from cyber threats. 60% of retailers are expected to increase their investment in data security solutions over the next year. This has led to investments in robust security measures and compliance with regulations like GDPR and CCPA. Additionally, many retailers are utilizing cloud solutions to enhance their supply chain visibility, enabling real-time tracking and responsiveness to changing market conditions about 70% of retailers are expected to invest in supply chain management solutions in the coming years.
Moreover, the COVID-19 pandemic accelerated the adoption of cloud technologies, as retailers sought to adapt to the challenges of remote operations and shifting consumer behavior. Approximately 80% of retailers reported that cloud solutions helped them manage disruptions during the pandemic. This shift has resulted in increased investment in e-commerce platforms, digital payment solutions, and customer engagement tools, all powered by cloud infrastructure, with 75% of retailers planning to enhance their digital capabilities. Artificial intelligence and machine learning are also becoming integral components of retail cloud solutions, providing retailers with powerful tools for personalized marketing, demand forecasting, and predictive analytics. Currently, 50% of retailers are already using AI to improve customer experiences and operational efficiency. As sustainability becomes a priority, retailers are increasingly looking to cloud solutions that support eco-friendly practices, such as energy-efficient operations and waste reduction, with 65% considering sustainability a key factor in their cloud adoption strategy. The Retail Cloud Market is poised for continued growth, driven by technological advancements, evolving consumer demands, and the necessity for retailers to remain competitive in a digital-first environment.
| Type of Retail Cloud Solution | Description | Commercial Products |
|---|---|---|
| Point of Sale (POS) Solutions | Cloud-based systems that handle sales transactions and inventory management. | Square POS, Shopify POS |
| Inventory Management Systems | Solutions that provide real-time inventory tracking and management in the cloud. | TradeGecko, Cin7 |
| Customer Relationship Management (CRM) | Platforms that help retailers manage customer interactions and data. | Salesforce, HubSpot CRM |
| E-commerce Platforms | Cloud services that enable retailers to set up online stores and manage sales. | BigCommerce, WooCommerce |
| Supply Chain Management Solutions | Tools that optimize the supply chain process through cloud-based analytics. | Oracle SCM Cloud, SAP Integrated Business Planning |
| Marketing Automation Tools | Cloud solutions that automate marketing tasks and campaigns for retailers. | Mailchimp, Klaviyo |
| Business Intelligence (BI) Tools | Cloud-based analytics platforms that provide insights from retail data. | Tableau, Looker |
| Workforce Management Solutions | Systems designed to manage employee schedules and productivity in retail. | Deputy, Kronos Workforce Ready |
| Omnichannel Retailing Solutions | Platforms that provide a seamless shopping experience across multiple channels. | Shopify Plus, Salesforce Commerce Cloud |
| Payment Processing Solutions | Cloud-based services that facilitate secure online and in-store payment transactions. | PayPal, Stripe |
MARKET DYNAMICS
DRIVERS
- Retailers are increasingly adopting cloud technology to enhance scalability, flexibility, and cost-effectiveness, driving demand for retail cloud solutions.
The increased adoption of cloud technology in the retail sector is driven by the need for scalability, flexibility, and cost-effectiveness. As retailers face growing competition and evolving consumer expectations, many are shifting their operations to cloud-based platforms to enhance their operational efficiency and agility. According to research, 70% of retailers reported that they have already migrated at least some of their operations to the cloud, with a significant portion planning further transitions in the coming years. This shift allows retailers to scale their IT resources according to demand, enabling them to handle seasonal spikes and fluctuations in customer traffic without the need for heavy investments in physical infrastructure.
Furthermore, cloud technology offers retailers the flexibility to adopt new applications and services swiftly, allowing for faster implementation of innovative solutions that can improve customer experience. This capability is particularly crucial in today’s fast-paced retail environment, where businesses must respond quickly to trends and customer preferences. The cost-effectiveness of cloud solutions is another critical driver, as they typically require lower upfront capital expenditures compared to traditional IT systems. Retailers can operate on a pay-as-you-go model, which helps in managing budgets more effectively while minimizing risks associated with over-provisioning or underutilizing resources. In essence, the adoption of cloud technology is transforming the retail landscape, enabling businesses to become more competitive and customer-centric while optimizing their operational efficiencies and financial performance.
- Omni-channel retailing requires integrated cloud solutions to unify online and offline sales, inventory management, and customer data, ensuring a seamless shopping experience.
Omni-channel retailing has emerged as a pivotal strategy in today’s retail landscape, driven by shifting consumer expectations and advancements in technology. This approach integrates multiple sales channels such as brick-and-mortar stores, e-commerce platforms, and mobile applications into a cohesive shopping experience. According to research, 73% of consumers use multiple channels during their shopping journey, highlighting the necessity for retailers to provide seamless transitions between online and offline experiences. Integrated cloud solutions play a critical role in this transformation, enabling retailers to synchronize inventory management and customer data across all platforms. A cloud-based system allows retailers to have real-time visibility into stock levels, ensuring that customers can access the products they desire, whether they are shopping online or in-store. Additionally, leveraging data analytics through cloud solutions enables retailers to gain insights into customer behavior and preferences, allowing for personalized marketing and improved service. As retailers continue to embrace omnichannel strategies, the reliance on integrated cloud solutions will only grow, providing the necessary infrastructure to adapt to the evolving retail environment and meet consumer demands effectively. By investing in these technologies, retailers can create a frictionless shopping experience that fosters engagement and ultimately drives sales growth.
RESTRAIN
- Data security concerns, including the risk of data breaches and cyber threats, continue to hinder cloud adoption for retailers managing sensitive customer information, despite advancements in security features.
Data security concerns are a critical barrier to the adoption of cloud solutions in the retail sector, particularly for businesses that manage sensitive customer information. Retailers face increasing threats from cybercriminals, with data breaches posing severe risks to their operations and reputations. According to research, approximately 60% of small to medium-sized businesses that experience a cyber-attack go out of business within six months, highlighting the dire consequences of inadequate data protection. Additionally, the 2023 Cost of a Data Breach Report revealed that the average cost of a data breach for organizations across all sectors is around USD 4.45 million, a figure that can be particularly damaging for retailers operating on thin profit margins.
Retailers must also navigate stringent regulations such as the General Data Protection Regulation (GDPR), which impose hefty fines for non-compliance. These regulations compel retailers to prioritize robust data security measures, which can complicate cloud adoption efforts. Moreover, customers are increasingly aware of privacy issues according to research 79% of consumers express concerns about how their personal data is used and protected. This scrutiny places additional pressure on retailers to ensure that their cloud providers adhere to high security standards. As a result, despite the allure of cloud solutions, the pervasive fear of data breaches and the complexities surrounding data security remain significant deterrents, compelling many retailers to proceed with caution as they transition to cloud-based infrastructures.
KEY SEGMENTATION ANALYSIS
By Component
In 2023, the solution segment dominated the market, contributing 65.08% to market revenue. This significant share reflects the growing need for various solutions, including customer management, supply chain management, workforce management, and data security. Customer management solutions play a vital role in enhancing engagement and retention by offering personalized experiences and effective data tracking. In terms of supply chain management, these solutions streamline processes related to inventory, order fulfillment, and supplier collaboration, leading to improved operational efficiency. Workforce management solutions facilitate the effective tracking of attendance, shifts, and employee benefits, ensuring optimal workforce utilization. Additionally, data security solutions are increasingly essential as they protect organizations from unauthorized access and cyber threats through advanced encryption and continuous monitoring.
By Model Type
In 2023, the Software as a Service (SaaS) segment dominated the market share over 63.06% in 2023. This growth can be attributed to the cost-effectiveness of SaaS solutions, which offer subscription-based pricing models that help businesses reduce expenses related to hardware, software licenses, and IT infrastructure. Retailers benefit from the scalability of SaaS, allowing them to adjust their services effortlessly—adding or removing features and users without incurring significant costs. Additionally, the global accessibility of SaaS platforms enables retailers to access crucial data and applications from anywhere, making them especially beneficial for companies operating internationally.
KEY REGIONAL ANALYSIS
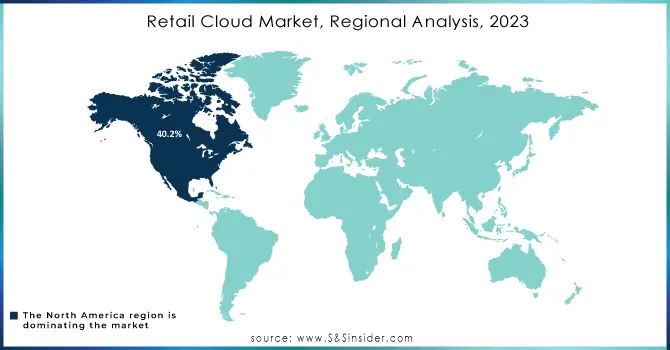
In 2023, North America held a significant market share of 40.2%, establishing itself as a leader in the industry. The U.S. and Canada are emerging as pivotal growth centers within the region, driven by several factors. One of the primary drivers is the extensive adoption of cloud computing, which facilitates enhanced operational efficiency and customer engagement. Moreover, the increasing embrace of omnichannel retail strategies has transformed how retailers interact with customers, integrating online and offline experiences. The demand for data analytics is also surging as retailers seek actionable insights to optimize their operations and tailor offerings to consumer preferences. With numerous prominent retailers based in North America, the region benefits from a well-established retail landscape characterized by a strong focus on innovation and technology. According to research, 73% of retailers in North America are prioritizing cloud-based solutions to enhance their competitive edge, reflecting a trend toward digital transformation in the retail sector.
The Asia Pacific region is poised for substantial growth in the retail cloud solutions market, largely due to the rising demand from small and medium-sized enterprises (SMEs). These businesses are increasingly recognizing the benefits of cloud technologies, which enhance operational efficiency and competitiveness. In countries such as China, India, and Japan, strong economic performance, alongside a surge in internet penetration and smartphone usage, is propelling this trend. In 2023, China boasts over 1.05 billion internet users, while India has seen its smartphone user base reach 600 million. This digital landscape fosters a thriving e-commerce sector that relies heavily on efficient retail cloud solutions. Additionally, both government initiatives and private sector investments in cloud infrastructure are further stimulating the demand for these solutions, enabling businesses to optimize their operations and meet the evolving needs of consumers in a rapidly digitizing marketplace.
Do You Need any Customization Research on Retail Cloud Market - Inquire Now
KEY PLAYERS
Some of the major key players of Retail Cloud Market
-
Amazon Web Services (AWS) (Amazon Elastic Compute Cloud, Amazon S3)
-
Microsoft Corporation (Microsoft Azure, Dynamics 365)
-
Oracle Corporation (Oracle Retail Cloud, Oracle Commerce Cloud)
-
IBM Corporation (IBM Cloud, Watson for Retail)
-
SAP SE (SAP Commerce Cloud, SAP Customer Experience)
-
Salesforce (Salesforce Commerce Cloud, Salesforce Service Cloud)
-
Google Inc (Google Cloud Platform, BigQuery)
-
Cisco Systems (Cisco Meraki, Cisco Cloud Services)
-
Accenture (Accenture Cloud Services, Accenture myConcerto)
-
Fujitsu Global (Fujitsu Retail Cloud, Fujitsu Digital Workplace)
-
Infor Inc (Infor CloudSuite Retail, Infor Supply Chain Management)
-
Syntel (Syntel Retail Cloud Solutions, Syntel Data Analytics)
-
Shopify (Shopify Plus, Shopify POS)
-
Adobe (Adobe Experience Cloud, Adobe Commerce)
-
Walmart Labs (Walmart Cloud Services, Data Café)
-
Tencent (Tencent Cloud, WeChat Pay)
-
Alibaba Cloud (Alibaba Cloud Retail Solutions, Tmall)
-
SAP Hybris (SAP Hybris Commerce, SAP Hybris Marketing)
-
Magento (Adobe Magento Commerce, Magento Open Source)
-
Zalando (Zalando Cloud, Zalando Fulfillment Solutions)
Suppliers for Provides a comprehensive suite of cloud services with scalability, robust data analytics, and machine learning capabilities tailored for retail of Retail Cloud Market
-
Amazon Web Services (AWS)
-
Microsoft Azure
-
Google Cloud Platform
-
IBM Cloud
-
Oracle Cloud
-
SAP Cloud
-
Salesforce
-
Shopify
-
BigCommerce
-
Adobe Experience Cloud
RECENT DEVELOPMENTS
-
In October 2023: Flipkart Internet Private Limited launched the 'Flipkart Commerce Cloud' platform, which provides retail technology solutions tailored for global retailers, markets, and e-commerce platforms. The primary aim of this initiative is to assist global retailers in overcoming various business challenges by implementing smart, AI-driven solutions to facilitate business expansion.
-
In January 2023: At the NADA Expo in Dallas, Texas, Eccentric unveiled its latest innovation, a Virtual Retail Cloud for Distributors, which serves as an experiential platform focused on Digital Auto Sales. This marks the first introduction of this product to North America, following its development in Indonesia, Japan, South Africa, and Oman in recent years.
-
In March 2023: Salesforce introduced Einstein GPT for Commerce Cloud, aimed at enhancing personalized customer experiences through AI.
-
In February 2023: Google Cloud partnered with Accenture to assist retailers in modernizing their operations. This collaboration included updates to Accenture’s ai.RETAIL platform, which incorporated Google Cloud’s advanced data analytics, AI, and product discovery capabilities.
| Report Attributes | Details |
|---|---|
| Market Size in 2023 | USD 48.55 billion |
| Market Size by 2032 | USD 234.45 billion |
| CAGR | CAGR of 19.13% From 2024 to 2032 |
| Base Year | 2023 |
| Forecast Period | 2024-2032 |
| Historical Data | 2020-2022 |
| Report Scope & Coverage | Market Size, Segments Analysis, Competitive Landscape, Regional Analysis, DROC & SWOT Analysis, Forecast Outlook |
| Key Segments | •By Component (Solution (Customer Management, Supply Chain Management, Workforce Management, Data Security, Others, Services (Professional Services, Managed Services) • By Model Type (SaaS, IaaS, PaaS) • By Deployment (Public Cloud, Private Cloud, Hybrid Cloud) • By Organization (Large Enterprises, Small & Medium Size Enterprises) |
| Regional Analysis/Coverage | North America (US, Canada, Mexico), Europe (Eastern Europe [Poland, Romania, Hungary, Turkey, Rest of Eastern Europe] Western Europe] Germany, France, UK, Italy, Spain, Netherlands, Switzerland, Austria, Rest of Western Europe]), Asia Pacific (China, India, Japan, South Korea, Vietnam, Singapore, Australia, Rest of Asia Pacific), Middle East & Africa (Middle East [UAE, Egypt, Saudi Arabia, Qatar, Rest of Middle East], Africa [Nigeria, South Africa, Rest of Africa], Latin America (Brazil, Argentina, Colombia, Rest of Latin America) |
| Company Profiles | Amazon Web Services (AWS), Microsoft Corporation, Oracle Corporation, IBM Corporation, SAP SE, Salesforce, Google Inc, Cisco Systems, Accenture, Fujitsu Global, Infor Inc, Syntel, Shopify, Adobe, Walmart Labs, Tencent, Alibaba Cloud, SAP Hybris, Magento, Zalando. |
| Key Drivers | • Retailers are increasingly adopting cloud technology to enhance scalability, flexibility, and cost-effectiveness, driving demand for retail cloud solutions. • Omni-channel retailing requires integrated cloud solutions to unify online and offline sales, inventory management, and customer data, ensuring a seamless shopping experience.. |
| RESTRAINTS | • Data security concerns, including the risk of data breaches and cyber threats, continue to hinder cloud adoption for retailers managing sensitive customer information, despite advancements in security features. |
Get in Touch
