Aerospace 3D Printing Market Report Scope & Overview:
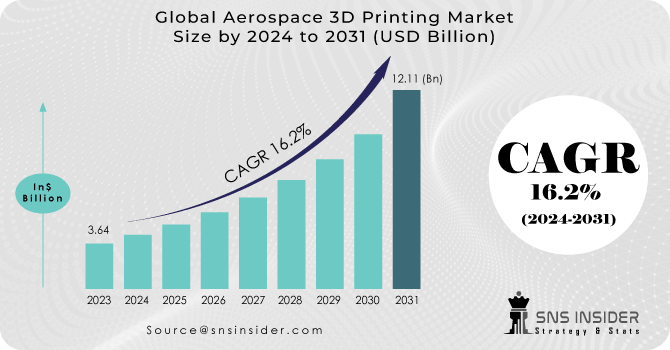
The Aerospace 3D Printing Market Size was valued at USD 3.64 billion in 2023 and is projected to grow to USD 12.11 billion by 2031, with a growing CAGR of 16.2% over the forecast period 2024-2031.
It is used to produce metal brackets that perform structural work inside the aircraft. Prototypes are increasingly being printed in 3D, allowing designers to refine the form and proportions of completed parts. 3D printing services produce internal aircraft components such as cockpit dashboards and door handles.
To get more information on Aerospace 3D Printing Market - Request Free Sample Report
Additional production or 3D printing is the process of creating 3D objects or a layer of products by design using a 3D digital model. 3D printing is a distortion of the normal production process such as mechanical processing, in which a person starts with an object block and then removes unwanted equipment. 3D printing can also start with a blank platform where the material is added in a controlled manner where necessary - in each layer - until the final part is produced. The 3D model can be created using 3D CAD software from scratch or by retrospective engineering using laser scanning.
The demand for 3D aerospace printing is expected to be driven by the production of low-volume aircraft parts in the aerospace industry, the growing demand for lightweight parts, the need to reduce production time, and the need for economical and sustainable products. To stimulate the need for faster prototyping is expected the growth of aerospace 3D printing market during forecasting.
The Impact of Covid-19 on the Global 3D Printing Market
The COVID-19 epidemic has plagued the aviation industry since 2020, as airlines have chosen to accelerate the retirement of older aircraft as a cost-cutting measure and now plan to replace it with a new lighter aircraft compared to additional fuel. - works well. A few OE-M sites are investing in major research projects, aimed at improving the use of 3D printed parts and components of a new generation aircraft. Additionally, the use of 3D printed parts is also increasing in the aftermarket area, as the use of such components may reduce the pressure on traditional supply chains.
The benefits offered by 3D printing have increased its acceptance in the aerospace field. 3D printing produces components at low cost with fast lead times and a design that adapts to digital conditions and ways to improve. The use of 3D printing also leads to significant cost savings for users and manufacturers.
Although the adoption of 3D printing is growing in the A&D sector, there are significant challenges currently hindering your progress in mass production. However, advances in 3D printing technology and material science may face many of these limitations, thus furthering the acceptance of 3D printing in the aviation industry in the coming years.
Drivers: Increased demand for lightweight materials in aircraft construction
Increasing demand for convenience in the aviation industry and partial production is a major factor in the growth of market capitalization. Lightweight materials such as composites and plastics are relatively light compared to materials such as metal, copper, alloys, metal, and so on. Reducing the weight of aircraft parts can lead to significant cost savings in terms of fuel consumption. Also, plastic materials perform much better in chemical conditions compared to metal, thus prolonging the aircraft structure and preventing expensive repairs due to corrosion of metal parts. Plastic also ensures a reduction in Time of Care, Repair, and Maintenance) as replacement is easy and quick to install. In addition, highly efficient thermoplastics provide excellent flame retardant properties, which is essential for aerospace use.
Restrictions: rising costs associated with lightweight materials
Lightweight materials use great weight loss benefits but at a higher cost. For example, high-strength steel provides a weight loss of 20.0% over steel with a maximum value of 15.0% per unit, while aluminum costs 30.0% more than steel, but brings a weight reduction of 40.0%. Also, carbon fiber, which provides weight loss that rises more than steel, is more expensive, preventing its entry into the market.
Opportunities: Development of advanced 3D printing technology that requires less production time
The traditional processes used in the production of aerospace components are time-consuming compared to 3D printing. The development of new 3D printing technologies allows faster production of parts and components, which can take months or years to build, thereby reducing their production time. CLIP (Continuous Liquid Interface Production) is one of the latest 3D printing technologies used to produce parts and components for continuous production. It removes the layer through layer processes, unlike other 3D printing technologies, such as SLA and SLS. Another technology is DMLS, which uses powdered metals instead of powdered thermoplastic in making metal parts. This technology can improve products 100 times faster than other 3D printing technologies.
Challenges: increasing the production of aerospace components is slower compared to traditional production
In the traditional making of aerospace components, an increase in production capacity results in reduced production costs, while the speed at which production is maintained remains the same. However, in 3D printing technology, production costs increase, and the production scale increases, thus making the technology suitable for lower production capacity. The costs involved in making and purchasing 3D printing equipment and the cost of immature materials used in 3D printing are higher than those found in conventional production. This feature is challenging
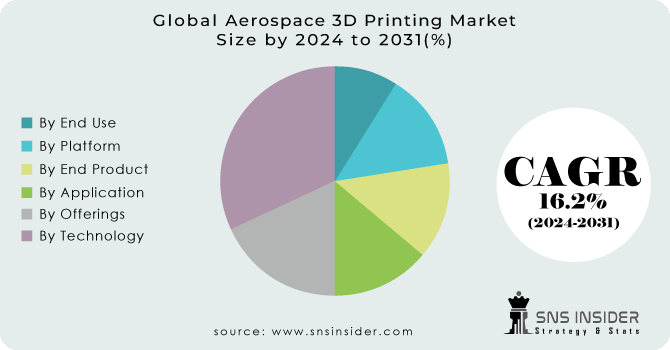
KEY MARKET SEGMENTATION
By Offerings
-
Printers
-
Materials
-
Services
-
Software
By Technology
-
Polymerization
-
Powder Bed Fusion
-
Material Extrusion Or Fusion Deposition Modeling (FDM)
-
Others
By Platform
-
Aircraft
-
Spacecraft
By End Product
-
Engine Components
-
Structural Components
-
Others
By End Use
-
OEM
-
MRO
By Application
-
Prototyping
-
Tooling
-
Functional Parts
Need any customization research on Aerospace 3D Printing Market - Enquiry Now
Regional Analysis:
North America
-
USA
-
Canada
-
Mexico
Europe
-
Germany
-
UK
-
France
-
Italy
-
Spain
-
The Netherlands
-
Rest of Europe
Asia-Pacific
-
Japan
-
South Korea
-
China
-
India
-
Australia
-
Rest of Asia-Pacific
The Middle East & Africa
-
Israel
-
UAE
-
South Africa
-
Rest of Middle East & Africa
Latin America
-
Brazil
-
Argentina
-
Rest of Latin America
KEY PLAYERS
The major players are EOS GmbH, 3D Systems Corporation, Honeywell. General Electric, Stratasys Ltd., Materialise NV, Exone, Norsk Titanium, Renishaw PLC, Markforged, Liebherr, TrumpF & Other Players.
3D Systems Corporation-Company Financial Analysis
| Report Attributes | Details |
|---|---|
| Market Size in 2023 | US$ 3.64 Billion |
| Market Size by 2031 | US$ 12.11 Billion |
| CAGR | CAGR of 16.2% From 2024 to 2031 |
| Base Year | 2023 |
| Forecast Period | 2024-2031 |
| Historical Data | 2020-2022 |
| Report Scope & Coverage | Market Size, Segments Analysis, Competitive Landscape, Regional Analysis, DROC & SWOT Analysis, Forecast Outlook |
| Key Segments | • By Offerings (Printers, Materials, Services, Software) • By Technology (Polymerization, Powder Bed Fusion, FDM, Others) • By Platform (Aircraft, UAVs, Spacecraft) • By End Product (Engine Components, Structural Components, Others) • By End Use (OEM, MRO) • By Application (Prototyping, Tooling, Functional Parts) |
| Regional Analysis/Coverage | North America (USA, Canada, Mexico), Europe (Germany, UK, France, Italy, Spain, Netherlands, Rest of Europe), Asia-Pacific (Japan, South Korea, China, India, Australia, Rest of Asia-Pacific), The Middle East & Africa (Israel, UAE, South Africa, Rest of Middle East & Africa), Latin America (Brazil, Argentina, Rest of Latin America) |
| Company Profiles | EOS GmbH, 3D Systems Corporation, Honeywell. General Electric, Stratasys Ltd., Materialise NV, Exone, Norsk Titanium, Renishaw PLC, Markforged, Liebherr,TrumpF |
| Key Drivers | • Increasing demand for convenience in the aviation industry |
| RESTRAINTS | • Lightweight materials use great weight loss benefits but at a higher cost. |
Frequently Asked Questions
North America, Europe, Asia-Pacific, The Middle East & Africa, Latin America are major five region covered in this region.
Manufacturers/Service provider, Consultant, Association, Research institute, private and universities libraries, Suppliers and Distributors of the product.
Development of advanced 3D printing technology that requires less production time and It removes the layer through layer processes, unlike other 3D printing technologies, such as SLA and SLS. Another technology is DMLS, which uses powdered metals instead of powdered thermoplastic in making metal parts
It is used to produce metal brackets that perform structural work inside the aircraft. Prototypes are increasingly being printed in 3D, allowing designers to refine the form and proportions of completed parts. 3D printing services produce internal aircraft components such as cockpit dashboards and door handles.
Aerospace 3D Printing Market Size was valued at USD 3.64 billion in 2023 and projected to grow to USD 12.11 billion by 2031, with a growing CAGR of 16.2 % over the forecast period 2024-2031.
Get in Touch
