image

Agricultural Surfactants Market Size, Share & Segment By Type (Non-ionic, Anionic, Cationic, and Amphoteric), Substrate Type (Synthetic and Bio-based), Crop Type (Cereals & Grains, Oilseeds & Pulses, and Fruits & Vegetables), Application (Herbicides, Insecticides, and Fungicides), and Region | Global Forecast 2025-2032

Date: June 2025 Report Code: SNS/C&M/7404 Page 200

Agricultural Surfactants Market Report Scope & Overview:

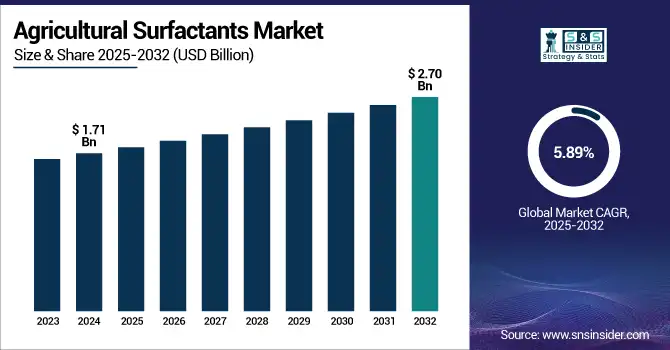
The Agricultural Surfactants Market size was valued at USD 1.71 billion in 2024 and is expected to reach USD 2.70 billion by 2032, growing at a CAGR of 5.89% over the forecast period of 2025-2032.

Agricultural Surfactants Market Revenue Analysis

To Get more information on Agricultural Surfactants Market - Request Free Sample Report

Growth in the agricultural surfactants market is driven by sustainability efforts and the increasing necessity of agrochemical efficacy following the implementation of stringent regulations.

On February 15, 2024, the U.S. EPA announced a PFAS detection method for HDPE agrochemical containers to help strengthen safety. In December 2023, the agency took a step to restrict PFAS use in fluorinated HDPE packaging. The USDA also recognized the inaugural National Biobased Products Day on March 8, 2023, further signaling the value of its BioPreferred Program in driving the usage of biodegradable surfactants.

These are some of the factors driving the agricultural surfactants market trends, which also include the increasing acceptance of non-ionic and silicone surfactants in crop protection. Agricultural surfactant companies are moving toward bio-based agro surfactants to conform to regulatory norms. The agricultural surfactants market share is increasingly driven by environmentally friendly formulations and precision delivery technologies which are contributing to market sustainability and innovation. Progressive innovations in the surfactant technology for crop protection and sustainable agricultural practices will continue to stimulate the growth of agricultural surfactants industry.

Agricultural Surfactants Market Dynamics:

Drivers:

  • Extensive Adoption of Precision Farming Technologies Necessitates Specialized Surfactant Integration

Rising adoption of precision agriculture technologies is considerably contributing to the growth of the agricultural surfactants market. More than half of medium-sized and nearly all large farms use precision guidance autosteering to enhance application efficiency. These applications need the use of surfactants that favor droplet spread and retention, especially non-ionic and silicone-based based to decrease chemical drift and increase efficacy. Agricultural surfactant companies are developing formulations that are compatible with VRT and sensor-based input applications to increase their share of agricultural and crop growth. This trend is consistent with the growing necessity for precision crop protection, which is strengthening changes in agrochemical surfactant market trends and focusing on the importance of personalized adjuvants and modern farming.

  • EPA’s 2024 PFAS Detection Method Elevates Surfactant Safety Compliance in Packaging Operations

New EPA techniques for measuring ultra-low PFAS amounts in plastic containers are having a large effect on agricultural surfactant companies. This has led to an increase in quality control for surfactant packaging as new standards arise, and new regulations have been passed, including label changes. Agrochemical manufacturers need to ensure their surfactant formulations are PFAS-free, and the cost of compliance is ramping up. This legislation is pushing up the demand for safer or PFAS-free surfactants and packaging materials, which impacts the agricultural surfactants industry analysis. Companies are investing in advanced testing equipment and supply chain auditing, stimulating support for the market by matching products to more stringent environmental regulations and by building consumer confidence in sustainable surfactants.

Restraints:

  • Stringent Pesticide Adjuvant Regulations Increase Compliance Costs for Surfactant Manufacturers

The agricultural surfactant industry is facing increased regulatory challenges, however, there is significant potential to be more regulatory complaints as well. Such demands consist of improved reporting and compatibility, along with escalating development and R&D, and operational costs. This adds to the compliance cost and restricts investment in innovation, which may hinder the growth of the agricultural surfactants market. Surfactant formulators are also being exposed to higher legal risks and are required to constantly review packaging labels, leading to a loss of production potential. Accordingly, regulations and their challenging nature stunt the potential growth of market share in the agricultural surfactants sector and create entry hurdles, particularly for smaller producers who cannot afford increasing compliance costs.

  • Smallholder Farmers’ Limited Access to Advanced Technologies Restricts Eco-friendly Surfactant Uptake

Although bio-based agricultural surfactants continue to become more available worldwide, smallholder farmers, particularly in developing countries, may not have access to precision-farming technology to utilize them to their fullest extent. Limited availability of capital for training and immobile prevents them from being adopted on a large-scale, preventing a penetration into the market. This technology and knowledge gap impedes the expansion of sustainable surfactants and retards the transition to environmentally benign solutions in crop protection. Thus, the growth of agricultural surfactants market is uneven across regions and has relatively low uptake in key emerging markets, which are restraining the overall agricultural surfactants market size and there by the potential environmental benefits.

Agricultural Surfactants Market Segmentation Analysis:

By Type

Anionic surfactant product type dominated the agricultural surfactants market in 2024, owing to the demonstrated compatibility of these products with all major herbicide chemistries and their ability to provide excellent performance under different field conditions. In 2017, over 60 % of new adjuvant registrations in the U.S. were anionic products, and these products have become a major part of crop-protection programs. Surfactant suppliers have innovated their portfolios around these proven chemistries, building market share on strong spray performance and wide application flexibility.

However, non-ionic surfactants projected the fastest growth at 6.28% CAGR during 2025-2032, driven by the requirement for drift-reduction and advanced spray-coverage technologies. The USDA BioPreferred rewards approved more than 120 new non-ionic adjuvants in 2023 and reinforces the government's commitment to sustainable, high-performance formulations. Growing environmental standards and precision-agriculture requirements are favoring the usage of non-ionic solutions, prompting the agro surfactants in the crop protection sector.
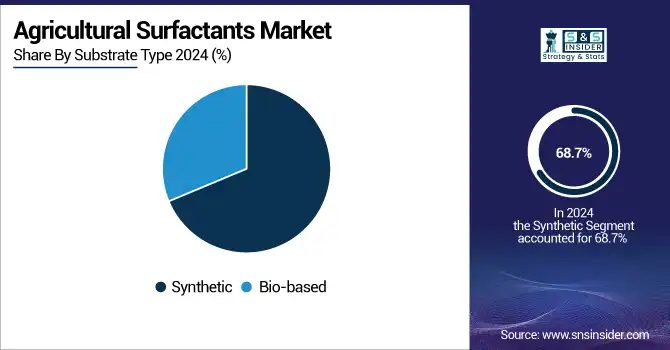
By Substrate Type

Synthetic surfactants dominated and accounted for 68.7% of the agricultural surfactants market in 2024, showing how mature the petrochemical supply chains are and their price advantage for large-scale crop protection. Large players in the industrial manufacturing segments capitalized on existing resin and surfactant infrastructures to supply high volume demand, winning industry pricing power. The USDA data indicate that the previous trend of synthetic adjuvants remaining the most common surfactants for agricultural use among prevalent commodity crops holds as their results-driven nature, along with higher supply availability, keeps augmenting their share in the agricultural surfactants market.

The Bio-based surfactants segment is anticipated to be the fastest-growing segment with the highest CAGR of 6.22% during the forecast period of 2025-2032. Growth is driven by the USDA BioPreferred procurement mandates and increasing end-user demand for environmentally friendly adjuvants. The expanded catalog of the program includes more than 8,000 biobased products certified through this program, fuelling the growth of the agricultural surfactants market toward sustainable chemistries. To match federal sustainability goals and changing consumer preferences, leading agricultural surfactant companies are upscaling bio-based production and improving adoption in precision-application systems.

Agricultural-Surfactants-Market-By-Substrate-Type

By Crop Type

Cereals & grains dominated and accounted for 43.6% of agricultural surfactants use in 2024 due to the widespread use of such crops in key growing areas. In 2023, the USDA figures indicate more than 412 million acres planted with cereals & grains requiring high loads of surfactants to facilitate effective herbicide and fungicide applications. Market leaders have built supply chains and service programs around these high-acre crops, with dedicated crop-protection partnerships and technical support.

During the forecast period of 2025-2032, fruits & vegetables applications are projected to be the fastest growing crop type with the highest growth rate of 6.96%, owing to the trend of low-residue & food-safety adjuvants in the sector. Increased pressure from FDA and USDA standards on post-harvest treatments compared to previously marketed surfactants released to maximize pesticide performance while minimizing residues. To meet this need, manufacturers of agricultural surfactants have responded with more specialized formulations, increasing market growth for this high-value crop segment.

By Application

Herbicides dominated and accounted for about 49.6% of the agricultural surfactants market in 2024, with growers preferring to use effective weed-control products across large expanses of acreage. For instance, EPA reports that nearly 50% of all adjuvants registered are used in combination with glyphosate and paraquat products, which highlights the importance of surfactants for herbicide efficacy. All surfactant companies have developed products for drift control and rain fastness and captured market share by delivering established herbicide enhancement services.

The insecticide application segment is projected to be the fastest-growing, with a 6.89% CAGR in the forecast period over 2025-2032, owing to the increase in pest-resistance issues combined with integrated pest management. Regulation pressures for lower chemical loads mean increasing demand for surfactants to enhance the delivery of active ingredients for low-dose insecticide programs. Agricultural surfactant manufacturers are developing formulations to improve bio-efficacy and to make it compatible with natural biopesticides, and this is expected to fuel the growth of the segment.

Agricultural Surfactants Market Regional Outlook:

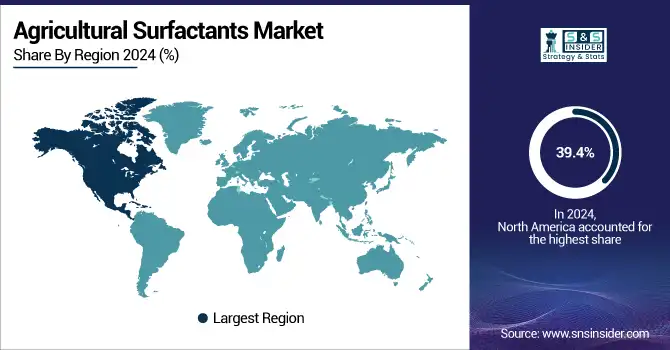
North America dominated and held 39.4% of the global agricultural surfactants market in 2024, benefiting from the U.S. and Canada driving the innovation, and with Mexican approvals being simplified.

The U.S is dominating the North American agricultural surfactants market with the largest market share of approximately 60% and market value of USD 402.66 million. In the U.S., over USD 25 million in Conservation Innovation Grants were awarded by the USDA in 2023 for surfactant R&D and facilitated advanced adjuvants on more than 85 million acres. At the same time, EPA approvals of drift-control products encouraged the adoption of precision sprays. The Agri Innovate program in Canada allocated CAD 75 million to scale up bio-based agricultural surfactants, increasing the output by 18 %. The 2023 SAGARPA reform in Mexico resulted in a 40% reduction in registration times, leading to the introduction of new formulations over 30 million hectares of cropland in just a few years.

The Asia Pacific is the fastest-growing region, with the highest CAGR of 7.31% of the market in 2024, on account of large government support and growing agricultural modernization. The “Agro-Modernization 2030” project in China, using advanced surfactant programs on over 120 million ha, led to a 16% increase in spray efficiency. As per India’s 2023 National Agrochemical Policy, 60 bio-based surfactant formulations have been fast-tracked for approval, with way of 35% cut in evaluation time. Australia’s National Smart Farming Program committed AUD 90 million to precision-spray studies for improved adjuvants’ use. The Japanese Ministry of Agriculture, Forestry and Fisheries financed 45 pilot experiments on drift-resistance agents, pushing the agricultural surfactants market growth and development in the entire region.

Europe secured a 25.7 % share of the agricultural surfactants market in 2024, on account of regulatory support and sustainable agricultural practices. A €120-million water-efficiency fund initiated by Germany’s Federal Ministry of Food and Agriculture demanded experimental use of eco-adjuvants on 10 % of arable land, while France’s Eco-Phyto scheme assigned €200 million for 2023 to incentivize low-drift surfactant technologies, nudging biodegradable adjuvant consumption to 22 %. In Italy, the €15 million investment offered by Emilia-Romagna accelerated the application of sustainable adjuvants to 65% of the vineyard. Spain’s adoption EU water-use directives led to an increase of 25% year over year in environmentally friendly surfactant use by the nation’s horticultural industry.

Agricultural-Surfactants-Market-By-Region

Get Customized Report as per Your Business Requirement - Enquiry Now

Key Players:

The major agricultural surfactants market competitors include BASF SE, Dow Inc., Evonik Industries AG, Clariant AG, Solvay S.A., Croda International Plc, Stepan Company, Huntsman Corporation, Helena Agri-Enterprises, LLC, and Nufarm.

Recent Developments:

  • In October 2024, AmphiStar launched two upcycled biosurfactants, AmphiCare and AmphiClean, derived from local organic waste through biological conversion, becoming the first commercial microbial surfactants of their kind.

  • In January 2024, Bionema introduced a biodegradable surfactant for agricultural biologicals and agrochemicals, enhancing water and nutrient uptake, reducing soil repellence, and improving the delivery of crop-protection agents in varied soils.

Agricultural Surfactants Market Report Scope:

Report Attributes Details
Market Size in 2024 USD 1.71 billion
Market Size by 2032 USD 2.70 billion
CAGR CAGR of 5.89% From 2025 to 2032
Base Year 2024
Forecast Period 2025-2032
Historical Data 2021-2023
Report Scope & Coverage Market Size, Segments Analysis, Competitive Landscape, Regional Analysis, DROC & SWOT Analysis, Forecast Outlook
Key Segments •By Type (Non-ionic, Anionic, Cationic, Amphoteric)
•By Substrate Type (Synthetic, Bio-based)
•By Crop Type (Cereals & Grains, Oilseeds & Pulses, Fruits & Vegetables, Others)
•By Application (Herbicides, Insecticides, Fungicides, Others)
Regional Analysis/Coverage North America (US, Canada, Mexico), Europe (Germany, France, UK, Italy, Spain, Poland, Turkey, Rest of Europe), Asia Pacific (China, India, Japan, South Korea, Singapore, Australia, Rest of Asia Pacific), Middle East & Africa (UAE, Saudi Arabia, Qatar, South Africa, Rest of Middle East & Africa), Latin America (Brazil, Argentina, Rest of Latin America)
Company Profiles BASF SE, Dow Inc., Evonik Industries AG, Clariant AG, Solvay S.A., Croda International Plc, Stepan Company, Huntsman Corporation, Helena Agri-Enterprises, LLC, and Nufarm

Frequently Asked Questions

The agricultural surfactants market size was valued at USD 1.71 billion in 2024.

The agricultural surfactants market is expected to reach USD 2.70 billion by 2032.

Non-ionic surfactants are growing fastest with a 6.28% CAGR, supported by USDA BioPreferred certifications.

The EPA’s PFAS detection method in February 2024 elevated packaging safety in the agricultural surfactants market.

China deployed surfactant protocols on 120M hectares under its Agro-Modernization 2030, boosting market efficiency by 16%.

Table of Contents:

1. Introduction

1.1 Market Definition

1.2 Scope (Inclusion and Exclusions)

1.3 Research Assumptions

2. Executive Summary

2.1 Market Overview

2.2 Regional Synopsis

2.3 Competitive Summary

3. Research Methodology

3.1 Top-Down Approach

3.2 Bottom-up Approach

3.3. Data Validation

3.4 Primary Interviews

4. Market Dynamics Impact Analysis

4.1 Market Driving Factors Analysis

4.1.1 Drivers

4.1.2 Restraints

4.1.3 Opportunities

4.1.4 Challenges

4.2 PESTLE Analysis

4.3 Porter’s Five Forces Model

5. Statistical Insights and Trends Reporting

5.1 Investments in Bio-based Surfactant Research

5.2 Green Certification Impact Analysis

5.3 Research and Development Spend by Region

5.4 Number of Pilot Programs Using Eco-Friendly Surfactants

5.5 End-User Awareness Campaigns Reach Metrics

6. Competitive Landscape

6.1 List of Major Companies By Region

6.2 Market Share Analysis By Region

6.3 Product Benchmarking

6.3.1 Product specifications and features

6.3.2 Pricing

6.4 Strategic Initiatives

6.4.1 Marketing and promotional activities

6.4.2 Distribution and Supply Chain Strategies

6.4.3 Expansion plans and new product launches

6.4.4 Strategic partnerships and collaborations

6.5 Technological Advancements

6.6 Market Positioning and Branding

7. Agricultural Surfactants Market Segmentation by Type

7.1 Chapter Overview

7.2 Non-ionic

7.2.1 Non-ionic Market Trends Analysis (2020-2032)

7.2.2 Non-ionic Market Size Estimates and Forecasts to 2032 (USD Billion)

7.3 Anionic

7.3.1 Anionic Market Trends Analysis (2020-2032)

7.3.2 Anionic Market Size Estimates and Forecasts to 2032 (USD Billion)

7.4 Cationic

7.4.1 Cationic Market Trends Analysis (2020-2032)

7.4.2 Cationic Market Size Estimates and Forecasts to 2032 (USD Billion)

7.5 Amphoteric

7.5.1 Amphoteric Market Trends Analysis (2020-2032)

7.5.2 Amphoteric Market Size Estimates and Forecasts to 2032 (USD Billion)

8. Agricultural Surfactants Market Segmentation By Substrate Type

8.1 Chapter Overview

8.2 Synthetic

8.2.1 Synthetic Market Trends Analysis (2020-2032)

8.2.2 Synthetic Market Size Estimates and Forecasts to 2032 (USD Billion)

8.3 Bio-based

       8.3.1 Bio-based Market Trends Analysis (2020-2032)

       8.3.2 Bio-based Market Size Estimates and Forecasts to 2032 (USD Billion)

9. Agricultural Surfactants Market Segmentation by Crop Type

9.1 Chapter Overview

9.2 Cereals & Grains

9.2.1 Cereals & Grains Market Trends Analysis (2020-2032)

9.2.2 Cereals & Grains Market Size Estimates and Forecasts to 2032 (USD Billion)

9.3 Oilseeds & Pulses

9.3.1 Oilseeds & Pulses Market Trends Analysis (2020-2032)

9.3.2 Oilseeds & Pulses Market Size Estimates and Forecasts to 2032 (USD Billion)

9.4 Fruits & Vegetables

9.4.1 Fruits & Vegetables Market Trends Analysis (2020-2032)

9.4.2 Fruits & Vegetables Market Size Estimates and Forecasts to 2032 (USD Billion)

9.5 Others

9.5.1 Others Market Trends Analysis (2020-2032)

9.5.2 Others Market Size Estimates and Forecasts to 2032 (USD Billion)

10. Agricultural Surfactants Market Segmentation by Application

10.1 Chapter Overview

10.2 Herbicides

10.2.1 Herbicides Market Trends Analysis (2020-2032)

10.2.2 Herbicides Market Size Estimates and Forecasts to 2032 (USD Billion)

10.3 Insecticides

10.3.1 Insecticides Market Trend Analysis (2020-2032)

10.3.2 Insecticides Market Size Estimates and Forecasts to 2032 (USD Billion)

10.4 Fungicides

10.4.1 Fungicides Market Trends Analysis (2020-2032)

10.4.2 Fungicides Market Size Estimates and Forecasts to 2032 (USD Billion)

10.5 Others

10.5.1 Others Market Trends Analysis (2020-2032)

10.5.2 Others Market Size Estimates and Forecasts to 2032 (USD Billion)

11. Regional Analysis

11.1 Chapter Overview

11.2 North America

11.2.1 Trend Analysis

11.2.2 North America Agricultural Surfactants Market Estimates and Forecasts by Country (2020-2032) (USD Billion)

11.2.3 North America Agricultural Surfactants Market Estimates and Forecasts by Type (2020-2032) (USD Billion) 

11.2.4 North America Agricultural Surfactants Market Estimates and Forecasts By Substrate Type (2020-2032) (USD Billion)

11.2.5 North America Agricultural Surfactants Market Estimates and Forecasts by Crop Type (2020-2032) (USD Billion)

11.2.6 North America Agricultural Surfactants Market Estimates and Forecasts by Application (2020-2032) (USD Billion)

11.2.7 USA

11.2.7.1 USA Agricultural Surfactants Market Estimates and Forecasts by Type (2020-2032) (USD Billion)

11.2.7.2 USA Agricultural Surfactants Market Estimates and Forecasts By Substrate Type (2020-2032) (USD Billion)

11.2.7.3 USA Agricultural Surfactants Market Estimates and Forecasts by Crop Type (2020-2032) (USD Billion)

11.2.7.4 USA Agricultural Surfactants Market Estimates and Forecasts by Application (2020-2032) (USD Billion)

11.2.8 Canada

11.2.8.1 Canada Agricultural Surfactants Market Estimates and Forecasts by Type (2020-2032) (USD Billion)

11.2.8.2 Canada Agricultural Surfactants Market Estimates and Forecasts By Substrate Type (2020-2032) (USD Billion)

11.2.8.3 Canada Agricultural Surfactants Market Estimates and Forecasts by Crop Type (2020-2032) (USD Billion)

11.2.8.4 Canada Agricultural Surfactants Market Estimates and Forecasts by Application (2020-2032) (USD Billion)

11.2.9 Mexico

11.2.9.1 Mexico Agricultural Surfactants Market Estimates and Forecasts by Type (2020-2032) (USD Billion)

11.2.9.2 Mexico Agricultural Surfactants Market Estimates and Forecasts By Substrate Type (2020-2032) (USD Billion)

11.2.9.3 Mexico Agricultural Surfactants Market Estimates and Forecasts by Crop Type (2020-2032) (USD Billion)

11.2.9.4 Mexico Agricultural Surfactants Market Estimates and Forecasts by Application (2020-2032) (USD Billion)

11.3 Europe

11.3.1 Trend Analysis

11.3.2 Europe Agricultural Surfactants Market Estimates and Forecasts by Country (2020-2032) (USD Billion)

11.3.3 Europe Agricultural Surfactants Market Estimates and Forecasts by Type (2020-2032) (USD Billion) 

11.3.4 Europe Agricultural Surfactants Market Estimates and Forecasts By Substrate Type (2020-2032) (USD Billion)

11.3.5 Europe Agricultural Surfactants Market Estimates and Forecasts by Crop Type (2020-2032) (USD Billion)

11.3.6 Europe Agricultural Surfactants Market Estimates and Forecasts by Application (2020-2032) (USD Billion)

11.3.7 Germany

11.3.7.1 Germany Agricultural Surfactants Market Estimates and Forecasts by Type (2020-2032) (USD Billion)

11.3.7.2 Germany Agricultural Surfactants Market Estimates and Forecasts By Substrate Type (2020-2032) (USD Billion)

11.3.7.3 Germany Agricultural Surfactants Market Estimates and Forecasts by Crop Type (2020-2032) (USD Billion)

11.3.7.4 Germany Agricultural Surfactants Market Estimates and Forecasts by Application (2020-2032) (USD Billion)

11.3.8 France

11.3.8.1 France Agricultural Surfactants Market Estimates and Forecasts by Type (2020-2032) (USD Billion)

11.3.8.2 France Agricultural Surfactants Market Estimates and Forecasts By Substrate Type (2020-2032) (USD Billion)

11.3.8.3 France Agricultural Surfactants Market Estimates and Forecasts by Crop Type (2020-2032) (USD Billion)

11.3.8.4 France Agricultural Surfactants Market Estimates and Forecasts by Application (2020-2032) (USD Billion)

11.3.9 UK

11.3.9.1 UK Agricultural Surfactants Market Estimates and Forecasts by Type (2020-2032) (USD Billion)

11.3.9.2 UK Agricultural Surfactants Market Estimates and Forecasts By Substrate Type (2020-2032) (USD Billion)

11.3.9.3 UK Agricultural Surfactants Market Estimates and Forecasts by Crop Type (2020-2032) (USD Billion)

11.3.9.4 UK Agricultural Surfactants Market Estimates and Forecasts by Application  (2020-2032) (USD Billion)

11.3.10 Italy

11.3.10.1 Italy Agricultural Surfactants Market Estimates and Forecasts by Type (2020-2032) (USD Billion)

11.3.10.2 Italy Agricultural Surfactants Market Estimates and Forecasts By Substrate Type (2020-2032) (USD Billion)

11.3.10.3 Italy Agricultural Surfactants Market Estimates and Forecasts by Crop Type (2020-2032) (USD Billion)

11.3.10.4 Italy Agricultural Surfactants Market Estimates and Forecasts by Application (2020-2032) (USD Billion)

11.3.11 Spain

11.3.11.1 Spain Agricultural Surfactants Market Estimates and Forecasts by Type (2020-2032) (USD Billion)

11.3.11.2 Spain Agricultural Surfactants Market Estimates and Forecasts By Substrate Type (2020-2032) (USD Billion)

11.3.11.3 Spain Agricultural Surfactants Market Estimates and Forecasts by Crop Type (2020-2032) (USD Billion)

11.3.11.4 Spain Agricultural Surfactants Market Estimates and Forecasts by Application (2020-2032) (USD Billion)

11.3.12 Poland

11.3.12.1 Poland Agricultural Surfactants Market Estimates and Forecasts by Type (2020-2032) (USD Billion)

11.3.12.2 Poland Agricultural Surfactants Market Estimates and Forecasts By Substrate Type (2020-2032) (USD Billion)

11.3.12.3 Poland Agricultural Surfactants Market Estimates and Forecasts by Crop Type (2020-2032) (USD Billion)

11.3.12.4 Poland Agricultural Surfactants Market Estimates and Forecasts by Application (2020-2032) (USD Billion)

11.3.13 Turkey

11.3.13.1 Turkey Agricultural Surfactants Market Estimates and Forecasts by Type (2020-2032) (USD Billion)

11.3.13.2 Turkey Agricultural Surfactants Market Estimates and Forecasts By Substrate Type (2020-2032) (USD Billion)

11.3.13.3 Turkey Agricultural Surfactants Market Estimates and Forecasts by Crop Type (2020-2032) (USD Billion)

11.3.13.4 Turkey Agricultural Surfactants Market Estimates and Forecasts by Application (2020-2032) (USD Billion)

11.3.14 Rest of Europe

11.3.14.1 Rest of Europe Agricultural Surfactants Market Estimates and Forecasts by Type (2020-2032) (USD Billion)

11.3.14.2 Rest of Europe Agricultural Surfactants Market Estimates and Forecasts By Substrate Type (2020-2032) (USD Billion)

11.3.14.3 Rest of Europe Agricultural Surfactants Market Estimates and Forecasts by Crop Type (2020-2032) (USD Billion)

11.3.14.4 Rest of Europe Agricultural Surfactants Market Estimates and Forecasts by Application (2020-2032) (USD Billion)

11.4 Asia Pacific

11.4.1 Trend Analysis

11.4.2 Asia Pacific Agricultural Surfactants Market Estimates and Forecasts by Country (2020-2032) (USD Billion)

11.4.3 Asia Pacific Agricultural Surfactants Market Estimates and Forecasts by Type (2020-2032) (USD Billion) 

11.4.4 Asia Pacific Agricultural Surfactants Market Estimates and Forecasts By Substrate Type (2020-2032) (USD Billion)

11.4.5 Asia Pacific Agricultural Surfactants Market Estimates and Forecasts by Crop Type (2020-2032) (USD Billion)

11.4.6 Asia Pacific Agricultural Surfactants Market Estimates and Forecasts by Application (2020-2032) (USD Billion)

11.4.7 China

11.4.7.1 China Agricultural Surfactants Market Estimates and Forecasts by Type (2020-2032) (USD Billion)

11.4.7.2 China Agricultural Surfactants Market Estimates and Forecasts By Substrate Type (2020-2032) (USD Billion)

11.4.7.3 China Agricultural Surfactants Market Estimates and Forecasts by Crop Type (2020-2032) (USD Billion)

11.4.7.4 China Agricultural Surfactants Market Estimates and Forecasts by Application (2020-2032) (USD Billion)

11.4.8 India

11.4.8.1 India Agricultural Surfactants Market Estimates and Forecasts by Type (2020-2032) (USD Billion)

11.4.8.2 India Agricultural Surfactants Market Estimates and Forecasts By Substrate Type (2020-2032) (USD Billion)

11.4.8.3 India Agricultural Surfactants Market Estimates and Forecasts by Crop Type (2020-2032) (USD Billion)

11.4.8.4 India Agricultural Surfactants Market Estimates and Forecasts by Application (2020-2032) (USD Billion)

11.4.9 Japan

11.4.9.1 Japan Agricultural Surfactants Market Estimates and Forecasts by Type (2020-2032) (USD Billion)

11.4.9.2 Japan Agricultural Surfactants Market Estimates and Forecasts By Substrate Type (2020-2032) (USD Billion)

11.4.9.3 Japan Agricultural Surfactants Market Estimates and Forecasts by Crop Type (2020-2032) (USD Billion)

11.4.9.4 Japan Agricultural Surfactants Market Estimates and Forecasts by Application (2020-2032) (USD Billion)

11.4.10 South Korea

11.4.10.1 South Korea Agricultural Surfactants Market Estimates and Forecasts by Type (2020-2032) (USD Billion)

11.4.10.2 South Korea Agricultural Surfactants Market Estimates and Forecasts By Substrate Type (2020-2032) (USD Billion)

11.4.10.3 South Korea Agricultural Surfactants Market Estimates and Forecasts by Crop Type (2020-2032) (USD Billion)

11.4.10.4 South Korea Agricultural Surfactants Market Estimates and Forecasts by Application (2020-2032) (USD Billion)

11.4.11 Singapore

11.4.11.1 Singapore Agricultural Surfactants Market Estimates and Forecasts by Type (2020-2032) (USD Billion)

11.4.11.2 Singapore Agricultural Surfactants Market Estimates and Forecasts By Substrate Type (2020-2032) (USD Billion)

11.4.11.3 Singapore Agricultural Surfactants Market Estimates and Forecasts by Crop Type (2020-2032) (USD Billion)

11.4.11.4 Singapore Agricultural Surfactants Market Estimates and Forecasts by Application (2020-2032) (USD Billion)

11.4.12 Australia

11.4.12.1 Australia Agricultural Surfactants Market Estimates and Forecasts by Type (2020-2032) (USD Billion)

11.4.12.2 Australia Agricultural Surfactants Market Estimates and Forecasts By Substrate Type (2020-2032) (USD Billion)

11.4.12.3 Australia Agricultural Surfactants Market Estimates and Forecasts by Crop Type (2020-2032) (USD Billion)

11.4.12.4 Australia Agricultural Surfactants Market Estimates and Forecasts by Application (2020-2032) (USD Billion)

11.4.13 Rest of Asia Pacific

11.4.13.1 Rest of Asia Pacific Agricultural Surfactants Market Estimates and Forecasts by Type (2020-2032) (USD Billion)

11.4.13.2 Rest of Asia Pacific Agricultural Surfactants Market Estimates and Forecasts By Substrate Type (2020-2032) (USD Billion)

11.4.13.3 Rest of Asia Pacific Agricultural Surfactants Market Estimates and Forecasts by Crop Type (2020-2032) (USD Billion)

11.4.13.4 Rest of Asia Pacific Agricultural Surfactants Market Estimates and Forecasts by Application (2020-2032) (USD Billion)

11.5 Middle East and Africa

11.5.1 Trend Analysis

11.5.2 Middle East and Africa Agricultural Surfactants Market Estimates and Forecasts by Country (2020-2032) (USD Billion)

11.5.3 Middle East and Africa Agricultural Surfactants Market Estimates and Forecasts by Type (2020-2032) (USD Billion) 

11.5.4 Middle East and Africa Agricultural Surfactants Market Estimates and Forecasts By Substrate Type (2020-2032) (USD Billion)

11.5.5 Middle East and Africa Agricultural Surfactants Market Estimates and Forecasts by Crop Type (2020-2032) (USD Billion)

11.5.6 Middle East and Africa Agricultural Surfactants Market Estimates and Forecasts by Application (2020-2032) (USD Billion)

11.5.7 UAE

11.5.7.1 UAE Agricultural Surfactants Market Estimates and Forecasts by Type (2020-2032) (USD Billion)

11.5.7.2 UAE Agricultural Surfactants Market Estimates and Forecasts By Substrate Type (2020-2032) (USD Billion)

11.5.7.3 UAE Agricultural Surfactants Market Estimates and Forecasts by Crop Type (2020-2032) (USD Billion)

11.5.7.4 UAE Agricultural Surfactants Market Estimates and Forecasts by Application (2020-2032) (USD Billion)

11.5.8 Saudi Arabia

11.5.8.1 Saudi Arabia Agricultural Surfactants Market Estimates and Forecasts by Type (2020-2032) (USD Billion)

11.5.8.2 Saudi Arabia Agricultural Surfactants Market Estimates and Forecasts By Substrate Type (2020-2032) (USD Billion)

11.5.8.3 Saudi Arabia Agricultural Surfactants Market Estimates and Forecasts by Crop Type (2020-2032) (USD Billion)

11.5.8.4 Saudi Arabia Agricultural Surfactants Market Estimates and Forecasts by Application (2020-2032) (USD Billion)

11.5.1.9 Qatar

11.5.9.1 Qatar Agricultural Surfactants Market Estimates and                   Forecasts by Type (2020-2032) (USD Billion)

11.5.9.2 Qatar Agricultural Surfactants Market Estimates and Forecasts By Substrate Type (2020-2032) (USD Billion)

11.5.9.3 Qatar Agricultural Surfactants Market Estimates and Forecasts by Crop Type (2020-2032) (USD Billion)

11.5.1.9.4 Qatar Agricultural Surfactants Market Estimates and Forecasts by Application (2020-2032) (USD Billion)

11.5.10 South Africa

11.5.10.1 South Africa Agricultural Surfactants Market Estimates and Forecasts by Type (2020-2032) (USD Billion)

11.5.10.2 South Africa Agricultural Surfactants Market Estimates and Forecasts By Substrate Type (2020-2032) (USD Billion)

11.5.10.3 South Africa Agricultural Surfactants Market Estimates and Forecasts by Crop Type (2020-2032) (USD Billion)

11.5.10.4 South Africa Agricultural Surfactants Market Estimates and Forecasts by Application (2020-2032) (USD Billion)

11.5.11 Rest of Middle East & Africa

 11.5.11.1 Rest of Middle East & Africa Agricultural Surfactants Market Estimates and Forecasts by Type (2020-2032) (USD Billion)

11.5.11.2 Rest of Middle East & Africa  Agricultural Surfactants Market Estimates and Forecasts By Substrate Type (2020-2032) (USD Billion)

11.5.11.3 Rest of Middle East & Africa Agricultural Surfactants Market Estimates and Forecasts by Crop Type (2020-2032) (USD Billion)

11.5.11.4 Rest of Middle East & Africa Agricultural Surfactants Market Estimates and Forecasts by Application (2020-2032) (USD Billion)

11.6 Latin America

11.6.1 Trend Analysis

11.6.2 Latin America Agricultural Surfactants Market Estimates and Forecasts by Country (2020-2032) (USD Billion)

11.6.3 Latin America Agricultural Surfactants Market Estimates and Forecasts by Type (2020-2032) (USD Billion) 

11.6.4 Latin America Agricultural Surfactants Market Estimates and Forecasts By Substrate Type (2020-2032) (USD Billion)

11.6.5 Latin America Agricultural Surfactants Market Estimates and Forecasts by Crop Type (2020-2032) (USD Billion)

11.6.6 Latin America Agricultural Surfactants Market Estimates and Forecasts by Application (2020-2032) (USD Billion)

11.6.7 Brazil

11.6.7.1 Brazil Agricultural Surfactants Market Estimates and Forecasts by Type (2020-2032) (USD Billion)

11.6.7.2 Brazil Agricultural Surfactants Market Estimates and Forecasts By Substrate Type (2020-2032) (USD Billion)

11.6.7.3 Brazil Agricultural Surfactants Market Estimates and Forecasts by Crop Type (2020-2032) (USD Billion)

11.6.7.4 Brazil Agricultural Surfactants Market Estimates and Forecasts by Application (2020-2032) (USD Billion)

11.6.8 Argentina

11.6.8.1 Argentina Agricultural Surfactants Market Estimates and Forecasts by Type (2020-2032) (USD Billion)

11.6.8.2 Argentina Agricultural Surfactants Market Estimates and Forecasts By Substrate Type (2020-2032) (USD Billion)

11.6.8.3 Argentina Agricultural Surfactants Market Estimates and Forecasts by Crop Type (2020-2032) (USD Billion)

11.6.8.4 Argentina Agricultural Surfactants Market Estimates and Forecasts by Application (2020-2032) (USD Billion)

11.6.9 Rest of Latin America

11.6.9.1 Rest of Latin America Agricultural Surfactants Market Estimates and Forecasts by Type (2020-2032) (USD Billion)

11.6.9.2 Rest of Latin America Agricultural Surfactants Market Estimates and Forecasts By Substrate Type (2020-2032) (USD Billion)

11.6.9.3 Rest of Latin America Agricultural Surfactants Market Estimates and Forecasts by Crop Type (2020-2032) (USD Billion)

11.6.9.4 Rest of Latin America Agricultural Surfactants Market Estimates and Forecasts by Application (2020-2032) (USD Billion)

12. Company Profiles

12.1 BASF SE

         12.1.1 Company Overview

12.1.2 Financial

12.1.3 Products/ Services Offered

12.1.4 SWOT Analysis

12.2 Dow Inc.

         12.2.1 Company Overview

12.2.2 Financial

12.2.3 Products/ Services Offered

12.2.4 SWOT Analysis

12.3 Evonik Industries AG

         12.3.1 Company Overview

12.3.2 Financial

12.3.3 Products/ Services Offered

12.3.4 SWOT Analysis

12.4 Clariant AG

         12.4.1 Company Overview

12.4.2 Financial

12.4.3 Products/ Services Offered

12.4.4 SWOT Analysis

12.5 Solvay S.A.

         12.5.1 Company Overview

12.5.2 Financial

12.5.3 Products/ Services Offered

12.5.4 SWOT Analysis

12.6 Croda International Plc

         12.6.1 Company Overview

12.6.2 Financial

12.6.3 Products/ Services Offered

12.6.4 SWOT Analysis

12.7 Stepan Company

           12.7.1 Company Overview

12.7.2 Financial

12.7.3 Products/ Services Offered

12.7.4 SWOT Analysis

12.8 Huntsman Corporation

12.8.1 Company Overview

12.8.2 Financial

12.8.3 Products/ Services Offered

12.8.4 SWOT Analysis

12.9 Helena Agri-Enterprises, LLC

12.9.1 Company Overview

12.9.2 Financial

12.9.3 Products/ Services Offered

12.9.4 SWOT Analysis

12.10 Nufarm

12.10.1 Company Overview

12.10.2 Financial

12.10.3 Products/ Services Offered

12.10.4 SWOT Analysis

13. Use Cases and Best Practices

14. Conclusion

An accurate research report requires proper strategizing as well as implementation. There are multiple factors involved in the completion of good and accurate research report and selecting the best methodology to compete the research is the toughest part. Since the research reports we provide play a crucial role in any company’s decision-making process, therefore we at SNS Insider always believe that we should choose the best method which gives us results closer to reality. This allows us to reach at a stage wherein we can provide our clients best and accurate investment to output ratio.

Each report that we prepare takes a timeframe of 350-400 business hours for production. Starting from the selection of titles through a couple of in-depth brain storming session to the final QC process before uploading our titles on our website we dedicate around 350 working hours. The titles are selected based on their current market cap and the foreseen CAGR and growth.


The 5 steps process:

Step 1: Secondary Research:

Secondary Research or Desk Research is as the name suggests is a research process wherein, we collect data through the readily available information. In this process we use various paid and unpaid databases which our team has access to and gather data through the same. This includes examining of listed companies’ annual reports, Journals, SEC filling etc. Apart from this our team has access to various associations across the globe across different industries. Lastly, we have exchange relationships with various university as well as individual libraries.

Secondary Research

Step 2: Primary Research

When we talk about primary research, it is a type of study in which the researchers collect relevant data samples directly, rather than relying on previously collected data.  This type of research is focused on gaining content specific facts that can be sued to solve specific problems. Since the collected data is fresh and first hand therefore it makes the study more accurate and genuine.

We at SNS Insider have divided Primary Research into 2 parts.

Part 1 wherein we interview the KOLs of major players as well as the upcoming ones across various geographic regions. This allows us to have their view over the market scenario and acts as an important tool to come closer to the accurate market numbers. As many as 45 paid and unpaid primary interviews are taken from both the demand and supply side of the industry to make sure we land at an accurate judgement and analysis of the market.

This step involves the triangulation of data wherein our team analyses the interview transcripts, online survey responses and observation of on filed participants. The below mentioned chart should give a better understanding of the part 1 of the primary interview.

Primary Research

Part 2: In this part of primary research the data collected via secondary research and the part 1 of the primary research is validated with the interviews from individual consultants and subject matter experts.

Consultants are those set of people who have at least 12 years of experience and expertise within the industry whereas Subject Matter Experts are those with at least 15 years of experience behind their back within the same space. The data with the help of two main processes i.e., FGDs (Focused Group Discussions) and IDs (Individual Discussions). This gives us a 3rd party nonbiased primary view of the market scenario making it a more dependable one while collation of the data pointers.

Step 3: Data Bank Validation

Once all the information is collected via primary and secondary sources, we run that information for data validation. At our intelligence centre our research heads track a lot of information related to the market which includes the quarterly reports, the daily stock prices, and other relevant information. Our data bank server gets updated every fortnight and that is how the information which we collected using our primary and secondary information is revalidated in real time.

Data Bank Validation

Step 4: QA/QC Process

After all the data collection and validation our team does a final level of quality check and quality assurance to get rid of any unwanted or undesired mistakes. This might include but not limited to getting rid of the any typos, duplication of numbers or missing of any important information. The people involved in this process include technical content writers, research heads and graphics people. Once this process is completed the title gets uploader on our platform for our clients to read it.

Step 5: Final QC/QA Process:

This is the last process and comes when the client has ordered the study. In this process a final QA/QC is done before the study is emailed to the client. Since we believe in giving our clients a good experience of our research studies, therefore, to make sure that we do not lack at our end in any way humanly possible we do a final round of quality check and then dispatch the study to the client.

Key Segments: 

By Type

  • Non-ionic

  • Anionic

  • Cationic

  • Amphoteric

By Substrate Type

  • Synthetic

  • Bio-based

By Crop Type

  • Cereals & Grains

  • Oilseeds & Pulses

  • Fruits & Vegetables

  • Others

By Application

  • Herbicides

  • Insecticides

  • Fungicides

  • Others

Request for Segment Customization as per your Business Requirement: Segment Customization Request

Regional Coverage: 

North America

  • US

  • Canada

  • Mexico

Europe

  • Germany

  • France

  • UK

  • Italy

  • Spain

  • Poland

  • Turkey

  • Rest of Europe

Asia Pacific

  • China

  • India

  • Japan

  • South Korea

  • Singapore

  • Australia

  • Rest of Asia Pacific

Middle East & Africa

  • UAE

  • Saudi Arabia

  • Qatar

  • South Africa

  • Rest of Middle East & Africa

Latin America

  • Brazil

  • Argentina

  • Rest of Latin America

Request for Country Level Research Report: Country Level Customization Request

Available Customization 

With the given market data, SNS Insider offers customization as per the company’s specific needs. The following customization options are available for the report: 

  • Detailed Volume Analysis 

  • Criss-Cross segment analysis (e.g. Product X Application) 

  • Competitive Product Benchmarking 

  • Geographic Analysis 

  • Additional countries in any of the regions 

  • Customized Data Representation 

  • Detailed analysis and profiling of additional market players

Explore Key Insights 


  • Analyzes market trends, forecasts, and regional dynamics
  • Covers core offerings, innovations, and industry use cases
  • Profiles major players, value chains, and strategic developments
  • Highlights innovation trends, regulatory impacts, and growth opportunities
Request an Analyst Call