Agricultural Tires Market Report Scope & Overview:
Get More Information on Ultra High-Performance Tire Market - Request Sample Report
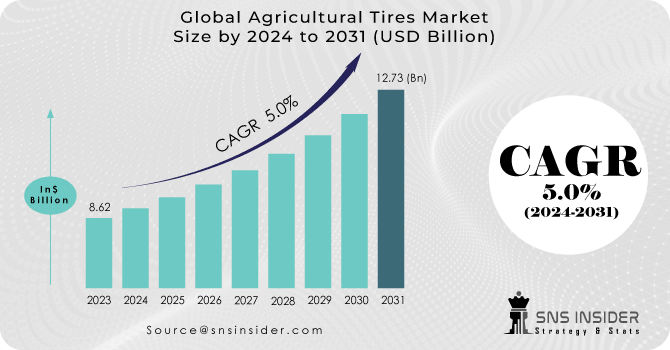
The Agricultural Tires Market Size was valued at USD 8.62 billion in 2023 and is expected to reach USD 12.73 billion by 2031 and grow at a CAGR of 5% over the forecast period 2024-2031.
Agriculture tires, as the name implies, are intended for use on farms or in the agricultural industry. These tires have a 45-degree slanted diagonal thread. The treads give the tractor the best traction possible, allowing it to move quickly through mud and soil. These are available in a number of sizes and diameters for tractors, combine harvesters, trailers, and skid steer loaders, among other types of equipment. These are made of high-quality rubber that will last a long time and give you better results on and off the field. For traction on slick surfaces, they have a lot of ribs and spaces. These tires’ fuel efficiency and hillside stability have both been increased. Diamond tread designs are used on some tires to reduce soil disruption.
The Agricultural Tires Market faces a dynamic demand landscape, fueled by contrasting forces. Rising global populations and increasing demand for food are driving up agricultural output, translating to increased demand for tractors and other farm machinery, consequently boosting agricultural tire needs. However, concerns over soil compaction and environmental sustainability are pushing farmers towards adopting wider, low-pressure tires that reduce soil impact, leading to potentially lower overall tire demand in the long run. Additionally, technological advancements like self-driving tractors could introduce new demand patterns for specialized agricultural tires in the future.
Tractors, combine harvesters, grain carts, field sprayers, and skid steer loaders are all transported on agricultural tires. While resisting the abrasive action of varied surfaces, they provide traction, braking, steering, and directional stability. They also absorb shock loads and cushion the vehicle against small surface abnormalities at low ground pressure. As a result, they assist farmers in maximizing crop output while reducing the risk of power hopping and soil compaction for exceptional results.
MARKET DYNAMICS:
KEY DRIVERS:
-
In agricultural equipment, technological breakthroughs have been made
-
Sales of farm vehicles are on the rise
-
The market is growing due to the introduction of low-pressure tires
The market is experiencing a notable surge, propelled by the innovative adoption of low-pressure tires. This groundbreaking advancement has ushered in a new era of efficiency and sustainability in the automotive industry. The introduction of low-pressure tires has not only revolutionized driving dynamics by enhancing comfort and traction but has also significantly reduced fuel consumption and carbon emissions. As consumers increasingly prioritize eco-friendly options, manufacturers are responding with cutting-edge technologies that not only meet but exceed expectations. This trend not only signifies a paradigm shift towards more sustainable transportation solutions but also underscores the industry's commitment to balancing performance with environmental responsibility, fostering a promising landscape for the future.
RESTRAINTS:
-
Changes in the design of agricultural machinery
-
Increased penetration into newer, uncharted territory stymies market expansion
OPPORTUNITIES:
-
The government's attractive subsidies serve as a catalyst for market investment
-
Tires with stronger rubber compounds are needed to expand penetration into newer, undiscovered terrain
-
Labor is cheap, and there is a lot of demand for tires
Certain agricultural practices, particularly the widespread use of agricultural vehicles, cast a shadow of negative environmental consequences over the landscape. These mechanized giants, essential for modern farming, contribute significantly to air and soil pollution. The combustion of fossil fuels in these vehicles releases greenhouse gases into the atmosphere, exacerbating climate change. Additionally, the heavy machinery can compact soil, disrupting its natural structure and reducing its ability to absorb water. This not only jeopardizes soil health but also increases the risk of erosion. As we navigate the delicate balance between feeding a growing population and preserving our planet, it becomes imperative to explore sustainable alternatives and innovations that can mitigate the environmental impact of conventional agricultural practices.
CHALLENGES:
-
Farm activities are weather-dependent, and commodity prices are volatile
-
Certain agricultural practices, such as the usage of agricultural vehicles, have negative environmental consequences
IMPACT OF Russia-Ukraine War:
The Russia-Ukraine crisis has significant implications for global agricultural markets, including the agricultural tires market. This is because Russia and Ukraine are crucial players in the global supply of wheat, corn, and sunflower oil, which impacts the broader agricultural sector and related industries. The conflict exacerbates inflationary pressures on food and energy prices, indirectly affecting the demand for agricultural machinery and, consequently, agricultural tires. As the crisis disrupts grain exports and production, it creates volatility in commodity markets, influencing the entire agricultural value chain
IMPACT OF ECONOMIC SLOWDOWN:
The ongoing economic slowdown can impact the agricultural tires market in several ways. One significant effect is the reduced demand for agricultural machinery due to lower overall economic activity. This slowdown can lead to decreased investment in agricultural equipment by farmers, which in turn affects the demand for agricultural tires. During economic downturns, farmers may delay the purchase of new equipment or replacement tires, opting to extend the use of their current machinery and tires beyond their optimal service life. This behavior can lead to a decrease in sales for both original equipment (OE) and replacement farm tires.
However, the agricultural sector's essential nature might mitigate the slowdown's impact to some extent. The need for food production continues regardless of economic conditions, which could help sustain some level of demand for agricultural tires. Moreover, advancements in tire technology, such as the development of low-pressure tires that reduce soil compaction and improve yields, could encourage investment in newer, more efficient tires, potentially offsetting some of the negative impacts of the economic slowdown.
Market, By Tire Type:
Based on the tire type segment, the global market has been divided into bias tires and radial tires. In the following years, the Radial Tires segment is expected to rise at a considerable CAGR. The radial tire market will be fueled by the high-performance features of radial tires combined with the low shelf life of classic bias tires.
Market, By Sales Channel:

The global market has been divided into OEM, and aftermarket based on the sales channel segment. The OEM is expected to hold the highest share and Aftermarket segment accounted for a substantial portion of the market and is expected to increase at a considerable CAGR in the following years. The factors can be ascribed to their lower cost when compared to OEM tires, the wide range of options available in the market, and the growing need to replace outdated tires with newer and better ones. The aftermarket caters to a broader range of existing vehicles, offering farmers more choice at potentially lower costs, but fostering fierce competition among tire manufacturers and distributors. This dynamic creates a complex market landscape where players must navigate strategies to balance initial sales with long-term aftermarket share and profitability.
Market, By Application:
Based on the application segment, the global market has been divided into Tractors, Sprayers, Trailers, Loaders, Combine Harvesters, and Others. The Tractors sector accounted for a substantial portion of the market and is expected to grow at a high CAGR in the future years because of the increasing use of tractors in numerous farm chores and the growing trend among farmers to invest in a vehicle that can reduce turnaround time and perform multiple duties due to their limited financial resources.
MARKET SEGMENTATION:
By Tire Type:
-
Bias Tires
-
Radial Tires
By Sales Channel:
-
OEM
-
Aftermarket
By Application:
-
Tractors
-
Sprayers
-
Trailers
-
Loaders
-
Combine Harvesters
-
Others
REGIONAL ANALYSIS:
North America, Europe, Asia-Pacific, and the rest of the globe make up the worldwide Agricultural Tires market. Because of advancements in farming equipment and evolution in the agricultural industry, North America will hold the highest part of the market, assisting the growth of modern-day integrated farming operations. Furthermore, due to the rapid expansion of agriculture in India and China, Asia-Pacific is now the world's second-fastest-growing region. China and India have a disproportionately large number of tractors in use around the world. As a result, they provide enormous prospects for farm tire makers. The region's leading businesses have benefited from the availability of important raw materials such as natural rubber, low labor costs, and significant local demand for tires.
REGIONAL COVERAGE:
North America
-
US
-
Canada
-
Mexico
Europe
-
Eastern Europe
-
Poland
-
Romania
-
Hungary
-
Turkey
-
Rest of Eastern Europe
-
-
Western Europe
-
Germany
-
France
-
UK
-
Italy
-
Spain
-
Netherlands
-
Switzerland
-
Austria
-
Rest of Western Europe
-
Asia Pacific
-
China
-
India
-
Japan
-
South Korea
-
Vietnam
-
Singapore
-
Australia
-
Rest of Asia Pacific
KEY PLAYERS:
Bridgestone Corp., MRF, Continental AG, Titan International, Inc., Pirelli & C SpA, Trelleborg AB, Goodyear, Michelin, Nokian Tires PLC, Belshina, Alliance Tire Group, Euro tire, Yokohama tire, Balakrishna Industries Limited, China National Tire & Rubber, and Apollo Tires are some of the affluent competitors with significant market share in the Agricultural Tires Market.
RECENT DEVELOPMENTS:
-
Continental AG: Launched their largest-ever tractor tire designed for high-horsepower tractors. This tire boasts enhanced load-carrying capacity, improved traction, and reduced soil compaction, catering to the demands of modern agriculture and aiming for increased efficiency and productivity.
-
Apollo Tyres Ltd.: Launched a new-generation agricultural tire range called Virat, specifically designed for tractors. These tires aim to provide industry-best traction, fuel efficiency, and load-carrying capacity while minimizing soil compaction.
-
Balkrishna Industries Ltd. (BKT): Announced plans to invest $250 million to expand their production capacity in the United States, indicating their commitment to the growing North American market.
Bridgestone Corp-Company Financial Analysis
| Report Attributes | Details |
|---|---|
| Market Size in 2023 | US$ 8.62 Billion |
| Market Size by 2031 | US$ 12.73 Billion |
| CAGR | CAGR of 5% From 2024 to 2031 |
| Base Year | 2023 |
| Forecast Period | 2024-2031 |
| Historical Data | 2020-2022 |
| Report Scope & Coverage | Market Size, Segments Analysis, Competitive Landscape, Regional Analysis, DROC & SWOT Analysis, Forecast Outlook |
| Key Segments | • by Tire Type (Bias Tires, Radial Tires) • by Sales Channel (OEM, Aftermarket) • by Application (Tractors, Sprayers, Trailers, Loaders, Combine Harvesters, Others) |
| Regional Analysis/Coverage | North America (US, Canada, Mexico), Europe (Eastern Europe [Poland, Romania, Hungary, Turkey, Rest of Eastern Europe] Western Europe] Germany, France, UK, Italy, Spain, Netherlands, Switzerland, Austria, Rest of Western Europe]), Asia Pacific (China, India, Japan, South Korea, Vietnam, Singapore, Australia, Rest of Asia Pacific), Middle East & Africa (Middle East [UAE, Egypt, Saudi Arabia, Qatar, Rest of Middle East], Africa [Nigeria, South Africa, Rest of Africa], Latin America (Brazil, Argentina, Colombia, Rest of Latin America) |
| Company Profiles | Bridgestone Corp., MRF, Continental AG, Titan International, Inc., Pirelli & C SpA, Trelleborg AB, Goodyear, Michelin, Nokian Tires PLC, Belshina, Alliance Tire Group, Euro tire, Yokohama tire, Balakrishna Industries Limited, China National Tire & Rubber, and Apollo Tires |
| Key Drivers | •In agricultural equipment, technological breakthroughs have been made. •Sales of farm vehicles are on the rise. |
| RESTRAINTS | •Changes in the design of agricultural machinery. •Increased penetration into newer, uncharted territory stymies market expansion. |
Get in Touch
