Electric Commercial Vehicle Market Report Scope & Overview:
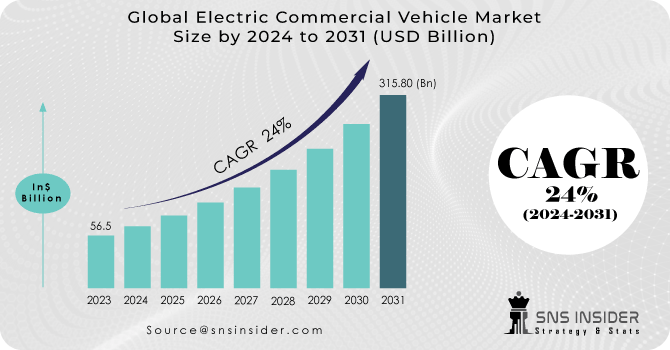
The Electric Commercial Vehicle Market Size was valued at USD 71.51 billion in 2023 and is expected to reach USD 521.92 billion by 2032 and grow at a CAGR of 24.74% over the forecast period 2024-2032.
The Electric Commercial Vehicle (ECV) Market is witnessing an increasing growth with nations looking for sustainable transportation and strict regulations in emissions. The market's driving force includes Japan, China, the USA, France, Germany, and India. Technological developments along with supportive government policies for the commercial vehicle segment in buses, trucks, and last-mile delivery vehicles have accelerated their adoption in 2023 and 2024.
China still remains the world's market leader, having sold over 60% of all electric buses worldwide in 2023, albeit with this share dropping from 90% in 2020 due to earlier market saturation. The government is focusing on the development of charging infrastructure with plans for 2030 to achieve full urban and highway coverage. Europe is also making headway with regulations for fast chargers every 60 km on major routes and zero-emission buses by 2035. The EU aims to have 1 million public charging points by 2025 and 3 million by 2030. In the US, efforts have accelerated with funding for public chargers by 2030. National Renewable Energy Laboratory estimates that by 2030, there will be 33 million EVs on the road, and 28 million EV charging ports will be required to support them. While Indian states have initiated collaborations to improve battery-swapping technologies, which are critical enablers for fleet electrification
Technological development also played a crucial role, such as the increase in battery swapping for light-duty vehicles and improvement in battery energy density. For example, Indian companies of battery-swapping businesses raised huge investments in 2023 to deploy robust infrastructure. Additionally, the electrification of heavy-duty trucks has picked up pace, and the global sales increased by 35% in 2023. It was especially in China, Europe, and the US.
Looking ahead, opportunities lie in expanding electric vehicle charging networks, integrating renewable energy for vehicle operations, and enhancing affordability through subsidies and cost-effective battery technologies. These developments align with global commitments to net-zero emissions, making the ECV market a cornerstone of future mobility.
MARKET DYNAMICS
KEY DRIVERS:
-
Governments worldwide are incentivizing electric vehicle adoption through subsidies, tax breaks, and regulations.
Aggressive policies to push ECV adoption are now coming from major market governments. China, for example, has already passed its 2025 targets, with over 60% of EV sales share by 2023 and has since transitioned to building charging infrastructure with over 85% of the world's fast chargers. Europe is implementing policy initiatives such as the Alternative Fuels Infrastructure Regulation, ensuring comprehensive charging availability along major corridors. Meanwhile, an extension of the US's Inflation Reduction Act and India's Production Linked Incentive (PLI) schemes reduced the cost of production for electric vehicles and thus brought them within reach.
-
Steadily climbing environmental awareness, which is driving the shift toward zero-emission commercial vehicles globally.
Public awareness regarding climate change and urban air quality has been a driver of the transition to ECVs. Sales of electric trucks have increased by 35% in 2023. European and American cities have launched zero-emission zones to encourage the use of electric delivery trucks and buses. In India, last-mile delivery fleets are transitioning to EVs rapidly to achieve corporate sustainability objectives and save on operating costs.
RESTRAIN:
-
The high upfront cost of ECVs is one of the major barriers to adoption.
Even though battery costs are decreasing, high initial investment for electric commercial vehicles continues to keep most businesses away. For example, electric buses cost roughly 2-3 times more than their diesel counterparts, thus placing a huge financial burden on smaller fleets. Subsidies and tax incentives, while helping to offset costs, are often inadequate in developing economies where price sensitivity is much greater. Further, to the overall expense is the cost of developing charging infrastructure. In rural areas and developing markets access to charging stations is severely limited. Governments and manufacturers must collaborate to lower costs through economies of scale, enhanced battery technology, and robust financial incentives to ensure widespread adoption.
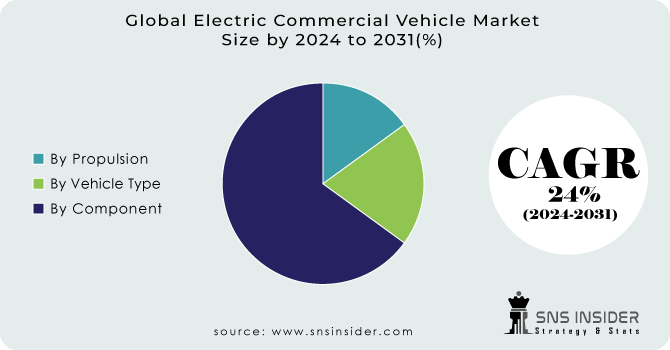
KEY MARKET SEGMENTS
BY PROPULSION
The Battery Electric Vehicles (BEVs) segment has led the market in 2023 with a share of 56%, as it is highly adopted owing to low battery prices, large charging infrastructure, and government incentives. In urban delivery and public transport, BEVs are more in demand because of their high energy efficiency and zero-emission profile.
The Fuel Cell Electric Vehicles (FCEVs) segment, however, is expected to expand at the fastest pace, with a CAGR of 25.17% over the forecast period of 2024-2032. This growth is based on hydrogen fuel cell technology advancement, offering longer ranges and quicker refuelling times, making FCEVs appropriate for heavy-duty and long-haul applications. Governments are heavily investing in hydrogen infrastructure, particularly in Asia-Pacific and Europe.
Meanwhile, PHEVs are a transitional technology that bridges the gap between an internal combustion engine and a fully electrified vehicle in regions with limited charging infrastructure.
BY POWER OUTPUT
In 2023, less than 150 kW segment led the market with 53% of the market share. This is because they are mostly suitable for light-duty and last-mile delivery applications, which are rapidly emerging in urban environments. It is highly favoured for its lower energy needs and affordability.
However, the fastest growth is anticipated in the 150−250 kW segment with a CAGR of 25.28% between 2024 and 2032. Vehicles in this category are increasingly adopted for medium-duty applications-including inter-city transportation and urban freight. The higher torque and efficiency offered by this power range cater to a larger commercial demand. This 250 kW segment, although smaller, is more significant for heavy-duty applications such as long-haul trucking and industrial use, and is expected to be growing steadily with advancements in battery and motor technologies.
BY BATTERY TYPE
The Electric Commercial Vehicle Market by battery type is highly driven by the adoption of lithium-ion battery technologies. In 2023, LFP (Lithium Iron Phosphate) batteries were the most adopted, which held a market share of 43.59% in the market, because of the affordability, safety, and long lifecycle. Excellent thermal stability and cost-effectiveness explain why these batteries enjoy prominence, particularly in medium and heavy-duty electric commercial vehicles intended for short-range operations. For NMC (Nickel Manganese Cobalt), this is not the same story; its higher energy density accounts for its popularity because those require extended ranges, be it electric buses or trucks running long hauls.
Solid-state batteries, though still at an emerging stage, will revolutionize the market by growing at a CAGR of 30.52% from 2024 to 2032. Being superior in energy density and faster charging capabilities than their liquid electrolyte-based counterparts, they ensure better safety profiles. In particular, for vehicles demanding higher ranges and efficiency, they are a game-changer. Other battery types, such as advanced lead-acid and hybrid variants, have niche roles, but their market share is likely to decline as lithium-ion and solid-state technologies become the norm. The overall transition is driven by increasing government incentives for EV adoption, tightening emission standards, and improvement in the production of batteries.
BY RANGE
In 2023, the Less than 150 Miles range segment led the market with 48.61% of the market share. This range of vehicles is used mostly for last-mile delivery and urban logistics where a lesser range would suffice. The same is economical in terms of the size of the battery pack, and it can enjoy better charging infrastructure within urban limits.
The 151-300 Miles range segment will register the fastest growth as a CAGR of 25.52% is likely over the forecast period from 2024 to 2032. This increase can be ascribed due to the ever-growing demand for mid-range electric commercial vehicles for use in regional logistics and distribution services. Advancements enabling the achievement of higher energy densities in batteries and improvement in charging speed are very significant enablers to be considered in this regard.
REGIONAL ANALYSIS
The regional analysis of the Electric Commercial Vehicle market shows that Asia Pacific region has emerged as the leading region in 2023, capturing 43% of the market share. This leadership is being driven by China, which has made widespread adoption of electric buses and trucks while having considerable government incentives and strong manufacturing capabilities. India and Japan are also helping with initiatives to electrify public transport and logistics.
North America region is expected to have the greatest growth rate at a CAGR of 25.41% during the forecast period of 2024-2032. This growth is supported by investments in charging infrastructure, tight emission standards, and growing adoption of electric delivery trucks by the biggest logistics companies. Europe remains the key player, especially with zero-emission targets till 2025, which are stricter for city buses and urban freight.
KEY PLAYERS
Some of the major players in the Electric Commercial Vehicle Market are
-
Tesla, Inc. (Tesla Semi, Cybertruck)
-
BYD Company (BYD T9, BYD K9)
-
Proterra, Inc. (ZX5 Electric Bus, Battery Systems)
-
Daimler AG (Freightliner eCascadia, Mercedes-Benz eActros)
-
Volvo Trucks (Volvo FL Electric, Volvo FE Electric)
-
Nikola Corporation (Nikola Tre, Nikola Two)
-
Rivian Automotive (R1T Pickup, Amazon Delivery Van)
-
GreenPower Motor Company (EV Star, EV550)
-
Lion Electric Company (Lion6, LionC)
-
Workhorse Group (C1000 Delivery Van, HorseFly Drone)
-
Ashok Leyland (Circuit S, iBUS)
-
Tata Motors (Tata Ultra T.7, Starbus Electric)
-
Hyundai Motor Company (Hyundai Xcient, Elec City Bus)
-
General Motors (BrightDrop) (Zevo 600, BrightDrop Core)
-
Mitsubishi Fuso (eCanter, Vision F-Cell)
-
Ford Motor Company (E-Transit, Lightning Pro)
-
Isuzu Motors (Isuzu ELF EV, N-Series Electric)
-
Hino Motors (Hino Dutro Z EV, Hino Poncho EV)
-
PACCAR Inc. (Kenworth T680E, Peterbilt 220EV)
-
Blue Arc EV Solutions (Step Van, EV Chassis Cab)
MAJOR SUPPLIERS (Components, Technologies)
-
Panasonic Corporation (EV Batteries, Battery Management Systems)
-
LG Energy Solution (Battery Packs, Modules)
-
Samsung SDI (Lithium-ion Batteries)
-
Bosch (Electric Motors, Inverters)
-
Continental AG (Powertrain Components, DC-DC Converters)
-
Dana Incorporated (E-Axles, Gearboxes)
-
Magna International (Drivetrains, Battery Enclosures)
-
Delphi Technologies (Power Electronics, Charging Systems)
-
ZF Friedrichshafen AG (E-Mobility Solutions, Inverters)
-
AVL List GmbH (Powertrains, Fuel-cell Systems)
Tesla (US)-Company Financial Analysis
RECENT TRENDS
May 2024: BYD had recently launched the Sealion 07 EV in Norway after launching the electric SUV (sport utility vehicle) model in other European markets a few weeks ago. BYD has branded the product under the name Sealion 7 in Norway, in common with other European regions.
November 2024: Daimler Truck North America (DTNA) has collaborated with Proterra to power next-generation electric school buses and last-mile delivery vehicles. In the partnership, Proterra's battery technology will be incorporated into Thomas Built Buses' all-electric Saf-T-Liner C2 Jouley school bus and Freightliner Custom Chassis Corporation's (FCCC) all-electric MT50e delivery truck.
| Report Attributes | Details |
|---|---|
| Market Size in 2023 | US$ 71.51 Billion |
| Market Size by 2032 | US$ 521.92 Billion |
| CAGR | CAGR of 24.74% From 2024 to 2032 |
| Base Year | 2023 |
| Forecast Period | 2024-2032 |
| Historical Data | 2020-2022 |
| Report Scope & Coverage | Market Size, Segments Analysis, Competitive Landscape, Regional Analysis, DROC & SWOT Analysis, Forecast Outlook |
| Key Segments | • By Vehicle Type (Pickup Trucks, Trucks (Medium and Heavy-duty Trucks), Vans (Light Vans and Full-size Vans), Buses & Coaches), • By Propulsion (BEV, FCEV, PHEV), • By Battery Type (LFP Batteries, NMC Batteries, Solid-state Batteries, Others), • By Battery Capacity(Less Than 60 KWH, 60–120 KWH, 121–200 KWH, 201–300 KWH, 301−500 kWh, 501−1,000 kWh), • By Power Output (Less than 150 kW, 150−250 kW, Above 250 kW), • By Range (Less than 150 Miles, 151−300 Miles, Above 300 Miles), • By End Use (Last-mile Delivery, Field Services, Distribution Services, Long-haul Transportation, Refuse Trucks), • By Construction (Integrated, Semi-integrated, Full-sized), • By Component (Battery Packs, Onboard Chargers, Electric Motors, Inverters, DC-DC Converters, E-Axels (Including Gearboxes), Fuel-cell Stacks) |
| Regional Analysis/Coverage | North America (US, Canada, Mexico), Europe (Eastern Europe [Poland, Romania, Hungary, Turkey, Rest of Eastern Europe] Western Europe] Germany, France, UK, Italy, Spain, Netherlands, Switzerland, Austria, Rest of Western Europe]), Asia Pacific (China, India, Japan, South Korea, Vietnam, Singapore, Australia, Rest of Asia Pacific), Middle East & Africa (Middle East [UAE, Egypt, Saudi Arabia, Qatar, Rest of Middle East], Africa [Nigeria, South Africa, Rest of Africa], Latin America (Brazil, Argentina, Colombia, Rest of Latin America) |
| Company Profiles | Tesla, BYD, Proterra, Daimler, Volvo Trucks, Nikola, Rivian, GreenPower, Lion Electric, Workhorse, Ashok Leyland, Tata Motors, Hyundai, GM (BrightDrop), Mitsubishi Fuso, Ford, Isuzu, Hino, PACCAR, Blue Arc EV Solutions. |
| Key Drivers | • Governments worldwide are incentivizing electric vehicle adoption through subsidies, tax breaks, and regulations. • Steadily climbing environmental awareness, which is driving the shift toward zero-emission commercial vehicles globally. |
| Restraints | • The high upfront cost of ECVs is one of the major barriers to adoption. |
Frequently Asked Questions
Ans: The Electric Commercial Vehicle Market is expected to grow at a CAGR of 24.74% during 2024-2032.
Ans: The Electric Commercial Vehicle Market size was USD 71.51 billion in 2023 and is expected to Reach USD 521.92 billion by 2032.
Ans: The major growth factor of the Electric Commercial Vehicle Market is Steadily Climbing Environmental Awareness.
Ans: The Battery Electric Vehicles (BEVs) dominated the Electric Commercial Vehicle Market.
Ans: Asia Pacific dominated the Electric Commercial Vehicle Market in 2023.
Get in Touch
