AI in Blood Pressure Monitoring Market Report Scope & Overview:
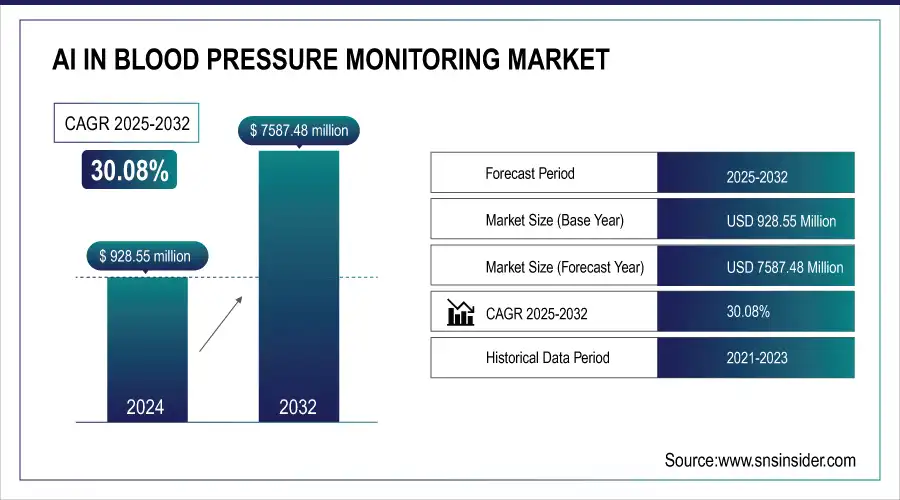
The AI in blood pressure monitoring market size was valued at USD 928.55 million in 2024 and is expected to reach USD 7587.48 million by 2032, growing at a CAGR of 30.08% over the forecast period of 2025-2032.
To Get more information On AI in Blood Pressure Monitoring Market - Request Free Sample Report
This rising prevalence of hypertension is directly raising the number of product launches along with the demand for remote patient monitoring, aiding the global AI in blood pressure monitoring market growth. Implementation of AI enhances accuracy in diagnostics, enables real-time monitoring, and assists in the early identification of cardiovascular hazards. The growth and adoption of cuffless and on-device solutions, paired with the approval of digital health by regulatory agencies, are some of the factors used to project the market growth in AI in blood pressure monitoring. The growing awareness of consumers, coupled with the trend towards digitization in healthcare, is also pushing the market for AI-based blood pressure measurement devices to grow rapidly.
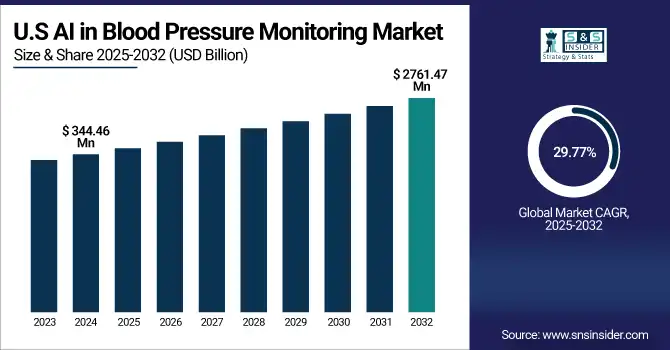
The U.S. AI in blood pressure monitoring market size was valued at USD 344.46 million in 2024 and is expected to reach USD 2761.47 million by 2032, growing at a CAGR of 29.77% over the forecast period of 2025-2032.
The U.S. is the leading country in the AI in blood pressure monitoring market in North America, with the largest market share in 2024. This dominance is due to a well-established healthcare system, a high incidence of hypertension, and supportive reimbursement systems. Moreover, the adoption of AI-enabled blood pressure monitoring in both the clinical and home care settings is also expected to propel the market growth due to the increased acceptance of AI technologies in digital healthcare, as the U.S. leads the way in the adoption with immense investments in wearable technologies and remote patient monitoring platforms.
Market Dynamics:
Drivers
-
Surge in Usage of Wearable and Cuffless Monitoring Devices is Driving the Market
The market is rapidly expanding among consumers who seek convenience, continuous monitoring, and instant health information. Now these devices, powered by AI, can monitor blood pressure without using traditional cuffs. By utilizing optical sensors and machine learning algorithms, they compute blood pressure through readings such as pulse wave velocity or PPG (photoplethysmography). Due to their simplicity, portability, and ability to monitor multiple aspects of health, they are commonly used for the daily measurement of health parameters, particularly for preventive health control and chronic disease monitoring.
A research team at the Korea Advanced Institute of Science and Technology (KAIST), in collaboration with other scientists, has developed a new artificial intelligence (AI)-based platform for wearable, cuffless blood pressure monitors that combine flexible electronics and machine learning to enable continuous and non-invasive blood pressure monitoring, rapidly enhancing their competitiveness for the medical-grade application soon.
Nanjing University researchers reviewed the latest advances in cuffless BP wearable monitoring (Nanjing Univ., c/o Wei ChenAug, 2024). They noted that, while validation is needed before they enter clinical use, flexible electronics and AI have made accurate, real-time health monitoring in comfort.
-
The Rapid Advancements in AI and Sensor Technologies are Driving Significant Growth in the Market.
Recent developments in artificial intelligence and biosensor technology have significantly improved the precision and capabilities of blood pressure monitoring devices. Advanced AI algorithms are employed to interpret multifaceted physiological data in real-time, offering accurate blood pressure measurements and early warning alerts for any irregularities. The reduction in size, power, and boost of performance, including sensitivity, is paving the way for the miniaturization of sensors to be housed in portable wearables. These innovations enhance the reliability of diagnosis and ease long-term monitoring and trending for both consumers and clinicians, rendering AI-based devices highly effective and scalable.
With the ability to filter noise and movement artifacts, AI-powered wearables have increased the accuracy of health metrics, including blood pressure and heart rate, by more than 20% and brought them closer to clinical-grade performance.
Restraint
-
The Need for Clinical Validation & Standardization is hindering the Market Growth
Issue of clinical validation and lack of standardization for AI-driven devices. Although most of these novel wearable and cuffless approaches employ sophisticated sensor technologies and advanced algorithms, they have not been subjected to the stringent clinical trials required to confirm their accuracy against usual cuff-based sphygmomanometers. In the absence of a universally accepted validation protocol, it is difficult to compare results from different devices or to trust readings from these devices in life-critical health care contexts. This caution has caused many healthcare professionals to retreat from using these technologies for diagnostic or treatment purposes, delaying the incorporation of these systems into everyday care.
Segmentation Analysis:
By Device Type
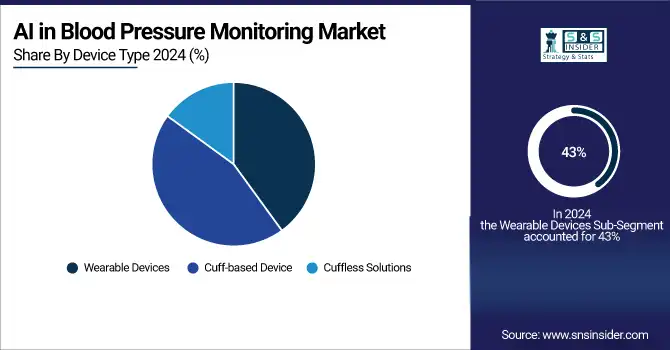
The wearable devices segment dominated the AI in blood pressure monitoring market share with a 43% in 2024. This data primarily relates to the increased need for continuous, real-time monitoring of health conditions and the rise of smartwatches and fitness trackers for health. Many brands, such as Fitbit, Samsung, and Apple, are now launching AI-based features in the form of devices that promote ease-of-use, portability, interaction with the user, and home-based clinical diagnostics.
The cuffless solutions segment is projected to be the fastest-growing in the forecast period. Increasing AI algorithms, sensor technology, and effortless designs continue to fuel this growth. Ditching the on-cuff blood pressure measurement that feels cumbersome and is not easily accessible for tracking blood pressure levels regularly. Growing demand for non-invasive, on-demand monitoring, particularly among older and tech-savvy adults, and increasing clinical validation of cuffless, AI-based technologies in hypertension management will fuel adoption in home care and remote health applications.
By Technology
The machine learning algorithms segment led the AI in blood pressure monitoring market in 2024 with 54.28% market share as a result of its proven track record to increase diagnostic accuracy and predictive insights. The algorithms process large datasets for recognizing patterns of blood pressure fluctuations, allowing for more accurate readings and early identification of hypertension-related risks. Their broad incorporation in wearable and medical-grade devices by top manufacturers has established them as the backbone for the majority of AI-powered monitoring systems.
The computer vision techniques segment is expected to grow at the highest rate in the forecast period, driven by growing requirements for contactless and camera-based blood pressure measurement techniques. These methods employ visual signals—facial blood flow or small skin color changes—to make an estimate of blood pressure, providing a non-invasive and convenient option. The increasing demand for telemedicine, smartphone diagnostics, and home care solutions has driven R&D for computer vision-based healthcare tools. With ongoing validation studies and regulatory encouragement, these computer vision-based technologies will soon redefine blood pressure monitoring in clinical and consumer settings.
By Delivery Mode
The on-device AI segment accounted for the largest share in the AI in blood pressure monitoring market in 2024, with a 41.5% market share, due to its capacity to provide immediate analysis, greater privacy, and less reliance on internet connectivity. The systems permit instant blood pressure measurements and health information right from wearable or portable devices, thus suitable for clinical use and for personal monitoring. The extensive use of AI chips in medical wearables and smartwatches continued to sustain the dominance of the segment, facilitating continuous tracking and real-time feedback without the need for cloud processing.
By Application
In 2024, the hypertension management segment led the AI in blood pressure monitoring market share with a 38.6%, owing to the global increase in hypertension cases and the increasing demand for precise, ongoing monitoring to avoid complications such as stroke and cardiovascular disease. AI devices provide enhanced blood pressure monitoring, trend analysis, and customized alerts, which make them extremely effective in managing chronic diseases. Healthcare professionals and patients are embracing these tools to help with long-term treatment plans, medication management, and early detection, which is fueling the extensive use of AI solutions in blood pressure management.
The remote patient monitoring (RPM) segment is expected to exhibit the highest growth rate during the years of forecast period, fueled by the rising need for home-based care and chronic disease management. AI-powered RPM facilitates continuous monitoring, predictive notification, and tailored interventions without the need for regular on-site visits. This is especially useful in elderly populations and rural communities with poor healthcare access. Government policies, increasing telehealth penetration, and insurance coverage of remote monitoring services are driving the adoption of AI-based BP devices, and RPM is a fast-growing application segment in the market.
By End Use
The hospitals & acute care segment held the largest share of the AI in blood pressure monitoring market in 2024, with 48.15% market share, as a result of the growing adoption of AI technologies into clinical workflows for improved patient monitoring, diagnosis, and decision support. Hospitals depend on AI-driven blood pressure monitors with high accuracy to treat patients with cardiovascular complications and critical conditions. These machines reduce human error, accelerate response time, and allow for early detection of abnormalities. Also, the presence of advanced infrastructure, technical specialists, and investment in smart healthcare technologies favors the widespread use of AI solutions in hospital environments.
The home care settings/patient (consumers) segment is likely to witness the fastest growth over the forecast period due to the increasing demand for personal and convenient monitoring of health. The growing popularity of wearable, AI-based devices gives individuals the power to monitor their blood pressure in real-time without attending clinics. This trend is being driven by rising awareness of preventive healthcare, aging demographics, and growth in telehealth services.
Regional Analysis:
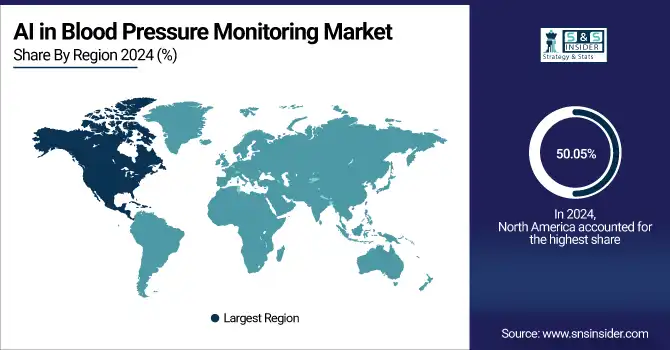
In 2024, North America dominated the AI in blood pressure monitoring market share with a 50.05%, due to its highly developed healthcare infrastructure, early adoption of digital health technology, and high presence of key players across the region. Hugely expensive healthcare, an enormous hypertensive population, and a favorable regulatory environment, where AI-based medical devices get approved and implemented faster, make the region ripe for a converged solution. In addition, factors such as remote patient monitoring, the use of AI in chronic disease management in hospital and home care settings are likely to bolster the dominance of North America in this market.
Get Customized Report as per Your Business Requirement - Enquiry Now
The rapid digitization of healthcare, coupled with rising preventive care awareness, increasing middle-class population in the region, is expected to drive demand growth during the forecast period for blood pressure monitor-based artificial intelligence, and is expected to be the fastest growing AI in the blood pressure monitoring market at 31.26% CAGR in Asia Pacific.
Investment to address the growing hypertension and cardiovascular disease burden is being led by China, India, and Japan in AI and wearable health technologies. The burgeoning penetration of smartphones and smartwatches across the region, along with governmental support for health initiatives and telemedicine initiatives, is driving the unprecedented adoption of standalone AI-based blood pressure monitoring solutions among rural and urban populations.
In a Japan-led study, the researchers demonstrated a computer vision–enabled contactless tool that detected stage 1 hypertension with a significant accuracy (94%) using video analysis [23], emphasizing the potential of advanced AI on BP monitoring along with sensor fusion.
The AI in blood pressure monitoring market trends in Europe have been witnessing significant growth owing to the rising adoption of digital health technologies and the integration of AI across healthcare systems. The growing prevalence of cardiovascular disorders and chronic disease management in the region along with preventive care, particularly in countries such as India and China, coupled with the integration of blood pressure monitors with applications that track data in a patient-centered way as per treatment progress is anticipated to boost the demand for smart blood pressure monitoring solutions. The implementation of AI-based monitoring devices is further boosted by the stringent regulatory policies, the growing telehealth care provisions, along with the increasing elderly population in some European countries, such as Germany, the UK, and France.
The AI in blood pressure monitoring market analysis in Latin America and the Middle East & Africa (MEA) is moderate. Adoption of digital health technologies is slowly gaining traction in Latin America, with greater interest in smart and cuffless blood pressure monitoring technologies, particularly wearables targeting the wrist and finger. The MEA region is witnessing robust growth across clinical and consumer segments with increased healthcare investments, expanding telehealth services, and companion digital health initiatives, especially in Saudi Arabia and the UAE.
Key Market Players
AI in blood pressure monitoring market companies are Omron Healthcare, Fitbit (Google), Samsung Electronics, Apple Inc., Biobeat Technologies, Withings, Microlife Corporation, Spacelabs Healthcare, A&D Medical, SunTech Medical, and other players.
Recent Developments
-
May 2025 – Omron Healthcare has launched a new series of home blood pressure monitors with integrated artificial intelligence (AI) for the detection of atrial fibrillation (AF). With the company's own Intellisense AFib algorithm, based on machine learning, these monitors automatically screen for AF with every blood pressure measurement.
-
In May 2023, Google-owned Fitbit submitted a patent for a small blood pressure monitoring system that is to be integrated into its smartwatches. It utilizes a pressure-sensitive screen (force sensor) and a photoplethysmography (PPG) sensor to estimate systolic and diastolic measurements.
| Report Attributes | Details |
|---|---|
| Market Size in 2024 | USD 928.55 million |
| Market Size by 2032 | USD 7587.48 million |
| CAGR | CAGR of 30.08% From 2025 to 2032 |
| Base Year | 2024 |
| Forecast Period | 2025-2032 |
| Historical Data | 2021-2023 |
| Report Scope & Coverage | Market Size, Segments Analysis, Competitive Landscape, Regional Analysis, DROC & SWOT Analysis, Forecast Outlook |
| Key Segments | • By Device Type (Wearable Devices, Cuff-based Devices, Cuffless Solutions) • By Technology (Machine Learning Algorithms, Natural Language Processing (NLP), Computer Vision Techniques) • By Delivery Mode (On-Device AI, Cloud-based AI, Hybrid AI) • By Application (Hypertension Management, Cardiovascular Disease Prediction, Remote Patient Monitoring, Fitness and Wellness, Others) • By End Use (Hospitals & Acute Care, Home Care Settings/Patient (Consumers), Clinics & Ambulatory Care, Others) |
| Regional Analysis/Coverage | North America (US, Canada, Mexico), Europe (Germany, France, UK, Italy, Spain, Poland, Turkey, Rest of Europe), Asia Pacific (China, India, Japan, South Korea, Singapore, Australia, Rest of Asia Pacific), Middle East & Africa (UAE, Saudi Arabia, Qatar, South Africa, Rest of Middle East & Africa), Latin America (Brazil, Argentina, Rest of Latin America) |
| Company Profiles | Omron Healthcare, Fitbit (Google), Samsung Electronics, Apple Inc., Biobeat Technologies, Withings, Microlife Corporation, Spacelabs Healthcare, A&D Medical, SunTech Medical, and other players. |
Frequently Asked Questions
North America dominated the AI in Blood Pressure Monitoring Market in 2024.
Omron Healthcare, Fitbit (Google), Samsung Electronics, Apple Inc., Biobeat Technologies, Withings, Microlife Corporation, Spacelabs Healthcare, A&D Medical, SunTech Medical, and other players.
Increasing use of wearable and cuffless monitoring devices is impelling the market growth.
The AI in Blood Pressure Monitoring Market was USD 928.55 million in 2024 and is expected to reach USD 7587.48 million by 2032.
The AI in Blood Pressure Monitoring Market is expected to grow at a CAGR of 30.08% from 2025 to 2032.
Get in Touch
