AI-Powered Audience Engagement Heat Index Market Report Scope & Overview:

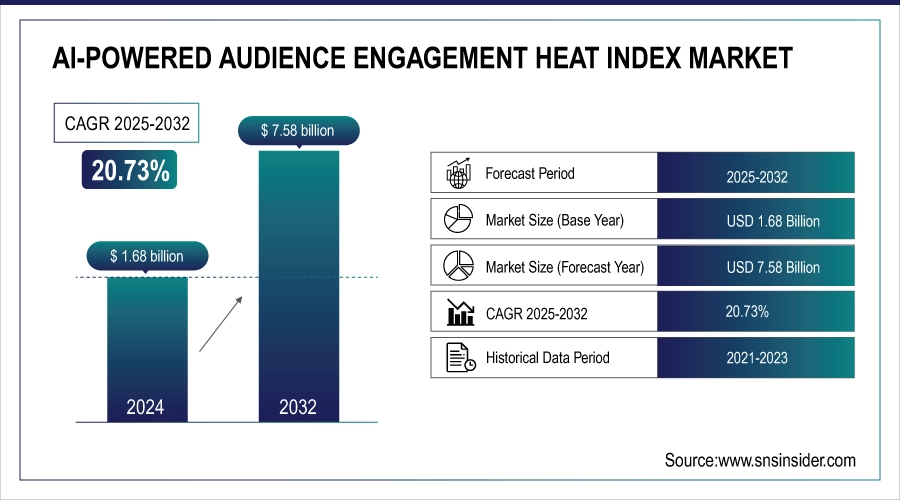
The AI-Powered Audience Engagement Heat Index Market Size was valued at USD 1.68 billion in 2024 and is expected to reach USD 7.58 billion by 2032 and grow at a CAGR of 20.73% over the forecast period 2025-2032.

The AI-Powered Audience Engagement Heat Index Market is centered on solutions that use AI to measure and optimize audience engagement in real time. Advanced machine learning and natural language processing allow businesses to interpret audience behavior and preferences, transforming data into actionable insights. Organizations across broadcasting, digital marketing, events, and e-commerce are adopting these technologies to deliver personalized experiences, enhance content strategies, and drive higher engagement.

Key AI-Powered Audience Engagement Heat Index Market Trends:

  • Growing adoption of AI-driven tools is enabling real-time analysis of audience behavior and engagement patterns.

  • Increasing demand for personalized and hyper-targeted content is driving the use of AI-powered audience insights.

  • Integration of predictive analytics is helping businesses forecast audience preferences and optimize engagement strategies.

  • Cross-platform and multi-channel engagement solutions are becoming essential for consistent audience interaction.

  • Advances in immersive technologies like AR, VR, and XR are enhancing interactive and engaging experiences.

  • Real-time content optimization is improving relevance, engagement rates, and overall audience satisfaction.

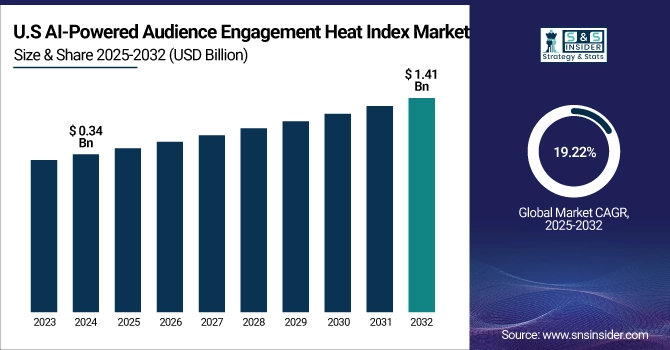
The U.S. AI-Powered Audience Engagement Heat Index Market size was USD 0.34 billion in 2024 and is expected to reach USD 1.41 billion by 2032, growing at a CAGR of 19.22% over the forecast period of 2024–2032. The growth is driven by rising demand for real-time audience insights, personalized content experiences, and data-driven engagement strategies. Increasing adoption of AI, machine learning, and predictive analytics is enabling businesses to optimize content delivery, enhance audience interaction, and improve engagement across broadcasting, digital marketing, events, and e-commerce platforms.

The U.S. Market is witnessing rapid growth, driven by the increasing need for real-time audience insights and personalized engagement strategies. Businesses are leveraging AI, machine learning, and predictive analytics to analyze audience behavior, forecast preferences, and optimize content delivery. Cross-platform integration and multi-channel strategies are becoming essential to maintain consistent audience interaction. Additionally, immersive technologies like AR, VR, and XR are enhancing engagement through interactive experiences. Real-time content optimization, hyper-personalization, and data-driven decision-making are key trends shaping the market, enabling organizations to improve engagement, retention, and overall audience satisfaction.

AI-Powered Audience Engagement Heat Index Market Growth Drivers:

  • Rising Adoption of AI-Driven Personalization and Predictive Analytics Drives Global AI-Powered Audience Engagement Heat Index Market Expansion

The market is driven by the increasing use of AI and predictive analytics to deliver real-time, personalized audience experiences. This cause, growing demand for actionable insights and tailored content, effects enhanced engagement, retention, and satisfaction across digital platforms. Businesses are leveraging AI to monitor audience behavior, forecast preferences, and optimize messaging strategies. As a result, organizations can improve content performance, boost customer loyalty, and maximize return on investment in marketing and broadcasting initiatives.

In March 2025, a major streaming platform implemented an AI-powered audience heat index tool to track viewer interactions in real time, resulting in a significant increase in engagement, reflecting the impact of AI personalization on content effectiveness.

AI-Powered Audience Engagement Heat Index Market Growth Restraints:

  • Data Privacy Concerns and Regulatory Compliance Limit Global AI-Powered Audience Engagement Heat Index Market Adoption

The market faces restraints due to increasing concerns around data privacy and stricter regulatory frameworks across regions. This cause, stricter compliance requirements, effects higher operational costs, limited data access, and slower technology adoption. Organizations must implement robust security measures to protect sensitive audience data, which can hinder the rapid deployment of AI-driven engagement solutions. Additionally, consumer apprehension over misuse of personal data can reduce trust and adoption rates.

In mid-2024, a survey of digital marketers revealed that significant percentage delayed implementing AI audience analytics due to concerns about data compliance, highlighting privacy as a critical market barrier.

AI-Powered Audience Engagement Heat Index Market Growth Opportunities:

  • Integration of Multi-Channel Engagement Platforms Creates New Global Market Expansion Opportunities

The market presents opportunities as organizations adopt AI-powered tools across multiple channels to ensure consistent and interactive audience engagement. This cause, increasing demand for seamless cross-platform experiences, effects higher engagement, deeper customer insights, and optimized content strategies. AI enables the aggregation of audience data from social media, websites, streaming services, and live events, providing actionable analytics for marketing and content teams.

In February 2025, a leading media company launched a multi-channel AI audience engagement platform integrating social media, live streaming, and website analytics, exemplifying how cross-platform AI solutions drive strategic opportunities.

Key AI-Powered Audience Engagement Heat Index Market Segment Highlights:

  • By Component, Software led with ~42% share in 2024; Services fastest growing at CAGR 21.74%.

  • By Application, Marketing and Advertising led with ~29% share in 2024; Sports and Events fastest growing at CAGR 24.62%.

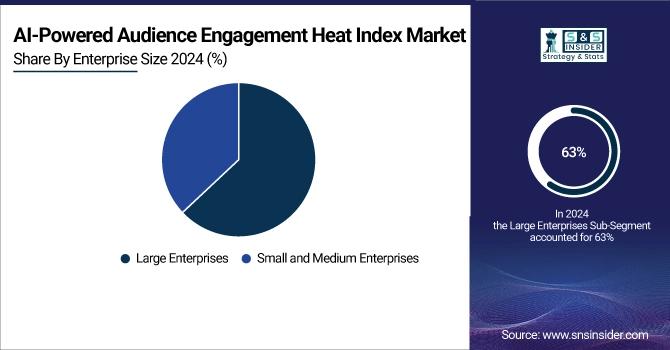
  • By Enterprise Size, Large Enterprises led with ~63% share in 2024; Small and Medium Enterprises fastest growing at CAGR 21.66%.

  • By End-User, Digital Platforms led with ~29% share in 2024; Event Management fastest growing at CAGR 23.78%.

Key AI-Powered Audience Engagement Heat Index Market Segment Analysis:

  • By Component, Software Leads Market While Services Register Fastest Growth

The Software segment dominates the AI-Powered Audience Engagement Heat Index Market, driven by widespread adoption of AI analytics platforms, machine learning algorithms, and real-time reporting tools that enable personalized content and audience targeting. Continuous product development in predictive modeling, dashboards, and NLP features improves efficiency, accuracy, and user engagement, strengthening market revenue. The Services segment is growing fastest as organizations increasingly rely on consulting, implementation, and managed AI services to deploy and optimize engagement platforms. Professional services ensure seamless integration, customized strategies, and ongoing support, boosting adoption across industries.

  • By Application, Marketing and Advertising Leads Market While Sports and Events Register Fastest Growth

Marketing and Advertising dominates the market, fueled by demand for data-driven audience insights, targeted campaigns, and ROI optimization. AI-powered analytics platforms enable precise segmentation, real-time content optimization, and predictive engagement, enhancing campaign effectiveness and customer retention. Sports and Events is the fastest-growing segment, driven by the rising need for live engagement analytics, fan experience enhancement, and interactive broadcasting. Advanced heat index solutions allow event organizers to track audience reactions, optimize content delivery, and improve overall engagement, supporting growth in entertainment and sporting industries worldwide.

  • By Enterprise Size, Large Enterprises Lead Market While Small and Medium Enterprises Register Fastest Growth

Large Enterprises dominate the market due to their extensive digital operations, higher budgets for AI adoption, and need for enterprise-scale audience engagement solutions. Centralized platforms, robust analytics, and predictive insights enable large organizations to enhance content strategy, drive engagement, and maintain competitive advantage. Small and Medium Enterprises are growing fastest as cost-effective, scalable AI solutions become accessible, allowing SMEs to leverage real-time audience analytics, personalized marketing, and engagement optimization. Flexible subscription models and managed services enable smaller companies to deploy advanced tools efficiently, expanding market penetration.

  • By End-User, Digital Platforms Lead Market While Event Management Registers Fastest Growth

Digital Platforms dominate revenue, driven by their reliance on AI-powered engagement solutions to monitor user behavior, optimize content, and deliver personalized experiences at scale. Software innovations in real-time analytics and predictive modeling enhance platform performance, audience retention, and monetization. Event Management is the fastest-growing segment, fueled by demand for interactive, data-driven experiences, and live engagement tracking. AI heat index solutions allow organizers to measure audience reactions, tailor event content, and maximize attendee satisfaction, driving adoption and expanding opportunities across conferences, concerts, and sports events globally.

AI-Powered Audience Engagement Heat Index Market Regional Analysis:

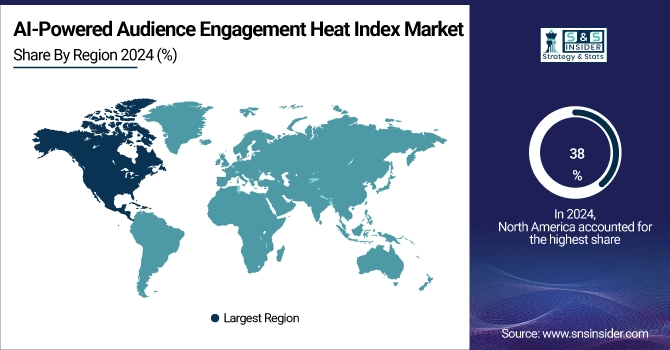
  • North America AI-Powered Audience Engagement Heat Index Market Insights

In 2024, North America dominates the AI-Powered Audience Engagement Heat Index Market with an estimated share of ~38%, driven by advanced digital infrastructure, widespread adoption of AI-powered analytics, and high investments in audience engagement solutions. Businesses leverage real-time heat index tools, predictive analytics, and personalized content strategies, effecting higher engagement and retention. Continuous product development in machine learning algorithms, dashboards, and NLP features further strengthens market deployment across marketing, broadcasting, sports, and entertainment industries.

  • United States Leads AI-Powered Audience Engagement Heat Index Market in North America

The U.S. dominates with the largest market share, supported by strong AI adoption, extensive digital marketing activities, and advanced technological infrastructure. Continuous innovation in predictive analytics, real-time content optimization, and AI-powered dashboards improves audience insights and engagement effectiveness. Enterprises across various sectors, including media, e-commerce, and live events, benefit from enhanced personalization, performance tracking, and ROI optimization, reinforcing the U.S. leadership position within North America.

  • Asia Pacific AI-Powered Audience Engagement Heat Index Market Insights

Asia Pacific is the fastest-growing region with an estimated CAGR of ~22.5% in 2024, driven by rising digital adoption, expanding internet penetration, and increasing demand for personalized and interactive audience experiences. Businesses and digital platforms are increasingly implementing AI-powered engagement tools, effecting better content targeting, predictive analytics, and real-time audience insights. Product development in mobile-friendly AI platforms, cloud-based analytics, and multi-channel integration supports rapid market expansion.

  • Japan Leads AI-Powered Audience Engagement Heat Index Market Growth in Asia Pacific

Japan dominates the regional market due to high technological adoption, digital innovation culture, and increasing demand for real-time audience analytics in broadcasting, sports, and marketing sectors. Providers are introducing AI-driven dashboards, predictive engagement models, and immersive experience analytics, enhancing content delivery and audience interaction. These innovations position Japan as a key driver of market growth in Asia Pacific, supporting widespread adoption of AI-powered engagement solutions.

  • Europe AI-Powered Audience Engagement Heat Index Market Insights

In 2024, Europe holds a significant share in the AI-Powered Audience Engagement Heat Index Market, driven by increasing adoption of AI analytics, digital marketing expansion, and focus on personalized customer engagement. Continuous product development in predictive models, NLP-based insights, and multi-channel integration supports steady regional growth.

  • Germany Dominates Europe’s AI-Powered Audience Engagement Heat Index Market

Germany leads the European market due to strong digital infrastructure, widespread AI adoption, and focus on marketing and broadcasting efficiency. Companies leverage AI-driven dashboards, audience segmentation, and real-time analytics to enhance engagement and campaign performance. Germany’s emphasis on technological innovation and data-driven content strategies reinforces its leadership position within Europe.

  • Latin America and Middle East & Africa AI-Powered Audience Engagement Heat Index Market Insights

The market in Latin America and MEA is witnessing steady growth, driven by rising digital adoption, expanding online platforms, and growing demand for personalized audience engagement. Businesses are increasingly deploying AI-powered solutions for content optimization, predictive analytics, and real-time interaction, effecting improved engagement and campaign effectiveness. Product development in scalable, cloud-based AI tools enhances accessibility and regional adoption.

  • Regional Leaders in Latin America and MEA

Brazil leads Latin America due to increasing digital platform usage, online marketing expansion, and adoption of AI-powered engagement tools. In MEA, the UAE dominates, supported by growing digital media investments, technology-driven event management, and focus on immersive audience experiences, reinforcing regional market leadership.

Competitive Landscape for the AI-Powered Audience Engagement Heat Index Market:

IBM is a global technology leader headquartered in Armonk, New York, with a presence in over 170 countries. Founded in 1911, IBM has evolved from a hardware-centric company to a leader in software, cloud computing, and artificial intelligence (AI). The company offers a range of products and services, including hybrid cloud solutions, AI-driven analytics, and enterprise software. IBM's AI platform, Watson, is renowned for its capabilities in natural language processing and machine learning. In the AI-Powered Audience Engagement Heat Index market, IBM's AI solutions enable businesses to deliver personalized and dynamic content experiences, particularly in sectors like sports and entertainment.

  • August 18, 2025, IBM's global research indicates that sports fans are increasingly seeking dynamic digital content experiences, with AI, personalization, and real-time features becoming central to their engagement with sports.

Microsoft is a multinational technology company based in Redmond, Washington, founded in 1975. Known for its software products like Windows and Office, Microsoft has expanded into cloud computing, AI, and enterprise services. The company's Azure cloud platform and AI tools, such as Azure AI and Dynamics 365, provide businesses with scalable solutions for data analytics and customer engagement. In the AI-Powered Audience Engagement Heat Index market, Microsoft's AI capabilities support personalized marketing, customer insights, and automation across various industries. The company's investments in AI research and development continue to drive innovation in audience engagement strategies.

  • August 6, 2025, Microsoft Advertising's research highlights the rise of conversational AI, with 73% of marketers planning to increase investments in conversational commerce by up to 50% over the next two years.

Google, a subsidiary of Alphabet Inc., is a global technology company specializing in internet-related services and products, including online advertising technologies, a search engine, cloud computing, software, and hardware. Founded in 1998, Google has become a dominant force in the digital landscape. In the AI-Powered Audience Engagement Heat Index market, Google's AI and machine learning technologies play a crucial role in enhancing user experiences through personalized content delivery and targeted advertising. The company's advancements in AI contribute to more effective audience engagement strategies across various platforms.

  • May 22, 2024, Google announced plans to test ads within its new AI-powered search results, integrating sponsored content into AI Overviews, a move that has raised concerns among news publishers about potential impacts on site traffic and ad revenue.

Salesforce is a cloud-based software company headquartered in San Francisco, California, founded in 1999. The company provides customer relationship management (CRM) solutions and a suite of enterprise applications focused on sales, customer service, marketing automation, analytics, and application development. Salesforce's AI-powered tools, such as Einstein AI, enable businesses to automate processes, gain insights from data, and deliver personalized customer experiences. In the AI-Powered Audience Engagement Heat Index market, Salesforce's solutions empower organizations to engage audiences effectively through data-driven strategies and personalized interactions.

  • January 6, 2025, Salesforce data reveals that AI-driven tools like chatbots and virtual assistants contributed to a 4% increase in U.S. online holiday sales during the 2024 season, highlighting the growing role of AI in enhancing customer engagement in retail.

AI-Powered Audience Engagement Heat Index Market Key Players:

Some of the AI-Powered Audience Engagement Heat Index Market Companies:

  • IBM Corporation

  • Microsoft Corporation

  • Google LLC

  • Salesforce, Inc.

  • Oracle Corporation

  • Adobe Inc.

  • Amazon Web Services (AWS)

  • SAP SE

  • SAS Institute Inc.

  • Cognizant Technology Solutions

  • HCL Technologies

  • Accenture plc

  • Qualtrics International Inc.

  • Sprinklr, Inc.

  • Medallia, Inc.

  • Zendesk, Inc.

  • Pega Systems Inc.

  • Verint Systems Inc.

  • HubSpot, Inc.

  • LivePerson, Inc.

AI-Powered Audience Engagement Heat Index Market Report Scope:

Report Attributes Details
Market Size in 2024 USD 1.68 Billion 
Market Size by 2032 USD 7.58 Billion 
CAGR CAGR of 20.73% From 2025 to 2032
Base Year 2024
Forecast Period 2025-2032
Historical Data 2021-2023
Report Scope & Coverage Market Size, Segments Analysis, Competitive Landscape, Regional Analysis, DROC & SWOT Analysis, Forecast Outlook
Key Segments • By Component (Software, Hardware, Services)
• By Application (Media and Entertainment, Marketing and Advertising, Sports and Events, Retail, Education, Others)
• By Enterprise Size (Small and Medium Enterprises, Large Enterprises)
• By End-User (Broadcasting, Digital Platforms, Event Management, Retailers, Educational Institutions, Others)
Regional Analysis/Coverage North America (US, Canada), Europe (Germany, UK, France, Italy, Spain, Russia, Poland, Rest of Europe), Asia Pacific (China, India, Japan, South Korea, Australia, ASEAN Countries, Rest of Asia Pacific), Middle East & Africa (UAE, Saudi Arabia, Qatar, South Africa, Rest of Middle East & Africa), Latin America (Brazil, Argentina, Mexico, Colombia, Rest of Latin America).
Company Profiles IBM Corporation, Microsoft Corporation, Google LLC, Salesforce, Inc., Oracle Corporation, Adobe Inc., Amazon Web Services (AWS), SAP SE, SAS Institute Inc., Cognizant Technology Solutions, HCL Technologies, Accenture plc, Qualtrics International Inc., Sprinklr, Inc., Medallia, Inc., Zendesk, Inc., Pega Systems Inc., Verint Systems Inc., HubSpot, Inc., LivePerson, Inc, and Others.

Table Of Contents

1. Introduction

1.1 Market Definition & Scope

 1.2 Research Assumptions & Abbreviations

 1.3 Research Methodology

2. Executive Summary

2.1 Market Snapshot

 2.2 Market Absolute $ Opportunity Assessment & Y-o-Y Analysis, 2021–2032

 2.3 Market Size & Forecast, By Segmentation, 2021–2032

  2.3.1 Market Size by Component

  2.3.2 Market Size by Application

         2.3.2 Market Size by Enterprise Size

         2.3.2 Market Size by End-User

 2.4 Market Share & BPS Analysis By Region, 2024

 2.5 Industry Growth Scenarios – Conservative, Likely & Optimistic

 2.6 Industry CxO’s Perspective

3. Market Overview

3.1 Market Dynamics

  3.1.1 Drivers

  3.1.2 Restraints

  3.1.3 Opportunities

  3.1.4 Key Market Trends

 3.2 Industry PESTLE Analysis

 3.3 Key Industry Forces (Porter’s) Impacting Market Growth

 3.4 Industry Supply Chain Analysis

  3.4.1 Raw Material Suppliers

  3.4.2 Manufacturers

  3.4.3 Distributors/Suppliers

  3.4.4 Customers/End-Users

 3.5 Industry Life Cycle Assessment

 3.6 Parent Market Overview

 3.7 Market Risk Assessment

4. Statistical Insights & Trends Reporting

     4.1 Conversion Demand & Adoption Trends

4.1.1 Percentage of van owners opting for recreational vs. commercial conversions

4.1.2 Annual growth in campervan conversions for tourism and leisure

4.1.3 Share of corporate fleet operators investing in customized conversions

     4.2 Customization & Feature Preferences

4.2.1 Average spend per customer on van conversion (USD)

4.2.2 Most popular features installed (% share: solar panels, kitchen units, beds, tech add-ons)

4.2.3 Percentage of conversions integrating smart/connected features

     4.3 Sustainability & Energy Efficiency

4.3.1 Share of eco-friendly materials used in modern van conversions

4.3.2 Adoption rate of electric/solar-powered conversions in urban Markets

4.3.3 Reduction in fuel usage (%) from lightweight conversion designs

     4.4 Cost & ROI Analysis

4.4.1 Average conversion cost as a percentage of total van value

4.4.2 Resale value increase (%) of converted vans vs. standard vans

4.4.3 Average time (years) for ROI in commercial van conversions

5. AI-Powered Audience Engagement Heat Index Market Segmental Analysis & Forecast, By Component, 2021 – 2032, Value (USD Billion)

5.1 Introduction

 5.2 Software

  5.2.1 Key Trends

  5.2.2 Market Size & Forecast, 2021 – 2032

 5.3 Hardware

  5.3.1 Key Trends

  5.3.2 Market Size & Forecast, 2021 – 2032

 5.4 Services

  5.4.1 Key Trends

  5.4.2 Market Size & Forecast, 2021 – 2032

6. AI-Powered Audience Engagement Heat Index Market Segmental Analysis & Forecast, By Application, 2021 – 2032, Value (USD Billion)

    6.1 Introduction

 6.2 Media and Entertainment

  6.2.1 Key Trends

  6.2.2 Market Size & Forecast, 2021 – 2032

 6.3 Marketing and Advertising

  6.3.1 Key Trends

  6.3.2 Market Size & Forecast, 2021 – 2032

 6.4 Sports and Events

  6.4.1 Key Trends

  6.4.2 Market Size & Forecast, 2021 – 2032

 6.5 Retail

  6.5.1 Key Trends

  6.5.2 Market Size & Forecast, 2021 – 2032

 6.6 Education

  6.6.1 Key Trends

  6.6.2 Market Size & Forecast, 2021 – 2032

 6.5 Others

  6.7.1 Key Trends

  6.7.2 Market Size & Forecast, 2021 – 2032

7. AI-Powered Audience Engagement Heat Index Market Segmental Analysis & Forecast, By End-User, 2021 – 2032, Value (USD Billion)

    7.1 Introduction

 7.2 Broadcasting

  7.2.1 Key Trends

  7.2.2 Market Size & Forecast, 2021 – 2032

 7.3 Digital Platforms

  7.3.1 Key Trends

  7.3.2 Market Size & Forecast, 2021 – 2032

 7.4 Event Management

  7.4.1 Key Trends

  7.4.2 Market Size & Forecast, 2021 – 2032

 7.5 Retailers

  7.5.1 Key Trends

  7.5.2 Market Size & Forecast, 2021 – 2032

 7.6 Educational Institutions

  7.6.1 Key Trends

  7.6.2 Market Size & Forecast, 2021 – 2032

 7.7 Others

  7.7.1 Key Trends

  7.7.2 Market Size & Forecast, 2021 – 2032

8. AI-Powered Audience Engagement Heat Index Market Segmental Analysis & Forecast, By Enterprise Size, 2021 – 2032, Value (USD Billion)

    8.1 Introduction

 8.2 Small and Medium Enterprises

  8.2.1 Key Trends

  8.2.2 Market Size & Forecast, 2021 – 2032

 8.3 Large Enterprises

  8.3.1 Key Trends

  8.3.2 Market Size & Forecast, 2021 – 2032

9. AI-Powered Audience Engagement Heat Index Market Segmental Analysis & Forecast By Region, 2021 – 2025, Value (USD Billion)

9.1 Introduction

9.2 North America

 9.2.1 Key Trends

 9.2.2 AI-Powered Audience Engagement Heat Index Market Size & Forecast, By Component, 2021 – 2032

 9.2.3 AI-Powered Audience Engagement Heat Index Market Size & Forecast, By Application, 2021 – 2032

 9.2.4 AI-Powered Audience Engagement Heat Index Market Size & Forecast, By End-User, 2021 – 2032

 9.2.5 AI-Powered Audience Engagement Heat Index Market Size & Forecast, By Enterprise Size, 2021 – 2032

 9.2.6 AI-Powered Audience Engagement Heat Index Market Size & Forecast, By Country, 2021 – 2032

  9.2.6.1 USA

   9.2.6.1.1 AI-Powered Audience Engagement Heat Index Market Size & Forecast, By Component, 2021 – 2032

   9.2.6.1.2 AI-Powered Audience Engagement Heat Index Market Size & Forecast, By Application, 2021 – 2032

   9.2.6.1.3 AI-Powered Audience Engagement Heat Index Market Size & Forecast, By End-User, 2021 – 2032

   9.2.6.1.4 AI-Powered Audience Engagement Heat Index Market Size & Forecast, By Enterprise Size, 2021 – 2032

  9.2.6.2 Canada

   9.2.6.2.1 AI-Powered Audience Engagement Heat Index Market Size & Forecast, By Component, 2021 – 2032

   9.2.6.2.2 AI-Powered Audience Engagement Heat Index Market Size & Forecast, By Application, 2021 – 2032

   9.2.6.2.3 AI-Powered Audience Engagement Heat Index Market Size & Forecast, By End-User, 2021 – 2032

   9.2.6.2.4 AI-Powered Audience Engagement Heat Index Market Size & Forecast, By Enterprise Size, 2021 – 2032

9.3 Europe

 9.3.1 Key Trends

 9.3.2 AI-Powered Audience Engagement Heat Index Market Size & Forecast, By Component, 2021 – 2032

 9.3.3 AI-Powered Audience Engagement Heat Index Market Size & Forecast, By Application, 2021 – 2032

 9.3.4 AI-Powered Audience Engagement Heat Index Market Size & Forecast, By End-User, 2021 – 2032

 9.3.5 AI-Powered Audience Engagement Heat Index Market Size & Forecast, By Enterprise Size, 2021 – 2032

 9.3.6 AI-Powered Audience Engagement Heat Index Market Size & Forecast, By Country, 2021 – 2032

  9.3.6.1 Germany

   9.3.6.1.1 AI-Powered Audience Engagement Heat Index Market Size & Forecast, By Component, 2021 – 2032

   9.3.6.1.2 AI-Powered Audience Engagement Heat Index Market Size & Forecast, By Application, 2021 – 2032

   9.3.6.1.3 AI-Powered Audience Engagement Heat Index Market Size & Forecast, By End-User, 2021 – 2032

   9.3.6.1.4 AI-Powered Audience Engagement Heat Index Market Size & Forecast, By Enterprise Size, 2021 – 2032

  9.3.6.2 UK

   9.3.6.2.1 AI-Powered Audience Engagement Heat Index Market Size & Forecast, By Component, 2021 – 2032

   9.3.6.2.2 AI-Powered Audience Engagement Heat Index Market Size & Forecast, By Application, 2021 – 2032

   9.3.6.2.3 AI-Powered Audience Engagement Heat Index Market Size & Forecast, By End-User, 2021 – 2032

   9.3.6.2.4 AI-Powered Audience Engagement Heat Index Market Size & Forecast, By Enterprise Size, 2021 – 2032

  9.3.6.3 France

   9.3.6.3.1 AI-Powered Audience Engagement Heat Index Market Size & Forecast, By Component, 2021 – 2032

   9.3.6.3.2 AI-Powered Audience Engagement Heat Index Market Size & Forecast, By Application, 2021 – 2032

   9.3.6.3.3 AI-Powered Audience Engagement Heat Index Market Size & Forecast, By End-User, 2021 – 2032

   9.3.6.3.4 AI-Powered Audience Engagement Heat Index Market Size & Forecast, By Enterprise Size, 2021 – 2032

  9.3.6.4 Italy

   9.3.6.4.1 AI-Powered Audience Engagement Heat Index Market Size & Forecast, By Component, 2021 – 2032

   9.3.6.4.2 AI-Powered Audience Engagement Heat Index Market Size & Forecast, By Application, 2021 – 2032

   9.3.6.4.3 AI-Powered Audience Engagement Heat Index Market Size & Forecast, By End-User, 2021 – 2032

   9.3.6.4.4 AI-Powered Audience Engagement Heat Index Market Size & Forecast, By Enterprise Size, 2021 – 2032

  9.3.6.5 Spain

   9.3.6.5.1 AI-Powered Audience Engagement Heat Index Market Size & Forecast, By Component, 2021 – 2032

   9.3.6.5.2 AI-Powered Audience Engagement Heat Index Market Size & Forecast, By Application, 2021 – 2032

   9.3.6.5.3 AI-Powered Audience Engagement Heat Index Market Size & Forecast, By End-User, 2021 – 2032

   9.3.6.5.4 AI-Powered Audience Engagement Heat Index Market Size & Forecast, By Enterprise Size, 2021 – 2032

  9.3.6.6 Russia

   9.3.6.6.1 AI-Powered Audience Engagement Heat Index Market Size & Forecast, By Component, 2021 – 2032

   9.3.6.6.2 AI-Powered Audience Engagement Heat Index Market Size & Forecast, By Application, 2021 – 2032

   9.3.6.6.3 AI-Powered Audience Engagement Heat Index Market Size & Forecast, By End-User, 2021 – 2032

   9.3.6.6.4 AI-Powered Audience Engagement Heat Index Market Size & Forecast, By Enterprise Size, 2021 – 2032

  9.3.6.7 Poland

   9.3.6.7.1 AI-Powered Audience Engagement Heat Index Market Size & Forecast, By Component, 2021 – 2032

   9.3.6.7.2 AI-Powered Audience Engagement Heat Index Market Size & Forecast, By Application, 2021 – 2032

   9.3.6.7.3 AI-Powered Audience Engagement Heat Index Market Size & Forecast, By End-User, 2021 – 2032

   9.3.6.7.4 AI-Powered Audience Engagement Heat Index Market Size & Forecast, By Enterprise Size, 2021 – 2032

  9.3.6.8 Rest of Europe

   9.3.6.8.1 AI-Powered Audience Engagement Heat Index Market Size & Forecast, By Component, 2021 – 2032

   9.3.6.8.2 AI-Powered Audience Engagement Heat Index Market Size & Forecast, By Application, 2021 – 2032

   9.3.6.8.3 AI-Powered Audience Engagement Heat Index Market Size & Forecast, By End-User, 2021 – 2032

   9.3.6.8.4 AI-Powered Audience Engagement Heat Index Market Size & Forecast, By Enterprise Size, 2021 – 2032   

9.4 Asia-Pacific

 9.4.1 Key Trends

 9.4.2 AI-Powered Audience Engagement Heat Index Market Size & Forecast, By Component, 2021 – 2032

 9.4.3 AI-Powered Audience Engagement Heat Index Market Size & Forecast, By Application, 2021 – 2032

 9.4.4 AI-Powered Audience Engagement Heat Index Market Size & Forecast, By End-User, 2021 – 2032

 9.4.5 AI-Powered Audience Engagement Heat Index Market Size & Forecast, By Enterprise Size, 2021 – 2032

 9.4.6 AI-Powered Audience Engagement Heat Index Market Size & Forecast, By Country, 2021 – 2032

  9.4.6.1 China

   9.4.6.1.1 AI-Powered Audience Engagement Heat Index Market Size & Forecast, By Component, 2021 – 2032

   9.4.6.1.2 AI-Powered Audience Engagement Heat Index Market Size & Forecast, By Application, 2021 – 2032

   9.4.6.1.3 AI-Powered Audience Engagement Heat Index Market Size & Forecast, By End-User, 2021 – 2032

   9.4.6.1.4 AI-Powered Audience Engagement Heat Index Market Size & Forecast, By Enterprise Size, 2021 – 2032

  9.4.6.2 India

   9.4.6.2.1 AI-Powered Audience Engagement Heat Index Market Size & Forecast, By Component, 2021 – 2032

   9.4.6.2.2 AI-Powered Audience Engagement Heat Index Market Size & Forecast, By Application, 2021 – 2032

   9.4.6.2.3 AI-Powered Audience Engagement Heat Index Market Size & Forecast, By End-User, 2021 – 2032

   9.4.6.2.4 AI-Powered Audience Engagement Heat Index Market Size & Forecast, By Enterprise Size, 2021 – 2032

  9.4.6.3 Japan

   9.4.6.3.1 AI-Powered Audience Engagement Heat Index Market Size & Forecast, By Component, 2021 – 2032

   9.4.6.3.2 AI-Powered Audience Engagement Heat Index Market Size & Forecast, By Application, 2021 – 2032

   9.4.6.3.3 AI-Powered Audience Engagement Heat Index Market Size & Forecast, By End-User, 2021 – 2032

   9.4.6.3.4 AI-Powered Audience Engagement Heat Index Market Size & Forecast, By Enterprise Size, 2021 – 2032

  9.4.6.4 South Korea

   9.4.6.4.1 AI-Powered Audience Engagement Heat Index Market Size & Forecast, By Component, 2021 – 2032

   9.4.6.4.2 AI-Powered Audience Engagement Heat Index Market Size & Forecast, By Application, 2021 – 2032

   9.4.6.4.3 AI-Powered Audience Engagement Heat Index Market Size & Forecast, By End-User, 2021 – 2032

   9.4.6.4.4 AI-Powered Audience Engagement Heat Index Market Size & Forecast, By Enterprise Size, 2021 – 2032

  9.4.6.5 Australia

   9.4.6.5.1 AI-Powered Audience Engagement Heat Index Market Size & Forecast, By Component, 2021 – 2032

   9.4.6.5.2 AI-Powered Audience Engagement Heat Index Market Size & Forecast, By Application, 2021 – 2032

   9.4.6.5.3 AI-Powered Audience Engagement Heat Index Market Size & Forecast, By End-User, 2021 – 2032

   9.4.6.5.4 AI-Powered Audience Engagement Heat Index Market Size & Forecast, By Enterprise Size, 2021 – 2032

  9.4.6.6 ASEAN Countries

   9.4.6.6.1 AI-Powered Audience Engagement Heat Index Market Size & Forecast, By Component, 2021 – 2032

   9.4.6.6.2 AI-Powered Audience Engagement Heat Index Market Size & Forecast, By Application, 2021 – 2032

   9.4.6.6.3 AI-Powered Audience Engagement Heat Index Market Size & Forecast, By End-User, 2021 – 2032

   9.4.6.6.4 AI-Powered Audience Engagement Heat Index Market Size & Forecast, By Enterprise Size, 2021 – 2032

  9.4.6.7 Rest of Asia-Pacific

   9.4.6.7.1 AI-Powered Audience Engagement Heat Index Market Size & Forecast, By Component, 2021 – 2032

   9.4.6.7.2 AI-Powered Audience Engagement Heat Index Market Size & Forecast, By Application, 2021 – 2032

   9.4.6.7.3 AI-Powered Audience Engagement Heat Index Market Size & Forecast, By End-User, 2021 – 2032

   9.4.6.7.4 AI-Powered Audience Engagement Heat Index Market Size & Forecast, By Enterprise Size, 2021 – 2032

9.5 Latin America

 9.5.1 Key Trends

 9.5.2 AI-Powered Audience Engagement Heat Index Market Size & Forecast, By Component, 2021 – 2032

 9.5.3 AI-Powered Audience Engagement Heat Index Market Size & Forecast, By Application, 2021 – 2032

 9.5.4 AI-Powered Audience Engagement Heat Index Market Size & Forecast, By End-User, 2021 – 2032

 9.5.5 AI-Powered Audience Engagement Heat Index Market Size & Forecast, By Enterprise Size, 2021 – 2032

 9.5.6 AI-Powered Audience Engagement Heat Index Market Size & Forecast, By Country, 2021 – 2032

  9.5.6.1 Brazil

   9.5.6.1.1 AI-Powered Audience Engagement Heat Index Market Size & Forecast, By Component, 2021 – 2032

   9.5.6.1.2 AI-Powered Audience Engagement Heat Index Market Size & Forecast, By Application, 2021 – 2032

   9.5.6.1.3 AI-Powered Audience Engagement Heat Index Market Size & Forecast, By End-User, 2021 – 2032

   9.5.6.1.4 AI-Powered Audience Engagement Heat Index Market Size & Forecast, By Enterprise Size, 2021 – 2032

  9.5.6.2 Argentina

   9.5.6.2.1 AI-Powered Audience Engagement Heat Index Market Size & Forecast, By Component, 2021 – 2032

   9.5.6.2.2 AI-Powered Audience Engagement Heat Index Market Size & Forecast, By Application, 2021 – 2032

   9.5.6.2.3 AI-Powered Audience Engagement Heat Index Market Size & Forecast, By End-User, 2021 – 2032

   9.5.6.2.4 AI-Powered Audience Engagement Heat Index Market Size & Forecast, By Enterprise Size, 2021 – 2032

  9.5.6.3 Mexico

   9.5.6.3.1 AI-Powered Audience Engagement Heat Index Market Size & Forecast, By Component, 2021 – 2032

   9.5.6.3.2 AI-Powered Audience Engagement Heat Index Market Size & Forecast, By Application, 2021 – 2032

   9.5.6.3.3 AI-Powered Audience Engagement Heat Index Market Size & Forecast, By End-User, 2021 – 2032

   9.5.6.3.4 AI-Powered Audience Engagement Heat Index Market Size & Forecast, By Enterprise Size, 2021 – 2032

  9.5.6.4 Colombia

   9.5.6.4.1 AI-Powered Audience Engagement Heat Index Market Size & Forecast, By Component, 2021 – 2032

   9.5.6.4.2 AI-Powered Audience Engagement Heat Index Market Size & Forecast, By Application, 2021 – 2032

   9.5.6.4.3 AI-Powered Audience Engagement Heat Index Market Size & Forecast, By End-User, 2021 – 2032

   9.5.6.4.4 AI-Powered Audience Engagement Heat Index Market Size & Forecast, By Enterprise Size, 2021 – 2032

  9.5.6.5 Rest of Latin America

   9.5.6.5.1 AI-Powered Audience Engagement Heat Index Market Size & Forecast, By Component, 2021 – 2032

   9.5.6.5.2 AI-Powered Audience Engagement Heat Index Market Size & Forecast, By Application, 2021 – 2032

   9.5.6.5.3 AI-Powered Audience Engagement Heat Index Market Size & Forecast, By End-User, 2021 – 2032

   9.5.6.5.4 AI-Powered Audience Engagement Heat Index Market Size & Forecast, By Enterprise Size, 2021 – 2032

9.6 Middle East & Africa

 9.6.1 Key Trends

 9.6.2 AI-Powered Audience Engagement Heat Index Market Size & Forecast, By Component, 2021 – 2032

 9.6.3 AI-Powered Audience Engagement Heat Index Market Size & Forecast, By Application, 2021 – 2032

 9.6.4 AI-Powered Audience Engagement Heat Index Market Size & Forecast, By End-User, 2021 – 2032

 9.6.5 AI-Powered Audience Engagement Heat Index Market Size & Forecast, By Enterprise Size, 2021 – 2032

 9.6.6 AI-Powered Audience Engagement Heat Index Market Size & Forecast, By Country, 2021 – 2032

  9.6.6.1 UAE

   9.6.6.1.1 AI-Powered Audience Engagement Heat Index Market Size & Forecast, By Component, 2021 – 2032

   9.6.6.1.2 AI-Powered Audience Engagement Heat Index Market Size & Forecast, By Application, 2021 – 2032

   9.6.6.1.3 AI-Powered Audience Engagement Heat Index Market Size & Forecast, By End-User, 2021 – 2032

   9.6.6.1.4 AI-Powered Audience Engagement Heat Index Market Size & Forecast, By Enterprise Size, 2021 – 2032

  9.6.6.2 Saudi Arabia

   9.6.6.2.1 AI-Powered Audience Engagement Heat Index Market Size & Forecast, By Component, 2021 – 2032

   9.6.6.2.2 AI-Powered Audience Engagement Heat Index Market Size & Forecast, By Application, 2021 – 2032

   9.6.6.2.3 AI-Powered Audience Engagement Heat Index Market Size & Forecast, By End-User, 2021 – 2032

   9.6.6.2.4 AI-Powered Audience Engagement Heat Index Market Size & Forecast, By Enterprise Size, 2021 – 2032

  9.6.6.3 Qatar

   9.6.6.3.1 AI-Powered Audience Engagement Heat Index Market Size & Forecast, By Component, 2021 – 2032

   9.6.6.3.2 AI-Powered Audience Engagement Heat Index Market Size & Forecast, By Application, 2021 – 2032

   9.6.6.3.3 AI-Powered Audience Engagement Heat Index Market Size & Forecast, By End-User, 2021 – 2032

   9.6.6.3.4 AI-Powered Audience Engagement Heat Index Market Size & Forecast, By Enterprise Size, 2021 – 2032

  9.6.6.4 Egypt

   9.6.6.4.1 AI-Powered Audience Engagement Heat Index Market Size & Forecast, By Component, 2021 – 2032

   9.6.6.4.2 AI-Powered Audience Engagement Heat Index Market Size & Forecast, By Application, 2021 – 2032

   9.6.6.4.3 AI-Powered Audience Engagement Heat Index Market Size & Forecast, By End-User, 2021 – 2032

   9.6.6.4.4 AI-Powered Audience Engagement Heat Index Market Size & Forecast, By Enterprise Size, 2021 – 2032

  9.6.6.5 South Africa

   9.6.6.5.1 AI-Powered Audience Engagement Heat Index Market Size & Forecast, By Component, 2021 – 2032

   9.6.6.5.2 AI-Powered Audience Engagement Heat Index Market Size & Forecast, By Application, 2021 – 2032

   9.6.6.5.3 AI-Powered Audience Engagement Heat Index Market Size & Forecast, By End-User, 2021 – 2032

   9.6.6.5.4 AI-Powered Audience Engagement Heat Index Market Size & Forecast, By Enterprise Size, 2021 – 2032

  9.6.6.6 Rest of Middle East & Africa

   9.6.6.6.1 AI-Powered Audience Engagement Heat Index Market Size & Forecast, By Component, 2021 – 2032

   9.6.6.6.2 AI-Powered Audience Engagement Heat Index Market Size & Forecast, By Application, 2021 – 2032

   9.6.6.6.3 AI-Powered Audience Engagement Heat Index Market Size & Forecast, By End-User, 2021 – 2032

   9.6.6.6.4 AI-Powered Audience Engagement Heat Index Market Size & Forecast, By Enterprise Size, 2021 – 2032

10. Competitive Landscape

 10.1 Key Players' Positioning

 10.2 Competitive Developments

  10.2.1 Key Strategies Adopted (%), By Key Players, 2024

  10.2.2 Year-Wise Strategies & Development, 2021 – 2025

  10.2.3 Number of Strategies Adopted by Key Players, 2024

 10.3 Market Share Analysis, 2024

 10.4 Product/Service & Application Benchmarking

  10.4.1 Product/Service Specifications & Features By Key Players

  10.4.2 Product/Service Heatmap By Key Players

  10.4.3 Application Heatmap By Key Players

 10.5 Industry Start-Up & Innovation Landscape

 10.6 Key Company Profiles

10.6 Key Company Profiles

 10.6.1 IBM Corporation

  10.6.1.1 Company Overview & Snapshot

  10.6.1.2 Product/Service Portfolio

  10.6.1.3 Key Company Financials

  10.6.1.4 SWOT Analysis

 10.6.2 Microsoft Corporation

  10.6.2.1 Company Overview & Snapshot

  10.6.2.2 Product/Service Portfolio

  10.6.2.3 Key Company Financials

  10.6.2.4 SWOT Analysis

 10.6.3 Google LLC

  10.6.3.1 Company Overview & Snapshot

  10.6.3.2 Product/Service Portfolio

  10.6.3.3 Key Company Financials

  10.6.3.4 SWOT Analysis

 10.6.4 Salesforce, Inc.

  10.6.4.1 Company Overview & Snapshot

  10.6.4.2 Product/Service Portfolio

  10.6.4.3 Key Company Financials

  10.6.4.4 SWOT Analysis

 10.6.5 Oracle Corporation

  10.6.5.1 Company Overview & Snapshot

  10.6.5.2 Product/Service Portfolio

  10.6.5.3 Key Company Financials

  10.6.5.4 SWOT Analysis

 10.6.6 Adobe Inc.

  10.6.6.1 Company Overview & Snapshot

  10.6.6.2 Product/Service Portfolio

  10.6.6.3 Key Company Financials

  10.6.6.4 SWOT Analysis

 10.6.7 Amazon Web Services (AWS)

  10.6.7.1 Company Overview & Snapshot

  10.6.7.2 Product/Service Portfolio

  10.6.7.3 Key Company Financials

  10.6.7.4 SWOT Analysis

 10.6.8 SAP SE

  10.6.8.1 Company Overview & Snapshot

  10.6.8.2 Product/Service Portfolio

  10.6.8.3 Key Company Financials

  10.6.8.4 SWOT Analysis

 10.6.9 SAS Institute Inc.

  10.6.9.1 Company Overview & Snapshot

  10.6.9.2 Product/Service Portfolio

  10.6.9.3 Key Company Financials

  10.6.9.4 SWOT Analysis

 10.6.10 Cognizant Technology Solutions

  10.6.10.1 Company Overview & Snapshot

  10.6.10.2 Product/Service Portfolio

  10.6.10.3 Key Company Financials

  10.6.10.4 SWOT Analysis

 10.6.11 HCL Technologies

  10.6.11.1 Company Overview & Snapshot

  10.6.11.2 Product/Service Portfolio

  10.6.11.3 Key Company Financials

  10.6.11.4 SWOT Analysis

 10.6.12 Accenture plc

  10.6.12.1 Company Overview & Snapshot

  10.6.12.2 Product/Service Portfolio

  10.6.12.3 Key Company Financials

  10.6.12.4 SWOT Analysis

 10.6.13 Qualtrics International Inc.

  10.6.13.1 Company Overview & Snapshot

  10.6.13.2 Product/Service Portfolio

  10.6.13.3 Key Company Financials

  10.6.13.4 SWOT Analysis

 10.6.14 Sprinklr, Inc.

  10.6.14.1 Company Overview & Snapshot

  10.6.14.2 Product/Service Portfolio

  10.6.14.3 Key Company Financials

  10.6.14.4 SWOT Analysis

 10.6.15 Medallia, Inc.

  10.6.15.1 Company Overview & Snapshot

  10.6.15.2 Product/Service Portfolio

  10.6.15.3 Key Company Financials

  10.6.15.4 SWOT Analysis

 10.6.16 Zendesk, Inc.

  10.6.16.1 Company Overview & Snapshot

  10.6.16.2 Product/Service Portfolio

  10.6.16.3 Key Company Financials

  10.6.16.4 SWOT Analysis

 10.6.17 Pega Systems Inc.

  10.6.17.1 Company Overview & Snapshot

  10.6.17.2 Product/Service Portfolio

  10.6.17.3 Key Company Financials

  10.6.17.4 SWOT Analysis

 10.6.18 Verint Systems Inc.

  10.6.18.1 Company Overview & Snapshot

  10.6.18.2 Product/Service Portfolio

  10.6.18.3 Key Company Financials

  10.6.18.4 SWOT Analysis

 10.6.19 HubSpot, Inc.

  10.6.19.1 Company Overview & Snapshot

  10.6.19.2 Product/Service Portfolio

  10.6.19.3 Key Company Financials

  10.6.19.4 SWOT Analysis

 10.6.20 LivePerson, Inc.

  10.6.20.1 Company Overview & Snapshot

  10.6.20.2 Product/Service Portfolio

  10.6.20.3 Key Company Financials

  10.6.20.4 SWOT Analysis

11. Analyst Recommendations

 11.1 SNS Insider Opportunity Map

 11.2 Industry Low-Hanging Fruit Assessment

 11.3 Market Entry & Growth Strategy

 11.4 Analyst Viewpoint & Suggestions On Market Growth

12. Assumptions

13. Disclaimer

14. Appendix

 14.1 List Of Tables

 14.2 List Of Figures

Key Segments: 

By Component

  • Software

  • Hardware

  • Services

By Application

  • Media and Entertainment

  • Marketing and Advertising

  • Sports and Events

  • Retail

  • Education

  • Others

By Enterprise Size

  • Small and Medium Enterprises

  • Large Enterprises

By End-User

  • Broadcasting

  • Digital Platforms

  • Event Management

  • Retailers

  • Educational Institutions

  • Others

Request for Segment Customization as per your Business Requirement: Segment Customization Request

Regional Coverage: 

North America

  • US

  • Canada

Europe

  • Germany

  • France

  • UK

  • Italy

  • Spain

  • Poland

  • Russia

  • Rest of Europe

Asia Pacific

  • China

  • India

  • Japan

  • South Korea

  • Australia

  • ASEAN Countries

  • Rest of Asia Pacific

Middle East & Africa

  • UAE

  • Saudi Arabia

  • Qatar

  • South Africa

  • Rest of Middle East & Africa

Latin America

  • Brazil

  • Argentina

  • Mexico

  • Colombia

  • Rest of Latin America

Request for Country Level Research Report: Country Level Customization Request

Available Customization 

With the given market data, SNS Insider offers customization as per the company’s specific needs. The following customization options are available for the report: 

  • Detailed Volume Analysis 

  • Criss-Cross segment analysis (e.g. Product X Application) 

  • Competitive Product Benchmarking 

  • Geographic Analysis 

  • Additional countries in any of the regions 

  • Customized Data Representation 

  • Detailed analysis and profiling of additional market players

An accurate research report requires proper strategizing as well as implementation. There are multiple factors involved in the completion of good and accurate research report and selecting the best methodology to compete the research is the toughest part. Since the research reports we provide play a crucial role in any company’s decision-making process, therefore we at SNS Insider always believe that we should choose the best method which gives us results closer to reality. This allows us to reach at a stage wherein we can provide our clients best and accurate investment to output ratio.

Each report that we prepare takes a timeframe of 350-400 business hours for production. Starting from the selection of titles through a couple of in-depth brain storming session to the final QC process before uploading our titles on our website we dedicate around 350 working hours. The titles are selected based on their current market cap and the foreseen CAGR and growth.


The 5 steps process:

Step 1: Secondary Research:

Secondary Research or Desk Research is as the name suggests is a research process wherein, we collect data through the readily available information. In this process we use various paid and unpaid databases which our team has access to and gather data through the same. This includes examining of listed companies’ annual reports, Journals, SEC filling etc. Apart from this our team has access to various associations across the globe across different industries. Lastly, we have exchange relationships with various university as well as individual libraries.

Secondary Research

Step 2: Primary Research

When we talk about primary research, it is a type of study in which the researchers collect relevant data samples directly, rather than relying on previously collected data.  This type of research is focused on gaining content specific facts that can be sued to solve specific problems. Since the collected data is fresh and first hand therefore it makes the study more accurate and genuine.

We at SNS Insider have divided Primary Research into 2 parts.

Part 1 wherein we interview the KOLs of major players as well as the upcoming ones across various geographic regions. This allows us to have their view over the market scenario and acts as an important tool to come closer to the accurate market numbers. As many as 45 paid and unpaid primary interviews are taken from both the demand and supply side of the industry to make sure we land at an accurate judgement and analysis of the market.

This step involves the triangulation of data wherein our team analyses the interview transcripts, online survey responses and observation of on filed participants. The below mentioned chart should give a better understanding of the part 1 of the primary interview.

Primary Research

Part 2: In this part of primary research the data collected via secondary research and the part 1 of the primary research is validated with the interviews from individual consultants and subject matter experts.

Consultants are those set of people who have at least 12 years of experience and expertise within the industry whereas Subject Matter Experts are those with at least 15 years of experience behind their back within the same space. The data with the help of two main processes i.e., FGDs (Focused Group Discussions) and IDs (Individual Discussions). This gives us a 3rd party nonbiased primary view of the market scenario making it a more dependable one while collation of the data pointers.

Step 3: Data Bank Validation

Once all the information is collected via primary and secondary sources, we run that information for data validation. At our intelligence centre our research heads track a lot of information related to the market which includes the quarterly reports, the daily stock prices, and other relevant information. Our data bank server gets updated every fortnight and that is how the information which we collected using our primary and secondary information is revalidated in real time.

Data Bank Validation

Step 4: QA/QC Process

After all the data collection and validation our team does a final level of quality check and quality assurance to get rid of any unwanted or undesired mistakes. This might include but not limited to getting rid of the any typos, duplication of numbers or missing of any important information. The people involved in this process include technical content writers, research heads and graphics people. Once this process is completed the title gets uploader on our platform for our clients to read it.

Step 5: Final QC/QA Process:

This is the last process and comes when the client has ordered the study. In this process a final QA/QC is done before the study is emailed to the client. Since we believe in giving our clients a good experience of our research studies, therefore, to make sure that we do not lack at our end in any way humanly possible we do a final round of quality check and then dispatch the study to the client.