Connected Agriculture Market Size & Overview:
Get more information on Connected Agriculture Market - Request Sample Report
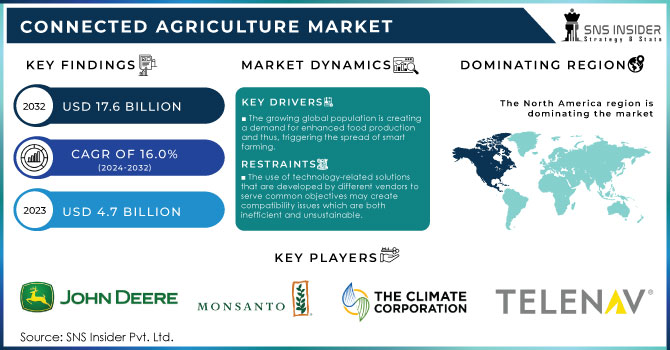
The Connected Agriculture Market was valued at USD 4.7 billion in 2023 and is expected to reach USD 17.6 billion by 2032, growing at a CAGR of 16.0% from 2024-2032.
The Connected Agriculture Market is the implementation of digital technologies such as the IoT, cloud computing, big data, and AI into agricultural systems. These systems help farmers to enhance the production of crops, efficiently manage resources, and optimize the supply chain. Connected Agriculture systems include accurate farming tools, remote monitoring devices, and smart irrigation systems that assist farmers in decision-making adjusted to the provided data. Thus, the developed systems help in reducing waste and improving the productivity of the market. The expansion of the market is driven by a rising demand for food production caused by the growing population. In addition, the need for environmentally sustainable agricultural practices also promotes the development of the market. Moreover, countries take various measures to boost agricultural efficiency, which increasingly involves connected systems.
The global population will reach 9.7 billion by 2050, thus creating a considerable increase in food demand. Technologies of connected agriculture such as precision farming and smart irrigation allow farmers to significantly increase crop yields and effectively control resources, addressing the fundamental challenge associated with feeding an expanded population. As a result, in 2022, over 25% of global farms implemented some sort of smart farming solution. Additionally, IoT devices combined with AI analytics have an enormous impact on farming. Thus, in 2023, over 50% of developed countries’ farms actively used Internet of Things -based sensors to monitor the health of crops, conditions of the soil, and livestock, thus providing valuable data in real-time.
Eventually, governments are actively encouraging the use of connected technologies to increase the effectiveness of farming and reduce the environmental implications. For instance, in 2023, the European Union implemented the “Farm to Fork” strategy within the developed Green Deal. The new policy increases the promotion of smart technologies to make food systems sustainable. At the same time, in India, the government is encouraging Digital Agriculture, providing farmers with subsidies and training for the connected solution adoption.
Connected Agriculture Market Dynamics
Drivers
-
The growing global population is creating a demand for enhanced food production and thus, triggering the spread of smart farming.
-
The use of IoT devices combined with AI analytics technology enhances decision-making and improves operational efficacy.
-
Connected technologies help farmers manage resources and mitigate the effects of climate change with tools like smart irrigation and weather forecasting.
The connected technologies utilized in the Connected Agriculture Market assist farmers in managing resources and climate change. To begin with, smart irrigation and weather forecasting are among the most important factors. Smart irrigation systems use soil moisture and weather condition data from sensors to apply a precise amount of water only when it needed. For example, if there is a drop in soil moisture level, the systems sense it and supply the moisture. With the technology, farmers minimize water wastage and improve crop yield and productivity. This is especially important in regions where there is a scarcity of water or drought. On the other hand, weather forecasting uses sensors connected to the IoT. Any weather changes are known to the farmer in real time. The use of such technologies prevents the farmer from massive loss of crops due to the manner of planting, harvesting, or protecting the crops against adverse weather. The climate changes have become unpredictable making it impossible for farmers to forecast on their own. Such connected technologies help in managing resources and adverse impacts of climatic changes.
For example,
| Technology | Benefits | Efficiency Improvement |
|
Smart Irrigation |
Precise water management reduces wastage |
Up to 30% water savings |
|
Weather Forecasting |
Real-time weather insights, better planning |
15-20% reduction in crop loss |
|
IoT Sensors |
Continuous monitoring of soil and crop health |
Improved decision-making |
Restraints
-
The use of technology-related solutions that are developed by different vendors to serve common objectives may create compatibility issues which are both inefficient and unsustainable.
-
For developing regions, there is an issue of lack of awareness that prevents the creation and exploitation of connected agricultural technologies.
-
Many farmers lack the necessary technical skills to operate and maintain connected agriculture systems effectively.
Using connected agriculture systems, which combine the IoT, data analytics, and automation to improve farming processes, face certain challenges for many farmers. It is required to have the technical knowledge and skills to manage sensors, data platforms, drones, and other equipment adequately. However, many farmers, especially in developing countries, don’t have knowledge and experience as they were not trained to use this technology. As a result, they are faced with the challenges of maintenance, troubleshooting, and lack of proper use, which can be a significant contribution to the underuse and breakdown of expensive equipment. Thus, in the connected agriculture market, the lack of skills is the factor that can slow down the rate of the adoption of technology, especially among smallholder farmers.
Many farmers in developing regions are not fully aware of the benefits and practices of connected agriculture technologies. Although IoT systems, sensors, and data tools can improve crop yields, resource management, and farming performance, many workers in the fields are unfamiliar with this advantage. There is a large informational barrier that can be observed in the connected agriculture market. Due to a lack of promotion, as a result of insufficient literacy, and information lack, farmers remain unfamiliar with the advantages of many modern technologies. Besides, the opportunity of losing money in unfamiliar technologies and too big risks, as well as a hidden concern that the technology will not pay off due to technical complexity and high costs can also stand behind this phenomenon. Utterly, when supported by a deficiency in significant widespread education or training programs, it can limit the growing opportunities of a new target market.
The awareness gap led to unrolled promotion of training, demonstration projects, and reach-out programs presented by governments, NGOs, and tech companies. When more farmers gain a better understanding of connected agriculture, the market grows. As a result of such policies, soon connectivity agriculture technologies are going to be spread wider with more farmers seeking to adopt these.
Connected Agriculture Market Segment Analysis
By Component
In 2023, the solution segment dominated the market and captured over 73.8% of global revenue. This is driven by increasing demand for data-driven decision-making and investment in AgTech startups. Farmers require real-time data and insights to manage their crops, monitor soil health, and predict weather conditions; thus the demand for integrated solutions providing comprehensive data analysis and reporting is growing.
The services segment is anticipated to grow at a significant CAGR of 16.3% during the forecast period, as the advance of agricultural technologies makes the solutions more complex. They are implemented and maintained by farmers and agribusinesses with increasing difficulties, and, along with that, the importance of managed services is growing for the optimization of connected solution performance and increase of their lifetime. Along with that, there is a rising need for specialized support and services, such as consultancy, support, and system integration. The fast growth of connected agriculture technologies emphasizes the increasing importance of comprehensive integration and support services.
By Deployment
In 2023, the cloud segment dominated the market and represented over 68.8% of global revenue, Driven by The ability of cloud solutions to provide scalable resources and adjustable capacity for agricultural enterprises. It allows agribusinesses to enlarge or decrease IT infrastructure at any time, which is critical to smoothly managing various data loads and other operational needs. Other benefits include global access to agricultural data and applications, which increases the productivity of farm managers who have to work at multiple locations.
On-premises is projected to witness a noticeable CAGR of 14.7% during the forecast period. On-premises deployments are popular in locations where there is little access to the internet. Since these farms are located in remote regions where internet access is not trustworthy, on-premises installments make greater sense. They can work autonomously on the cloud.
By Application
In 2023 the precision farming segment dominated the market and captured over 38.7% of the global market revenue. Precision farming technologies are highly adopted as the need for food production efficiency is increasing, and the concerns of climate change and environmental sustainability are growing. Data-driven technologies are used to improve crop yield by accurately managing the conditions of a particular piece of land. Moreover, precision farming helps in wise resource management as such resources as water, fertilizers, and pesticides are widely used. Due to fast climate change consideration, farmers can observe weather conditions and soil state on a real-time basis and respond immediately if they see the necessity to react to the variety in climate and natural disasters.
The livestock monitoring segment is anticipated to witness a substantial CAGR of 17.4% during the forecast period. This growth is due to the expansion of the market which occurs owing to the growing demand of consumers which relates to product quality, and traceability. The usage of connected agriculture solutions for monitoring indicates the quality of specific requirements that are necessary to track the micro-segments connected with livestock health and diet. Moreover, these control systems play a crucial role in improving human health by reducing the risk of salt, fat, and sugars in processed products such as meat, milk, eggs, and premium pricing.
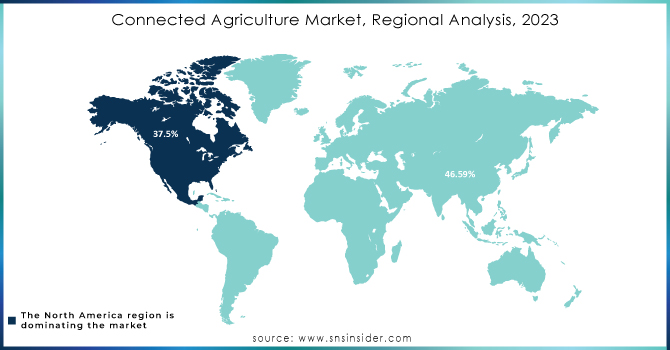
Regional Analysis
In 2023, North America dominated the connected agriculture market, generating more than 37.5% of the total revenue. The growth of the regional market is mainly attributed to the high penetration of advanced technologies and connectivity infrastructure. The high-speed internet is widespread, and IoT has access to strong connectivity, along with the continued development of networks in the region’s rural and agricultural areas.
The Asia Pacific market will grow at the highest CAGR of about 17.1% during the forecast period. The continuous population growth in the region implies an increased demand for food, and with food production, demand will emerge in an arable area, at a higher rate than expected. Governments in the Asia Pacific are fueling the adoption of smart agriculture through subsidized connectivity for farmers and grants and positive policies to reduce costs. In the case where the Indian government introduced the National Pest Surveillance System in August, the use of the system is based on farmers using their smartphones to communicate with agricultural experts. To improve the focus, the approach to pest control is based on science, with the help of AI to analyze pest data and provide the right time and accurate advice, rather than trying to include vendors of pesticides at the time.
Need any Customization Research on Connected Agriculture Market - Enquiry Now
Key Players
The major key players are
-
John Deere - (Precision Ag Software, Connected Farm Equipment)
-
Monsanto - (Seed Genetics, Climate-Smart Agriculture)
-
Bayer - (Crop Protection, Digital Farming Solutions)
-
Climate Corporation - (Weather Data Analytics, Insurance)
-
Telenav - (GPS Navigation, Field Mapping)
-
Trimble - (Precision Agriculture Equipment, Field Data Management)
-
Raven Industries - (Sprayers, Automated Steering)
-
Ag Leader Technology -(Yield Monitors, Guidance Systems)
-
Pessl Instruments - (Weather Stations, Soil Sensors)
-
FarmLogs -(Farm Management Software, Yield Analysis)
-
Granular - (Data Analytics, Farm Management Software)
-
Agribotix - (Drone Technology, Data Analysis)
-
Sentera -(Drone Technology, Plant Health Monitoring)
-
Blue River Technology - (Robotics, Weed Control)
-
Iron Ox - (Robotics, Indoor Farming)
-
Plenty - (Indoor Farming, Vertical Farming)
-
AeroFarms - (Indoor Farming, Vertical Farming)
-
CropX - (Soil Moisture Sensors, Data Analytics)
-
The Climate Corporation - (Weather Data Analytics, Insurance)
-
IBM Watson - (AI for Agriculture, Predictive Analytics)
Recent Developments
In August 2023, Trimble Inc. made available a versatile API for its Trimble Agriculture Cloud. This API enables external farming apps to integrate with Trimble Inc.'s devices and information, enhancing efficiency in agricultural activities.
| Report Attributes | Details |
| Market Size in 2023 | USD 4.7 billion |
| Market Size by 2032 | USD 17.6 billion |
| CAGR | CAGR of 16.0 % From 2024 to 2032 |
| Base Year | 2023 |
| Forecast Period | 2024-2032 |
| Historical Data | 2020-2022 |
| Report Scope & Coverage | Market Size, Segments Analysis, Competitive Landscape, Regional Analysis, DROC & SWOT Analysis, Forecast Outlook |
| Key Segments | • By Deployment (On-Premise, Cloud) • By Component (Solution, Services) • By Application (Livestock Monitoring, Precision Farming, Supply Chain Management, Others) |
| Regional Analysis/Coverage | North America (USA, Canada, Mexico), Europe (Germany, UK, France, Italy, Spain, Netherlands, Rest of Europe), Asia-Pacific (Japan, South Korea, China, India, Australia, Rest of Asia-Pacific), The Middle East & Africa (Israel, UAE, South Africa, Rest of Middle East & Africa), Latin America (Brazil, Argentina, Rest of Latin America) |
| Company Profiles | John Deere, Monsanto, Bayer, Climate Corporation, Telenav, Trimble, Raven Industries, Ag Leader Technology, Pessl Instruments, Others |
| Key Drivers |
•The growing global population is creating a demand for enhanced food production and thus, triggering the spread of smart farming. |
|
Restraints |
•The use of technology-related solutions that are developed by different vendors to serve common objectives may create compatibility issues which are both inefficient and unsustainable •For developing regions, there is an issue of lack of awareness that prevents the creation and exploitation of connected agricultural technologies. •Many farmers lack the necessary technical skills to operate and maintain connected agriculture systems effectively. |
Frequently Asked Questions
Ans. The forecast period for the Connected Agriculture Market is 2024-2032.
Ans: The North American region is dominating the Connected Agriculture Market.
Ans. The major players are Ag Leader Technology, AT&T, IBM, Orange Business Services, Decisive Farming, Accenture, Microsoft, SatSure, Iteris, Gamaya, LINK LABS., Deere & Company, SAP SE, Oracle, Trimble SMAG, Cisco, and others in the final report.
Ans: USD 4.98 billion in 2023 is the market share of the Connected Agriculture Market.
Ans: 12.97 % is the CAGR of the Connected Agriculture Market in the forecast period of 2024-2032.
Get in Touch
