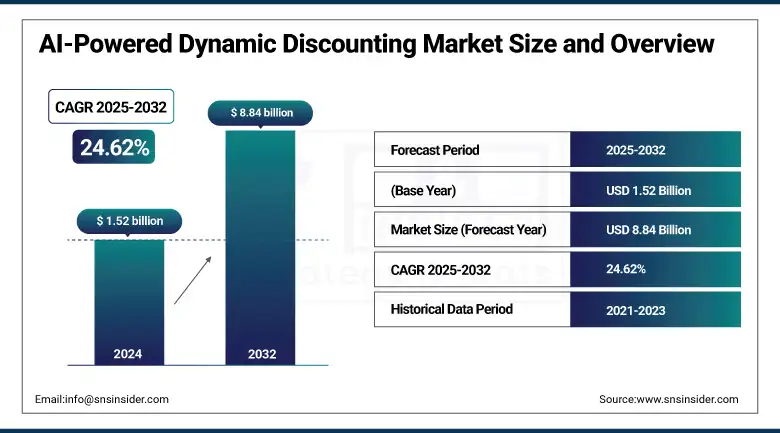
The AI-Powered Dynamic Discounting Market size was valued at USD 1.52 billion in 2024 and is expected to reach USD 8.84 billion by 2032, expanding at a CAGR of 24.62% over the forecast period of 2025-2032.
The AI-Powered Dynamic Discounting Market is emerging as organizations are adopting intelligent financial tools to optimize cash flow and maintain healthier supplier relationships. With AI, detect the payment terms in real-time and help the buyers to offer early payments to suppliers for a discount in return, while suppliers can get the funds faster. Due to its capacity to boost liquidity and automate decisions, this solution is becoming popular across BFSI, retail, manufacturing, and e-commerce domains. Using cloud-based technology is opening the door for micro-small and medium enterprises. Due to rapid fintech adoption, North America is leading, and Asia Pacific is the fastest-growing region. Innovators are SAP, Coupa, Oracle, Taulia, and C2FO.
According to AFP and Coupa, over 53% of global finance teams now use AI for decision-making, with 90% seeing improved outcomes. Coupa also reports AI-driven workflows deliver 5–15% savings and boost procurement visibility from 65% to 80%.
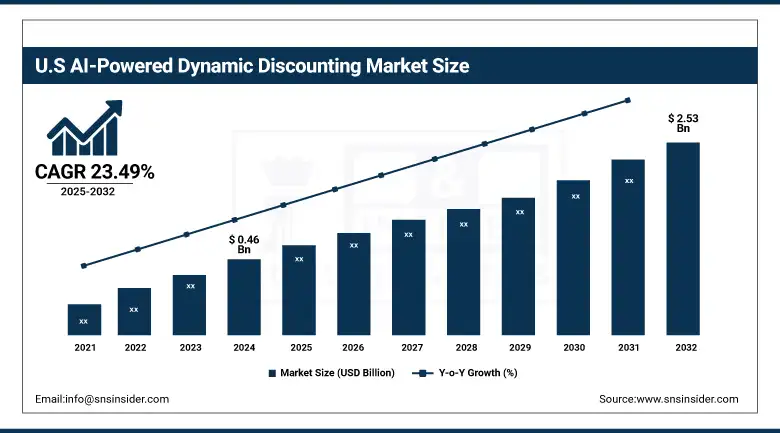
The U.S. AI-Powered Dynamic Discounting Market size reached USD 0.46 billion in 2024 and is expected to reach USD 2.53 billion by 2032 at a CAGR of 23.49% from 2025 to 2032.
The US accounts for a major share of the AI-Powered Dynamic Discounting Market due to its developed financial infrastructure, adoption of AI in procurement at an early stage, and the presence of a large number of fintech companies in this region. U.S. businesses are quickly transitioning to AI-based solutions to improve working capital, strengthen supplier relationships, and automate discounting processes. Big players such as Coupa, Oracle, and SAP have built strong platforms that serve both large enterprises and SMEs. In addition, friendly regulators and increased pressure to enhance liquidity in a low-interest rate environment are fuelling uptake. Cloud infrastructure and real-time analytics have become so persistent that market penetration is also very rapid, with the US leading the world in this space.
Drivers:
Rising Enterprise Demand for Working Capital Optimization Accelerates AI-Powered Discounting Solution Adoption Across Industries.
Enterprises across industries are increasingly leveraging AI-powered dynamic discounting platforms to optimize cash flow and strengthen supplier relationships. These solutions use machine learning to automate early payment decisions based on real-time financial data, improving liquidity and ROI. Growing pressure to enhance operational efficiency, especially in uncertain economic environments, has made dynamic discounting a strategic priority.
Recent developments include Oracle and Coupa enhancing AI capabilities in their procurement suites, enabling predictive discounting based on supplier behavior and market trends.
According to research, Coupa powers procurement for 55% of the Fortune 500® and manages over $8 trillion in spend data, delivering $260 billion in customer savings, signifying its vast market reach, data-driven scale, and value in AI-powered dynamic discounting solutions.
Restraints:
Concerns Over Data Privacy and System Integration Complexity Limit Broad-Based Adoption of Discounting Platforms.
Despite the promise of AI-powered discounting tools, organizations face challenges related to data security, supplier onboarding, and integration with legacy systems. The complexity of incorporating AI into existing ERP and procurement platforms often requires significant customization, leading to increased implementation time and cost. Additionally, some suppliers remain skeptical about digital discounting due to limited digital literacy or mistrust in automated financial decision-making. These barriers restrict market scalability, especially among SMEs and conservative verticals.
Opportunities:
AI Integration with Predictive Analytics and Blockchain Enhances Discounting Efficiency and Transparency Across Global Supply Chains.
The convergence of AI with predictive analytics and blockchain offers a significant growth opportunity for dynamic discounting solutions. AI can now forecast supplier behavior and recommend discount terms, while blockchain ensures transaction transparency and fraud prevention. This integration is attractive for global enterprises seeking secure, scalable discounting programs. Recent AI-powered dynamic discounting market trends include SAP and Tradeshift incorporating blockchain-based payment authentication and supplier scoring algorithms to ensure risk-aware discount offers.
Challenges:
Lack of Standardization Across Platforms Creates Integration and Compatibility Issues for Stakeholders.
A major challenge in the adoption of AI-powered dynamic discounting platforms is the absence of standard protocols for interoperability between different procurement, ERP, and financial platforms. This lack of standardization creates complications when integrating with supplier systems, leading to data silos and inefficient workflows. Additionally, inconsistent user interfaces and functionality across platforms reduce usability and adoption rates. For scalable deployment and broader industry adoption, platform providers must focus on building more standardized APIs, universal data models, and cross-system compatibility features.
By Component
The software component leads the AI-powered dynamic discounting market with a 67.58% revenue share in 2024. AI-powered dynamic discounting market companies such as Coupa, Oracle, and Truora have recently enhanced their platforms by integrating AI-driven predictive analytics, enabling real-time early payment recommendations and automated supplier scoring. The drive toward smarter, automated procurement processes propels the software segment. These advanced applications reduce manual intervention, improve liquidity forecasting, and reduce working capital costs.
Services, the fastest-growing segment with a projected CAGR of 25.44%, are gaining traction due to the complexity of implementing AI-based discounting. Consulting firms like Accenture and Deloitte now offer end-to-end deployment support and change management services. Coupa’s recent launch of managed services for dynamic discounting includes supplier enablement and performance optimization under subscription-based models. These services address integration challenges, data governance, and stakeholder training, core impediments to adoption.
By Deployment Mode
Cloud-based deployment dominates with a 73.48% share, supported by scalability, ease of integration, and subscription-friendly pricing. Market leaders such as SAP Ariba and Tradeshift have introduced multi-tenant, cloud-native, dynamic discounting suites with advanced AI analytics and dashboarding. These platforms enable secure, cross-geography roll-outs and faster updates, providing immediate access to supplier portals and analytics. The shift toward SaaS models reduces infrastructure costs and expedites time-to-value, while enabling continuous AI algorithm improvements.
On‑premises deployment is on track for the fastest CAGR of 25.87%, driven by security-sensitive sectors such as finance, healthcare, and government. Oracle and Basware have released enhanced on‑prem modules with locally hosted AI engines and advanced encryption features. These offerings allow organizations to maintain full control over critical financial data while leveraging predictive discounting capabilities. As enterprises grapple with data sovereignty, compliance, and internal IT control, demand for secure, offline solutions increases.
By Enterprise Size
Large enterprises commanded a 62.37% AI-powered dynamic discounting market share in 2024, boosted by complex supply chains, multilayered procurement processes, and significant working capital demands. SAP and Coupa introduced AI-powered dynamic discounting modules tailored to enterprise use cases, offering predictive modeling across global vendor networks and real-time ROI calculations. Large organizations have the IT capacity and budget to adopt advanced tools and to integrate across ERP, treasury, and procurement systems.
SMEs are projected to register a robust CAGR of 25.37%, driven by demand for accessible financing and cost management solutions. Providers like Taulia, Tipalti, and Kyriba launched SME-specific bundled solutions with AI-driven cashflow forecasting and flexible early-payment options. With simplified onboarding, lower fees, and mobile-enabled portals, these offerings encourage adoption among SMEs that previously lacked access to treasury-grade tech.
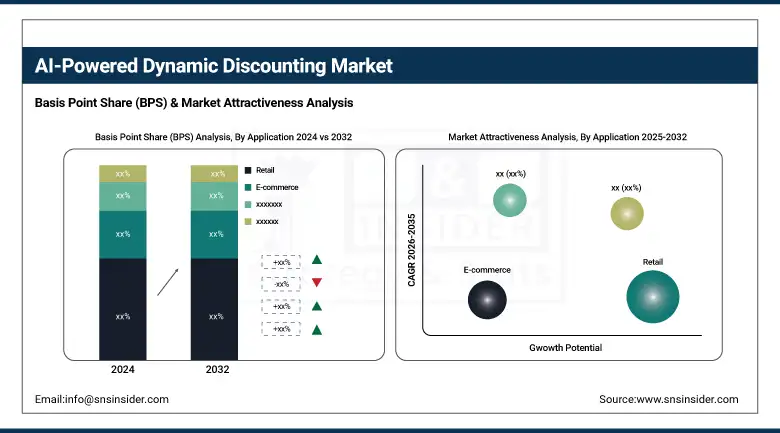
By Application
The retail sector holds a 30.27% share due to its high volume of supplier invoices and the strategic importance of vendor relationships. Oracle and Basware recently unveiled retail-focused AI tools that recommend early payment terms based on seasonal demand and supplier performance. These systems enable retailers to balance margin optimization and stock replenishment by capturing discounts and stabilizing costs during peak periods.
Manufacturing is the fastest-growing with a 25.95% CAGR, driven by increasing emphasis on just-in-time delivery and cost-sensitive production schedules. SAP and Tradeshift recently launched AI-enhanced discounting tools that assess production cycles, supplier lead times, and component pricing to optimize early-pay offers. Manufacturers benefit from improved supplier reliability and reduced material costs. As AI-powered dynamic discounting industry 4.0 expands, the integration of IoT and ERP-linked discounting systems enables real-time financial decision-making at the shop-floor level.
By End User
Buyers dominate with a 65.23% share, reflecting procurement departments' control over early payment decisions. Solutions from Coupa, Oracle, and SAP now feature buyer-centric dashboards that display real-time discount potential, supplier scoring, and cash-flow impact. AI-based recommendation engines help buyers forecast savings and streamline approval workflows. With buyers focused on maximising ROI and supplier engagement, dynamic discounting tools become a central procurement asset.
The supplier segment is rising at a CAGR of 25.39%, fueled by improved cash flow and transparency. Platforms like Taulia and Basware now offer supplier portals with AI-powered invoice-tracking, early payment forecasting, and finance term simulations. Enhanced onboarding and financial flexibility make the solution attractive to smaller suppliers. As access to affordable liquidity becomes more critical, especially for SMEs, the supplier segment emerges as a pivotal growth lever, fostering broader network-wide adoption of dynamic discounting.
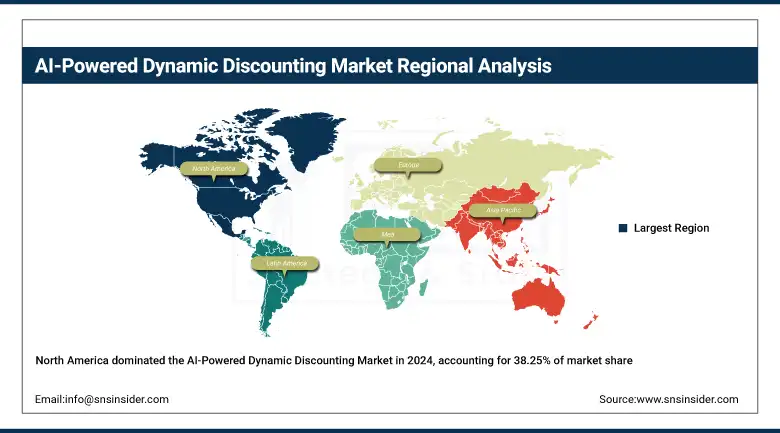
North America leads the AI-powered dynamic discounting market with a 38.25% share in 2024, driven by early technology adoption, robust digital procurement ecosystems, and financial automation in large enterprises. The presence of major vendors such as Coupa, Oracle, and SAP, combined with well-established supplier networks, fuels market maturity. The United States dominates the North American market due to its advanced fintech ecosystem, widespread ERP integration, and proactive AI adoption in procurement and treasury departments across large and mid-sized enterprises.
Europe is witnessing steady growth supported by strong regulatory frameworks, digital transformation across procurement, and sustainability-driven finance initiatives. Countries like Germany and France are modernizing their enterprise payment processes through AI-enabled solutions. Germany dominates the European region owing to its strong manufacturing sector, early Industry 4.0 initiatives, and widespread integration of AI-powered payment optimization tools in supply chain finance.
Asia Pacific is the fastest-growing region with a 27.58% share in 2024, led by increasing SME digitalization, e-commerce expansion, and rising working capital constraints in emerging economies. Countries in this region are adopting cloud-based financial solutions rapidly, especially in retail and manufacturing. China dominates Asia Pacific due to its expansive supplier ecosystem, government-led smart finance initiatives, and rapid AI deployment across supply chains and financial operations in both domestic and export-driven enterprises.
The Middle East & Africa and Latin America regions are witnessing the growing adoption of AI-powered dynamic discounting solutions, driven by ERP modernization, public-private fintech initiatives, and increasing demand for liquidity optimization. The UAE leads MEA with strong digital infrastructure and policy support, while Brazil dominates Latin America due to fintech maturity, SME digitalization, and rising cloud-based procurement adoption.
The major key players of the SAP SE, Coupa Software, C2FO, Taulia Inc., Tradeshift, Basware, Oracle Corporation, JAGGAER, PrimeRevenue, Kyriba, and others.
In November 2024, Cisco launched AI-native, secure Wi‑Fi 7 access points featuring adaptive, location-aware configurations and unified licensing, enabling seamless, scalable deployments across hybrid environments for improved wireless performance and enterprise agility.
In April 2025, Cisco launched its first outdoor Catalyst 6 GHz access point featuring Automated Frequency Coordination (AFC) and GPS-enabled antennas, enabling high-power 6 GHz wireless coverage tailored for enterprise and industrial environments.
Report Attributes | Details |
---|---|
Market Size in 2024 | USD 1.52 Billion |
Market Size by 2032 | USD 8.84 Billion |
CAGR | CAGR of 24.62% From 2025 to 2032 |
Base Year | 2024 |
Forecast Period | 2025-2032 |
Historical Data | 2021-2023 |
Report Scope & Coverage | Market Size, Segments Analysis, Competitive Landscape, Regional Analysis, DROC & SWOT Analysis, Forecast Outlook |
Key Segments | •By Component (Software, Services) •By Deployment Mode (Cloud, On-Premises) •By Enterprise Size (Small and Medium Enterprises, Large Enterprises) •By Application (Retail, E-commerce, BFSI, Manufacturing, Healthcare, IT and Telecommunications, Others) •By End-User (Suppliers, Buyers) |
Regional Analysis/Coverage | North America (US, Canada, Mexico), Europe (Germany, France, UK, Italy, Spain, Poland, Turkey, Rest of Europe), Asia Pacific (China, India, Japan, South Korea, Singapore, Australia, Rest of Asia Pacific), Middle East & Africa (UAE, Saudi Arabia, Qatar, South Africa, Rest of Middle East & Africa), Latin America (Brazil, Argentina, Rest of Latin America) |
Company Profiles | SAP SE, Coupa Software, C2FO, Taulia Inc., Tradeshift, Basware, Oracle Corporation, JAGGAER, PrimeRevenue, Kyriba |
Ans: The AI-Powered Dynamic Discounting Market is expected to grow at a CAGR of 24.62% from 2025-2032.
Ans: The AI-Powered Dynamic Discounting Market size was USD 1.52 billion in 2024 and is expected to reach USD 8.84 billion by 2032.
Ans: The major growth factor of the AI-Powered Dynamic Discounting Market is the increasing demand for real-time, data-driven pricing strategies to optimize cash flow and strengthen supplier-buyer relationships.
Ans: The software segment dominated the AI-Powered Dynamic Discounting Market.
Ans: North America dominated the AI-Powered Dynamic Discounting Market in 2024.
Table of Contents:
1. Introduction
1.1 Market Definition
1.2 Scope (Inclusion and Exclusions)
1.3 Research Assumptions
2. Executive Summary
2.1 Market Overview
2.2 Regional Synopsis
2.3 Competitive Summary
3. Research Methodology
3.1 Top-Down Approach
3.2 Bottom-up Approach
3.3. Data Validation
3.4 Primary Interviews
4. Market Dynamics Impact Analysis
4.1 Market Driving Factors Analysis
4.1.1 Drivers
4.1.2 Restraints
4.2 PESTLE Analysis
4.3 Porter’s Five Forces Model
5. Statistical Insights and Trends Reporting
5.1 Supplier Enablement Efficiency
5.2 Predictive Accuracy of AI Algorithms
5.3 Discount Capture Rate
5.4 Invoice Processing Time Reduction
5.5 Invoice Processing Time Reduction
5.7 Supplier Retention Metrics
6. Competitive Landscape
6.1 List of Major Companies, By Region
6.2 Market Share Analysis, By Region
6.3 Product Benchmarking
6.3.1 Product specifications and features
6.3.2 Pricing
6.4 Strategic Initiatives
6.4.1 Marketing and promotional activities
6.4.2 Distribution and supply chain strategies
6.4.3 Expansion plans and new product launches
6.4.4 Strategic partnerships and collaborations
6.5 Technological Advancements
6.6 Market Positioning and Branding
7. AI-Powered Dynamic Discounting Market Segmentation, By Component
7.1 Chapter Overview
7.2 Software
7.2.1 Software Market Trends Analysis (2021-2032)
7.2.2 Software Market Size Estimates and Forecasts to 2032 (USD Billion)
7.3 Services
7.3.1 Services Market Trends Analysis (2021-2032)
7.3.2 Services Market Size Estimates and Forecasts to 2032 (USD Billion)
8. AI-Powered Dynamic Discounting Market Segmentation, By Enterprise Size
8.1 Chapter Overview
8.2 Small and Medium Enterprises
8.2.1 Small and Medium Enterprises Market Trends Analysis (2021-2032)
8.2.2 Small and Medium Enterprises Market Size Estimates And Forecasts To 2032 (USD Billion)
8.3 Large Enterprises
8.3.1 Large Enterprises Market Trends Analysis (2021-2032)
8.3.2 Large Enterprises Market Size Estimates And Forecasts To 2032 (USD Billion)
9. AI-Powered Dynamic Discounting Market Segmentation, By Application
9.1 Chapter Overview
9.2 Retail
9.2.1 Retail Market Trends Analysis (2021-2032)
9.2.2 Retail Market Size Estimates And Forecasts To 2032 (USD Billion)
9.3 E-commerce
9.3.1 E-commerce Market Trends Analysis (2021-2032)
9.3.2 E-commerce Market Size Estimates And Forecasts To 2032 (USD Billion)
9.4 BFSI
9.4.1 BFSI Market Trends Analysis (2021-2032)
9.4.2 BFSI Market Size Estimates And Forecasts To 2032 (USD Billion)
9.5 Manufacturing
9.5.1 Manufacturing Market Trends Analysis (2021-2032)
9.5.2 Manufacturing Market Size Estimates And Forecasts To 2032 (USD Billion)
9.6 Healthcare
9.6.1 Healthcare Market Trends Analysis (2021-2032)
9.6.2 Healthcare Market Size Estimates And Forecasts To 2032 (USD Billion)
9.7 IT and Telecommunications
9.7.1 IT and Telecommunications Market Trends Analysis (2021-2032)
9.7.2 IT and Telecommunications Market Size Estimates And Forecasts To 2032 (USD Billion)
9.8 Others
9.8.1 Others Market Trends Analysis (2021-2032)
9.8.2 Others Market Size Estimates And Forecasts To 2032 (USD Billion)
10. AI-Powered Dynamic Discounting Market Segmentation, By Deployment Mode
10.1 Chapter Overview
10.2 Cloud
10.2.1 Cloud Market Trends Analysis (2021-2032)
10.2.2 Cloud Market Size Estimates And Forecasts To 2032 (USD Billion)
10.3 On-premises
10.3.1 On-premises Market Trends Analysis (2021-2032)
10.3.2 On-premises Market Size Estimates And Forecasts To 2032 (USD Billion)
11. AI-Powered Dynamic Discounting Market Segmentation, By End-User
11.1 Chapter Overview
11.2 Suppliers
11.2.1 Suppliers Market Trends Analysis (2021-2032)
11.2.2 Suppliers Market Size Estimates And Forecasts To 2032 (USD Billion)
11.3 Buyers
11.3.1 Buyers’ Market Trends Analysis (2021-2032)
11.3.2 Buyers’ Market Size Estimates And Forecasts To 2032 (USD Billion)
12. Regional Analysis
12.1 Chapter Overview
12.2 North America
12.2.1 Trends Analysis
12.2.2 North America AI-Powered Dynamic Discounting Market Estimates And Forecasts, By Country (2021-2032) (USD Billion)
12.2.3 North America AI-Powered Dynamic Discounting Market Estimates And Forecasts, By Component (2021-2032) (USD Billion)
12.2.4 North America AI-Powered Dynamic Discounting Market Estimates And Forecasts, By Enterprise Size (2021-2032) (USD Billion)
12.2.5 North America AI-Powered Dynamic Discounting Market Estimates And Forecasts, By Application (2021-2032) (USD Billion)
12.2.6 North America AI-Powered Dynamic Discounting Market Estimates And Forecasts, By Deployment Mode (2021-2032) (USD Billion)
12.2.7 North America AI-Powered Dynamic Discounting Market Estimates And Forecasts, By End-User (2021-2032) (USD Billion)
12.2.8 USA
12.2.8.1 USA AI-Powered Dynamic Discounting Market Estimates And Forecasts, By Component (2021-2032) (USD Billion)
12.2.8.2 USA AI-Powered Dynamic Discounting Market Estimates And Forecasts, By Enterprise Size (2021-2032) (USD Billion)
12.2.8.3 USA AI-Powered Dynamic Discounting Market Estimates And Forecasts, By Application (2021-2032) (USD Billion)
12.2.8.4 USA AI-Powered Dynamic Discounting Market Estimates And Forecasts, By Deployment Mode (2021-2032) (USD Billion)
12.2.8.5 USA AI-Powered Dynamic Discounting Market Estimates And Forecasts, By End-User (2021-2032) (USD Billion)
12.2.9 Canada
12.2.9.1 Canada AI-Powered Dynamic Discounting Market Estimates And Forecasts, By Component (2021-2032) (USD Billion)
12.2.9.2 Canada AI-Powered Dynamic Discounting Market Estimates And Forecasts, By Enterprise Size (2021-2032) (USD Billion)
12.2.9.3 Canada AI-Powered Dynamic Discounting Market Estimates And Forecasts, By Application (2021-2032) (USD Billion)
12.2.9.4 Canada AI-Powered Dynamic Discounting Market Estimates And Forecasts, By Deployment Mode (2021-2032) (USD Billion)
12.2.9.5 Canada AI-Powered Dynamic Discounting Market Estimates And Forecasts, By End-User (2021-2032) (USD Billion)
12.2.10 Mexico
12.2.10.1 Mexico AI-Powered Dynamic Discounting Market Estimates And Forecasts, By Component (2021-2032) (USD Billion)
12.2.10.2 Mexico AI-Powered Dynamic Discounting Market Estimates And Forecasts, By Enterprise Size (2021-2032) (USD Billion)
12.2.10.3 Mexico AI-Powered Dynamic Discounting Market Estimates And Forecasts, By Application (2021-2032) (USD Billion)
12.2.10.4 Mexico AI-Powered Dynamic Discounting Market Estimates And Forecasts, By Deployment Mode (2021-2032) (USD Billion)
12.2.10.5 Mexico AI-Powered Dynamic Discounting Market Estimates And Forecasts, By End-User (2021-2032) (USD Billion)
12.3 Europe
12.3.1 Trends Analysis
12.3.2 Europe AI-Powered Dynamic Discounting Market Estimates And Forecasts, By Country (2021-2032) (USD Billion)
12.3.3 Europe AI-Powered Dynamic Discounting Market Estimates And Forecasts, By Component (2021-2032) (USD Billion)
12.3.4 Europe AI-Powered Dynamic Discounting Market Estimates And Forecasts, By Enterprise Size (2021-2032) (USD Billion)
12.3.5 Europe AI-Powered Dynamic Discounting Market Estimates And Forecasts, By Application (2021-2032) (USD Billion)
12.3.6 Europe AI-Powered Dynamic Discounting Market Estimates And Forecasts, By Deployment Mode (2021-2032) (USD Billion)
12.3.7 Europe AI-Powered Dynamic Discounting Market Estimates And Forecasts, By End-User (2021-2032) (USD Billion)
12.3.8 Poland
12.3.8.1 Poland AI-Powered Dynamic Discounting Market Estimates And Forecasts, By Component (2021-2032) (USD Billion)
12.3.8.2 Poland AI-Powered Dynamic Discounting Market Estimates And Forecasts, By Enterprise Size (2021-2032) (USD Billion)
12.3.8.3 Poland AI-Powered Dynamic Discounting Market Estimates And Forecasts, By Application (2021-2032) (USD Billion)
12.3.8.4 Poland AI-Powered Dynamic Discounting Market Estimates And Forecasts, By Deployment Mode (2021-2032) (USD Billion)
12.3.8.5 Poland AI-Powered Dynamic Discounting Market Estimates And Forecasts, By End-User (2021-2032) (USD Billion)
12.3.9 Turkey
12.3.9.1 Turkey AI-Powered Dynamic Discounting Market Estimates And Forecasts, By Component (2021-2032) (USD Billion)
12.3.9.2 Turkey AI-Powered Dynamic Discounting Market Estimates And Forecasts, By Enterprise Size (2021-2032) (USD Billion)
12.3.9.3 Turkey AI-Powered Dynamic Discounting Market Estimates And Forecasts, By Application (2021-2032) (USD Billion)
12.3.9.4 Turkey AI-Powered Dynamic Discounting Market Estimates And Forecasts, By Deployment Mode (2021-2032) (USD Billion)
12.3.9.5 Turkey AI-Powered Dynamic Discounting Market Estimates And Forecasts, By End-User (2021-2032) (USD Billion)
12.3.10 Germany
12.3.10.1 Germany AI-Powered Dynamic Discounting Market Estimates And Forecasts, By Component (2021-2032) (USD Billion)
12.3.10.2 Germany AI-Powered Dynamic Discounting Market Estimates And Forecasts, By Enterprise Size (2021-2032) (USD Billion)
12.3.10.3 Germany AI-Powered Dynamic Discounting Market Estimates And Forecasts, By Application (2021-2032) (USD Billion)
12.3.10.4 Germany AI-Powered Dynamic Discounting Market Estimates And Forecasts, By Deployment Mode (2021-2032) (USD Billion)
12.3.10.5 Germany AI-Powered Dynamic Discounting Market Estimates And Forecasts, By End-User (2021-2032) (USD Billion)
12.3.11 France
12.3.11.1 France AI-Powered Dynamic Discounting Market Estimates And Forecasts, By Component (2021-2032) (USD Billion)
12.3.11.2 France AI-Powered Dynamic Discounting Market Estimates And Forecasts, By Enterprise Size (2021-2032) (USD Billion)
12.3.11.3 France AI-Powered Dynamic Discounting Market Estimates And Forecasts, By Application (2021-2032) (USD Billion)
12.3.11.4 France AI-Powered Dynamic Discounting Market Estimates And Forecasts, By Deployment Mode (2021-2032) (USD Billion)
12.3.11.5 France AI-Powered Dynamic Discounting Market Estimates And Forecasts, By End-User (2021-2032) (USD Billion)
12.3.12 UK
12.3.12.1 UK AI-Powered Dynamic Discounting Market Estimates And Forecasts, By Component (2021-2032) (USD Billion)
12.3.12.2 UK AI-Powered Dynamic Discounting Market Estimates And Forecasts, By Enterprise Size (2021-2032) (USD Billion)
12.3.12.3 UK AI-Powered Dynamic Discounting Market Estimates And Forecasts, By Application (2021-2032) (USD Billion)
12.3.12.4 UK AI-Powered Dynamic Discounting Market Estimates And Forecasts, By Deployment Mode (2021-2032) (USD Billion)
12.3.12.5 UK AI-Powered Dynamic Discounting Market Estimates And Forecasts, By End-User (2021-2032) (USD Billion)
12.3.13 Italy
12.3.13.1 Italy AI-Powered Dynamic Discounting Market Estimates And Forecasts, By Component (2021-2032) (USD Billion)
12.3.13.2 Italy AI-Powered Dynamic Discounting Market Estimates And Forecasts, By Enterprise Size (2021-2032) (USD Billion)
12.3.13.3 Italy AI-Powered Dynamic Discounting Market Estimates And Forecasts, By Application (2021-2032) (USD Billion)
12.3.13.4 Italy AI-Powered Dynamic Discounting Market Estimates And Forecasts, By Deployment Mode (2021-2032) (USD Billion)
12.3.13.5 Italy AI-Powered Dynamic Discounting Market Estimates And Forecasts, By End-User (2021-2032) (USD Billion)
12.3.14 Spain
12.3.14.1 Spain AI-Powered Dynamic Discounting Market Estimates And Forecasts, By Component (2021-2032) (USD Billion)
12.3.14.2 Spain AI-Powered Dynamic Discounting Market Estimates And Forecasts, By Enterprise Size (2021-2032) (USD Billion)
12.3.14.3 Spain AI-Powered Dynamic Discounting Market Estimates And Forecasts, By Application (2021-2032) (USD Billion)
12.3.14.4 Spain AI-Powered Dynamic Discounting Market Estimates And Forecasts, By Deployment Mode (2021-2032) (USD Billion)
12.3.14.5 Spain AI-Powered Dynamic Discounting Market Estimates And Forecasts, By End-User (2021-2032) (USD Billion)
12.3.15 Rest Of Europe
12.3.15.1 Rest Of Western Europe AI-Powered Dynamic Discounting Market Estimates And Forecasts, By Component (2021-2032) (USD Billion)
12.3.15.2 Rest Of Western Europe AI-Powered Dynamic Discounting Market Estimates And Forecasts, By Enterprise Size (2021-2032) (USD Billion)
12.3.15.3 Rest Of Western Europe AI-Powered Dynamic Discounting Market Estimates And Forecasts, By Application (2021-2032) (USD Billion)
12.3.15.4 Rest Of Western Europe AI-Powered Dynamic Discounting Market Estimates And Forecasts, By Deployment Mode (2021-2032) (USD Billion)
12.3.15.5 Rest Of Western Europe AI-Powered Dynamic Discounting Market Estimates And Forecasts, By End-User (2021-2032) (USD Billion)
12.4 Asia Pacific
12.4.1 Trends Analysis
12.4.2 Asia Pacific AI-Powered Dynamic Discounting Market Estimates And Forecasts, By Country (2021-2032) (USD Billion)
12.4.3 Asia Pacific AI-Powered Dynamic Discounting Market Estimates And Forecasts, By Component (2021-2032) (USD Billion)
12.4.4 Asia Pacific AI-Powered Dynamic Discounting Market Estimates And Forecasts, By Enterprise Size (2021-2032) (USD Billion)
12.4.5 Asia Pacific AI-Powered Dynamic Discounting Market Estimates And Forecasts, By Application (2021-2032) (USD Billion)
12.4.6 Asia Pacific AI-Powered Dynamic Discounting Market Estimates And Forecasts, By Deployment Mode (2021-2032) (USD Billion)
12.4.7 Asia Pacific AI-Powered Dynamic Discounting Market Estimates And Forecasts, By End-User (2021-2032) (USD Billion)
12.4.8 China
12.4.8.1 China AI-Powered Dynamic Discounting Market Estimates And Forecasts, By Component (2021-2032) (USD Billion)
12.4.8.2 China AI-Powered Dynamic Discounting Market Estimates And Forecasts, By Enterprise Size (2021-2032) (USD Billion)
12.4.8.3 China AI-Powered Dynamic Discounting Market Estimates And Forecasts, By Application (2021-2032) (USD Billion)
12.4.8.4 China AI-Powered Dynamic Discounting Market Estimates And Forecasts, By Deployment Mode (2021-2032) (USD Billion)
12.4.8.5 China AI-Powered Dynamic Discounting Market Estimates And Forecasts, By End-User (2021-2032) (USD Billion)
12.4.9 India
12.4.9.1 India AI-Powered Dynamic Discounting Market Estimates And Forecasts, By Component (2021-2032) (USD Billion)
12.4.9.2 India AI-Powered Dynamic Discounting Market Estimates And Forecasts, By Enterprise Size (2021-2032) (USD Billion)
12.4.9.3 India AI-Powered Dynamic Discounting Market Estimates And Forecasts, By Application (2021-2032) (USD Billion)
12.4.9.4 India AI-Powered Dynamic Discounting Market Estimates And Forecasts, By Deployment Mode (2021-2032) (USD Billion)
12.4.9.5 India AI-Powered Dynamic Discounting Market Estimates And Forecasts, By End-User (2021-2032) (USD Billion)
12.4.10 Japan
12.4.10.1 Japan AI-Powered Dynamic Discounting Market Estimates And Forecasts, By Component (2021-2032) (USD Billion)
12.4.10.2 Japan AI-Powered Dynamic Discounting Market Estimates And Forecasts, By Enterprise Size (2021-2032) (USD Billion)
12.4.10.3 Japan AI-Powered Dynamic Discounting Market Estimates And Forecasts, By Application (2021-2032) (USD Billion)
12.4.10.4 Japan AI-Powered Dynamic Discounting Market Estimates And Forecasts, By Deployment Mode (2021-2032) (USD Billion)
12.4.10.5 Japan AI-Powered Dynamic Discounting Market Estimates And Forecasts, By End-User (2021-2032) (USD Billion)
12.4.11 South Korea
12.4.11.1 South Korea AI-Powered Dynamic Discounting Market Estimates And Forecasts, By Component (2021-2032) (USD Billion)
12.4.11.2 South Korea AI-Powered Dynamic Discounting Market Estimates And Forecasts, By Enterprise Size (2021-2032) (USD Billion)
12.4.11.3 South Korea AI-Powered Dynamic Discounting Market Estimates And Forecasts, By Application (2021-2032) (USD Billion)
12.4.11.4 South Korea AI-Powered Dynamic Discounting Market Estimates And Forecasts, By Deployment Mode (2021-2032) (USD Billion)
12.4.11.5 South Korea AI-Powered Dynamic Discounting Market Estimates And Forecasts, By End-User (2021-2032) (USD Billion)
12.4.12 Singapore
12.4.12.1 Singapore AI-Powered Dynamic Discounting Market Estimates And Forecasts, By Component (2021-2032) (USD Billion)
12.4.12.2 Singapore AI-Powered Dynamic Discounting Market Estimates And Forecasts, By Enterprise Size (2021-2032) (USD Billion)
12.4.12.3 Singapore AI-Powered Dynamic Discounting Market Estimates And Forecasts, By Application (2021-2032) (USD Billion)
12.4.12.4 Singapore AI-Powered Dynamic Discounting Market Estimates And Forecasts, By Deployment Mode (2021-2032) (USD Billion)
12.4.12.5 Singapore AI-Powered Dynamic Discounting Market Estimates And Forecasts, By End-User (2021-2032) (USD Billion)
12.4.13 Australia
12.4.13.1 Australia AI-Powered Dynamic Discounting Market Estimates And Forecasts, By Component (2021-2032) (USD Billion)
12.4.13.2 Australia AI-Powered Dynamic Discounting Market Estimates And Forecasts, By Enterprise Size (2021-2032) (USD Billion)
12.4.13.3 Australia AI-Powered Dynamic Discounting Market Estimates And Forecasts, By Application (2021-2032) (USD Billion)
12.4.13.4 Australia AI-Powered Dynamic Discounting Market Estimates And Forecasts, By Deployment Mode (2021-2032) (USD Billion)
12.4.13.5 Australia AI-Powered Dynamic Discounting Market Estimates And Forecasts, By End-User (2021-2032) (USD Billion)
12.4.14 Rest Of Asia Pacific
12.4.14.1 Rest Of Asia Pacific AI-Powered Dynamic Discounting Market Estimates And Forecasts, By Component (2021-2032) (USD Billion)
12.4.14.2 Rest Of Asia Pacific AI-Powered Dynamic Discounting Market Estimates And Forecasts, By Enterprise Size (2021-2032) (USD Billion)
12.4.14.3 Rest Of Asia Pacific AI-Powered Dynamic Discounting Market Estimates And Forecasts, By Application (2021-2032) (USD Billion)
12.4.14.4 Rest Of Asia Pacific AI-Powered Dynamic Discounting Market Estimates And Forecasts, By Deployment Mode (2021-2032) (USD Billion)
12.4.14.5 Rest Of Asia Pacific AI-Powered Dynamic Discounting Market Estimates And Forecasts, By End-User (2021-2032) (USD Billion)
12.5 Middle East And Africa
12.5.1 Trends Analysis
12.5.2 Middle East And Africa AI-Powered Dynamic Discounting Market Estimates And Forecasts, By Country (2021-2032) (USD Billion)
12.5.3 Middle East And Africa AI-Powered Dynamic Discounting Market Estimates And Forecasts, By Component (2021-2032) (USD Billion)
12.5.4 Middle East And Africa AI-Powered Dynamic Discounting Market Estimates And Forecasts, By Enterprise Size (2021-2032) (USD Billion)
12.5.5 Middle East And Africa AI-Powered Dynamic Discounting Market Estimates And Forecasts, By Application (2021-2032) (USD Billion)
12.5.6 Middle East And Africa AI-Powered Dynamic Discounting Market Estimates And Forecasts, By Deployment Mode (2021-2032) (USD Billion)
12.5.7 Middle East And Africa AI-Powered Dynamic Discounting Market Estimates And Forecasts, By End-User (2021-2032) (USD Billion)
12.5.8 UAE
12.5.8.1 UAE AI-Powered Dynamic Discounting Market Estimates And Forecasts, By Component (2021-2032) (USD Billion)
12.5.8.2 UAE AI-Powered Dynamic Discounting Market Estimates And Forecasts, By Enterprise Size (2021-2032) (USD Billion)
12.5.8.3 UAE AI-Powered Dynamic Discounting Market Estimates And Forecasts, By Application (2021-2032) (USD Billion)
12.5.8.4 UAE AI-Powered Dynamic Discounting Market Estimates And Forecasts, By Deployment Mode (2021-2032) (USD Billion)
12.5.8.5 UAE AI-Powered Dynamic Discounting Market Estimates And Forecasts, By End-User (2021-2032) (USD Billion)
12.5.9 Saudi Arabia
12.5.9.1 Saudi Arabia AI-Powered Dynamic Discounting Market Estimates And Forecasts, By Component (2021-2032) (USD Billion)
12.5.9.2 Saudi Arabia AI-Powered Dynamic Discounting Market Estimates And Forecasts, By Enterprise Size (2021-2032) (USD Billion)
12.5.9.3 Saudi Arabia AI-Powered Dynamic Discounting Market Estimates And Forecasts, By Application (2021-2032) (USD Billion)
12.5.9.4 Saudi Arabia AI-Powered Dynamic Discounting Market Estimates And Forecasts, By Deployment Mode (2021-2032) (USD Billion)
12.5.9.5 Saudi Arabia AI-Powered Dynamic Discounting Market Estimates And Forecasts, By End-User (2021-2032) (USD Billion)
12.5.10 Qatar
12.5.10.1 Qatar AI-Powered Dynamic Discounting Market Estimates And Forecasts, By Component (2021-2032) (USD Billion)
12.5.10.2 Qatar AI-Powered Dynamic Discounting Market Estimates And Forecasts, By Enterprise Size (2021-2032) (USD Billion)
12.5.10.3 Qatar AI-Powered Dynamic Discounting Market Estimates And Forecasts, By Application (2021-2032) (USD Billion)
12.5.10.4 Qatar AI-Powered Dynamic Discounting Market Estimates And Forecasts, By Deployment Mode (2021-2032) (USD Billion)
12.5.10.5 Qatar AI-Powered Dynamic Discounting Market Estimates And Forecasts, By End-User (2021-2032) (USD Billion)
12.5.11 South Africa
12.5.11.1 South Africa AI-Powered Dynamic Discounting Market Estimates And Forecasts, By Component (2021-2032) (USD Billion)
12.5.11.2 South Africa AI-Powered Dynamic Discounting Market Estimates And Forecasts, By Enterprise Size (2021-2032) (USD Billion)
12.5.11.3 South Africa AI-Powered Dynamic Discounting Market Estimates And Forecasts, By Application (2021-2032) (USD Billion)
12.5.11.4 South Africa AI-Powered Dynamic Discounting Market Estimates And Forecasts, By Deployment Mode (2021-2032) (USD Billion)
12.5.11.5 South Africa AI-Powered Dynamic Discounting Market Estimates And Forecasts, By End-User (2021-2032) (USD Billion)
12.5.12 Rest Of Africa
12.5.12.1 Rest Of Africa AI-Powered Dynamic Discounting Market Estimates And Forecasts, By Component (2021-2032) (USD Billion)
12.5.12.2 Rest Of Africa AI-Powered Dynamic Discounting Market Estimates And Forecasts, By Enterprise Size (2021-2032) (USD Billion)
12.5.12.3 Rest Of Africa AI-Powered Dynamic Discounting Market Estimates And Forecasts, By Application (2021-2032) (USD Billion)
12.5.12.4 Rest Of Africa AI-Powered Dynamic Discounting Market Estimates And Forecasts, By Deployment Mode (2021-2032) (USD Billion)
12.5.12.5 Rest Of Africa AI-Powered Dynamic Discounting Market Estimates And Forecasts, By End-User (2021-2032) (USD Billion)
12.6 Latin America
12.6.1 Trends Analysis
12.6.2 Latin America AI-Powered Dynamic Discounting Market Estimates And Forecasts, By Country (2021-2032) (USD Billion)
12.6.3 Latin America AI-Powered Dynamic Discounting Market Estimates And Forecasts, By Component (2021-2032) (USD Billion)
12.6.4 Latin America AI-Powered Dynamic Discounting Market Estimates And Forecasts, By Enterprise Size (2021-2032) (USD Billion)
12.6.5 Latin America AI-Powered Dynamic Discounting Market Estimates And Forecasts, By Application (2021-2032) (USD Billion)
12.6.6 Latin America AI-Powered Dynamic Discounting Market Estimates And Forecasts, By Deployment Mode (2021-2032) (USD Billion)
12.6.7 Latin America AI-Powered Dynamic Discounting Market Estimates And Forecasts, By End-User (2021-2032) (USD Billion)
12.6.8 Brazil
12.6.8.1 Brazil AI-Powered Dynamic Discounting Market Estimates And Forecasts, By Component (2021-2032) (USD Billion)
12.6.8.2 Brazil AI-Powered Dynamic Discounting Market Estimates And Forecasts, By Enterprise Size (2021-2032) (USD Billion)
12.6.8.3 Brazil AI-Powered Dynamic Discounting Market Estimates And Forecasts, By Application (2021-2032) (USD Billion)
12.6.8.4 Brazil AI-Powered Dynamic Discounting Market Estimates And Forecasts, By Deployment Mode (2021-2032) (USD Billion)
12.6.8.5 Brazil AI-Powered Dynamic Discounting Market Estimates And Forecasts, By End-User (2021-2032) (USD Billion)
12.6.9 Argentina
12.6.9.1 Argentina AI-Powered Dynamic Discounting Market Estimates And Forecasts, By Component (2021-2032) (USD Billion)
12.6.9.2 Argentina AI-Powered Dynamic Discounting Market Estimates And Forecasts, By Enterprise Size (2021-2032) (USD Billion)
12.6.9.3 Argentina AI-Powered Dynamic Discounting Market Estimates And Forecasts, By Application (2021-2032) (USD Billion)
12.6.9.4 Argentina AI-Powered Dynamic Discounting Market Estimates And Forecasts, By Deployment Mode (2021-2032) (USD Billion)
12.6.9.5 Argentina AI-Powered Dynamic Discounting Market Estimates And Forecasts, By End-User (2021-2032) (USD Billion)
12.6.10 Rest Of Latin America
12.6.10.1 Rest Of Latin America AI-Powered Dynamic Discounting Market Estimates And Forecasts, By Component (2021-2032) (USD Billion)
12.6.10.2 Rest Of Latin America AI-Powered Dynamic Discounting Market Estimates And Forecasts, By Enterprise Size (2021-2032) (USD Billion)
12.6.10.3 Rest Of Latin America AI-Powered Dynamic Discounting Market Estimates And Forecasts, By Application (2021-2032) (USD Billion)
12.6.10.4 Rest Of Latin America AI-Powered Dynamic Discounting Market Estimates And Forecasts, By Deployment Mode (2021-2032) (USD Billion)
12.6.10.5 Rest Of Latin America AI-Powered Dynamic Discounting Market Estimates And Forecasts, By End-User (2021-2032) (USD Billion)
13. Company Profiles
13.1 SAP SE
13.1.1 Company Overview
13.1.2 Financial
13.1.3 Products/ Services Offered
13.1.4 SWOT Analysis
13.2 Coupa Software
13.2.1 Company Overview
13.2.2 Financial
13.2.3 Products/ Services Offered
13.2.4 SWOT Analysis
13.3 C2FO
13.3.1 Company Overview
13.3.2 Financial
13.3.3 Products/ Services Offered
13.3.4 SWOT Analysis
13.4 Taulia Inc.
13.4.1 Company Overview
13.4.2 Financial
13.4.3 Products/ Services Offered
13.4.4 SWOT Analysis
13.5 Tradeshift
13.5.1 Company Overview
13.5.2 Financial
13.5.3 Products/ Services Offered
13.5.4 SWOT Analysis
13.6 Basware
13.6.1 Company Overview
13.6.2 Financial
13.6.3 Products/ Services Offered
13.6.4 SWOT Analysis
13.7 Oracle Corporation
13.7.1 Company Overview
13.7.2 Financial
13.7.3 Products/ Services Offered
13.7.4 SWOT Analysis
13.8 JAGGAER
13.8.1 Company Overview
13.8.2 Financial
13.8.3 Products/ Services Offered
13.8.4 SWOT Analysis
13.9 PrimeRevenue
13.9.1 Company Overview
13.9.2 Financial
13.9.3 Products/ Services Offered
13.9.4 SWOT Analysis
13.10 Kyriba
13.10.1 Company Overview
13.10.2 Financial
13.10.3 Products/ Services Offered
13.10.4 SWOT Analysis
14. Use Cases and Best Practices
15. Conclusion
An accurate research report requires proper strategizing as well as implementation. There are multiple factors involved in the completion of good and accurate research report and selecting the best methodology to compete the research is the toughest part. Since the research reports we provide play a crucial role in any company’s decision-making process, therefore we at SNS Insider always believe that we should choose the best method which gives us results closer to reality. This allows us to reach at a stage wherein we can provide our clients best and accurate investment to output ratio.
Each report that we prepare takes a timeframe of 350-400 business hours for production. Starting from the selection of titles through a couple of in-depth brain storming session to the final QC process before uploading our titles on our website we dedicate around 350 working hours. The titles are selected based on their current market cap and the foreseen CAGR and growth.
The 5 steps process:
Step 1: Secondary Research:
Secondary Research or Desk Research is as the name suggests is a research process wherein, we collect data through the readily available information. In this process we use various paid and unpaid databases which our team has access to and gather data through the same. This includes examining of listed companies’ annual reports, Journals, SEC filling etc. Apart from this our team has access to various associations across the globe across different industries. Lastly, we have exchange relationships with various university as well as individual libraries.
Step 2: Primary Research
When we talk about primary research, it is a type of study in which the researchers collect relevant data samples directly, rather than relying on previously collected data. This type of research is focused on gaining content specific facts that can be sued to solve specific problems. Since the collected data is fresh and first hand therefore it makes the study more accurate and genuine.
We at SNS Insider have divided Primary Research into 2 parts.
Part 1 wherein we interview the KOLs of major players as well as the upcoming ones across various geographic regions. This allows us to have their view over the market scenario and acts as an important tool to come closer to the accurate market numbers. As many as 45 paid and unpaid primary interviews are taken from both the demand and supply side of the industry to make sure we land at an accurate judgement and analysis of the market.
This step involves the triangulation of data wherein our team analyses the interview transcripts, online survey responses and observation of on filed participants. The below mentioned chart should give a better understanding of the part 1 of the primary interview.
Part 2: In this part of primary research the data collected via secondary research and the part 1 of the primary research is validated with the interviews from individual consultants and subject matter experts.
Consultants are those set of people who have at least 12 years of experience and expertise within the industry whereas Subject Matter Experts are those with at least 15 years of experience behind their back within the same space. The data with the help of two main processes i.e., FGDs (Focused Group Discussions) and IDs (Individual Discussions). This gives us a 3rd party nonbiased primary view of the market scenario making it a more dependable one while collation of the data pointers.
Step 3: Data Bank Validation
Once all the information is collected via primary and secondary sources, we run that information for data validation. At our intelligence centre our research heads track a lot of information related to the market which includes the quarterly reports, the daily stock prices, and other relevant information. Our data bank server gets updated every fortnight and that is how the information which we collected using our primary and secondary information is revalidated in real time.
Step 4: QA/QC Process
After all the data collection and validation our team does a final level of quality check and quality assurance to get rid of any unwanted or undesired mistakes. This might include but not limited to getting rid of the any typos, duplication of numbers or missing of any important information. The people involved in this process include technical content writers, research heads and graphics people. Once this process is completed the title gets uploader on our platform for our clients to read it.
Step 5: Final QC/QA Process:
This is the last process and comes when the client has ordered the study. In this process a final QA/QC is done before the study is emailed to the client. Since we believe in giving our clients a good experience of our research studies, therefore, to make sure that we do not lack at our end in any way humanly possible we do a final round of quality check and then dispatch the study to the client.
Key Segments:
By Component
Software
Services
By Deployment Mode
Cloud
On-Premises
By Enterprise Size
Small and Medium Enterprises
Large Enterprises
By Application
Retail
E-commerce
BFSI
Manufacturing
Healthcare
IT and Telecommunications
Others
By End-User
Suppliers
Buyers
Request for Segment Customization as per your Business Requirement: Segment Customization Request
Regional Coverage:
North America
US
Canada
Mexico
Europe
Germany
France
UK
Italy
Spain
Poland
Turkey
Rest of Europe
Asia Pacific
China
India
Japan
South Korea
Singapore
Australia
Rest of Asia Pacific
Middle East & Africa
UAE
Saudi Arabia
Qatar
South Africa
Rest of Middle East & Africa
Latin America
Brazil
Argentina
Rest of Latin America
Request for Country Level Research Report: Country Level Customization Request
Available Customization
With the given market data, SNS Insider offers customization as per the company’s specific needs. The following customization options are available for the report:
Detailed Volume Analysis
Criss-Cross segment analysis (e.g. Product X Application)
Competitive Product Benchmarking
Geographic Analysis
Additional countries in any of the regions
Customized Data Representation
Detailed analysis and profiling of additional market players