Medical Photo Apps Market Report Scope & Overview:
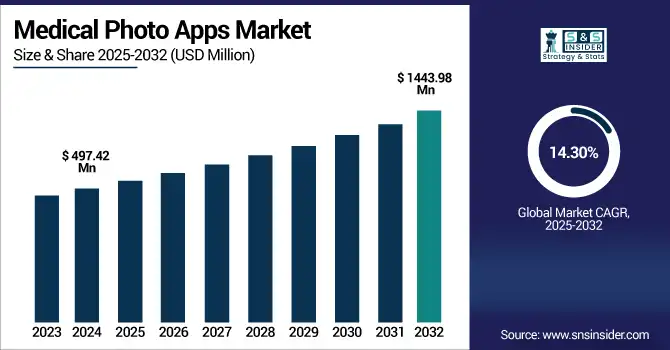
The Medical Photo Apps Market size was valued at USD 497.42 million in 2024 and is expected to reach USD 1443.98 million by 2032, growing at a CAGR of 14.30% over the forecast period of 2025-2032.

To Get more information on Medical Photo Apps Market - Request Free Sample Report
Increasing demand for remote consultations, the penetration of smartphones among healthcare providers, and advancements in mobile imaging technology are some of the key drivers boosting the global medical photo apps market growth. They are becoming indispensable applications for clinical documentation, monitoring, and diagnostics, with the greatest utility in dermatology and plastic surgery. Adoption is also driven by the increasing adoption of artificial intelligence for image analysis and accelerates due to improved data security features.
The U.S. medical photo apps market size was valued at USD 152.59 million in 2024 and is expected to reach USD 439.03 million by 2032, growing at a CAGR of 14.17% over the forecast period of 2025-2032.
North America has a substantial presence in the medical photo apps market, led by the U.S., recognized for its high technology base, coupled with excellent digital health penetration across patient and provider segments. The medical photo apps market is especially strong in the U.S. due to the high smartphone usage among healthcare professionals and patients in combination with the presence of a number of leading medical app developers. Additionally, increasing incorporation of these applications in clinical workflows, coupled with their use in dermatology, plastic surgery, and wound care, will further strengthen the country's dominance in the regional market.
Medical Photo Apps Market Dynamics:
Drivers
- Increasing Use of Telemedicine and Remote Consultations is Driving the Market Growth
Telemedicine has sprung up as an important aspect of patient care, with the fast changes in the global healthcare landscape, to become a virtual care model. In this transformation, all medical photo apps have a crucial role that enables clinic providers to take, store, save in remote locations, and share high-resolution clinic pictures. And this is particularly useful in areas such as dermatology, where a visual examination is core to diagnosis. The apps enable real-time patient-provider communication, minimize in-person appointment volume and post-discharge visits, and expand access to care in rural or underserved communities. Remote consultations, fast becoming the norm, mean that the medical photo app will be an increasingly integral part of the experience.
The COVID-19 pandemic accelerated telemedicine use, with physician telemedicine utilization rising from 15·4% in 2019 to 86·5% in 2021, and virtual outpatient visits rising by 766% in a large U.S. population data set, according to a CDC report.
- The Companies have Documented Cutting-Edge Breakthroughs in AI-driven image Analysis, which have caused a Hike in Market Growth
Over the years, developments in artificial intelligence (AI) and machine learning (ML) have recently the most notable advancements in the field of medical photo apps. They allow for automatic image classification, pattern recognition, and even initial diagnostics, especially nice in dermatological and wound-related assessments. AI algorithms can compare patient images over time and notify clinicians of changes that may require urgent attention. This will not only enhance accuracy in diagnosis, but it will also minimize the load on healthcare professionals by saving time. AI will continue to advance and will make medical photo apps more valuable and desirable in a variety of clinical environments.
Based on 430,908 submissions of photos taken by patients, an AI model for telemedicine photo quality assessment called TrueImage 2.0 was developed, migrating the method of assessing photo quality to the AI tool, which led to real-time guidance of patients and a 68% reduction of poor quality photos.
The AI app, Derm, has been deployed by the NHS in 20 hospitals to provide rapid skin lesion screening based on photo captures by iPhones, achieving a 99.9% accurate melanoma negative predictive value and reducing referral wait time.
Restraint
- Market Growth is Being Limited by the Non-existence of Standardization and Interoperability
The absence of a standardized way of integration with current healthcare IT systems is a significant limitation that rests upon the medical photo apps market. Quebec-based Clio soft specializes in telling doctors where to find test results, yet the majority of the medical photo apps we are shown act as independent platforms Neither is designed to talk to electronic health records (EHRs), picture archiving and communication systems (PACS), or other hospital management software. These two important areas work independently, leading to a disconnect in the workflow where the providers have to manually move or upload their images, which is painfully slow and error-prone.
Medical Photo Apps Market Segmentation Analysis:
By Type
The medical photos segment dominated the medical photo apps market share with a 44.2% in 2024, as this type finds general use in different clinical settings, namely dermatology, wound care, and plastic surgery. This approach was a highly preferred method to document clinical progress, to facilitate remote consultations, and to enhance patient engagement, as it was easy to implement and required minimal resources to capture good-quality 2D images. Moreover, medical photo documentation is cost-efficient and can be incorporated into existing electronic health records (EHRs), which are other factors found to support the leading position of the tool.
The 3D medical imaging segment is expected to grow with a significant CAGR during the forecast period due to the technological advancement of mobile imaging devices and the increasing need for detailed anatomical visualization. The 3D models can be used for preoperative planning, simulation of reconstructive surgery, and orthopaedics has opened even more avenues for improved accuracy and treatment outcome.
By Application
The dermatology segment held the largest share of the medical photo apps market in 2024, with around 46.1% market share, owing to the dependency of the specialty on visual analysis for diagnostic and therapeutic purposes. Regularly photographing skin conditions helps with follow-up, treatment response, and differentiating minor changes. Image acquisition with medical photo apps provides dermatologists with a simple, safe method to capture and share high-quality images, proving especially effective in teledermatology and remote consultations.
The plastic & reconstructive surgery segment is expected to be the fastest-growing from 2025 to 2032, owing to rising aesthetic awareness and a demand for image comparisons pre- and post-operative. Surgical medical photo apps provide the ability to store and view images of the outcome of procedures, but also to use for patient consultations and to improve case management. With this digital and individualization of cosmetic procedures, photo-based tracking tools are becoming a must, considering the urge for apps furthering before and after galleries for patient education and satisfaction.
By Platform
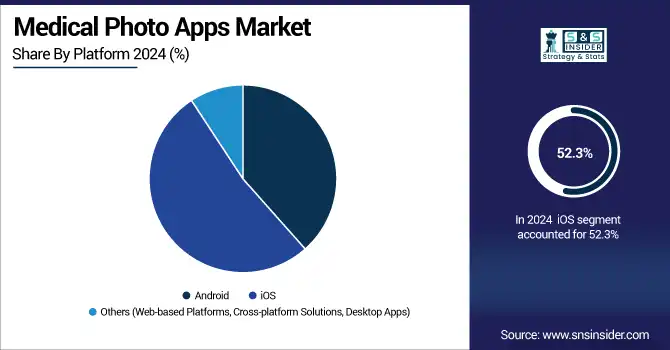
The iOS segment led the medical photo apps market share in 2024 with a 52.3%, as it is widely used among healthcare professionals, especially in advanced regions such as North America and several parts of Europe. Well-known top notch for camera, steady OS, and security with Apple gadgets, for instance, iPhone, iPad, are basic for clinical picture capture and patient information assurance. Another reason is that most medical photo apps are developed and optimized for iOS first, as iOS is one unified ecosystem, making it easier to guarantee the user experience and integration with healthcare IT systems.
The growth of the Android segment in the forecast period is expected to increase at the fastest rate, due to the increasing availability of low-cost Android smartphones and tablets in developing regions, including Asia Pacific and Latin America. However, Android offers cheap devices, and this means that there is a much greater reach for patients and smaller healthcare providers. Also, the increasing app development support for Android, along with improvements in device camera quality and security protocols, is driving the higher adoption of medical photo apps in various healthcare settings.

By Device
The medical photo apps market was dominated by the smartphone segment in 2024, with around 74.16% market share on account of their availability, ease of use, and high-quality built-in cameras with the ability to capture high-resolution clinical images. Healthcare professionals and patients depend on smartphones for fast, portable access to medical photo applications, allowing clinicians to place the history in the hands of the patient, and document and share images of diagnostics, permitting remote consultations. The portability and lower cost of a smartphone, combined with its convenient connectivity to cloud storage and electronic health records, have led smartphones to be the most common device used for medical imaging in clinical and home settings.
The tablets segment is anticipated to grow at the highest CAGR during the forecast period due as tablets have a bigger surface area, making it easier to see and analyze images, especially important in dermatology, plastic surgery, and orthopedics. The usage of them is expanding, particularly in hospitals and clinics, where clinicians need photos to be seen, and where clinical notes need to be entered more easily. Tablets are many things in one, as they serve in both patient consultation, education, and intraoperative documentation, and they play a role in helping medical practices transition to digital workflows.
By End Use
The medical photo apps market was led by the healthcare providers segment in 2024, as healthcare providers, including clinicians, particularly dermatology medicine, plastic and reconstructive surgery, and wound care, have incorporated these tools as an integral part of their diagnostic, treatment planning, and patient record functions. Clinically proven high-resolution mobile imaging also aids providers by documenting clinical progress, tracking treatment outcomes over time, and enabling visual follow-ups. Increased use of telehealth also leads to increased use of provider-owned apps to hold virtual consultations. The institutional use of these applications, particularly when linked with electronic health records, further strengthens the position of healthcare providers as the largest end-user segment in the market.
Regional Analysis:
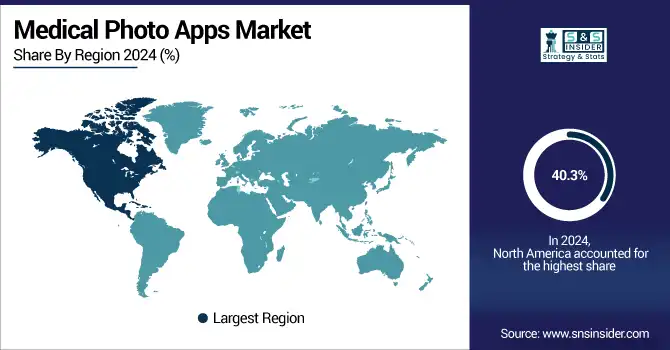
North America dominated the medical photo apps market with 40.3% market share in 2024 due to the large presence of healthcare infrastructure, more advanced healthcare settings, and the availability of smartphones among healthcare providers and patients. The U.S. and Canada are known to be home to some of the largest technology firms and healthcare app developers, which further accelerates innovation in medical imaging and photo-based diagnostics in the region. The growing use of telehealth and medical photo apps in dermatology and plastic surgery practices also leads to broader market acceptance. North America is further entrenched in this lead with health forward regulation surrounding digital health and a technology-native medical community.
Asia Pacific is expected to be the fastest-growing region in the medical photo apps market trend with a 14.90% CAGR over the forecast period due to the fast-developing digitization of health care systems and increasing access to smartphones and internet penetration in developing economies such as China, India, and various Southeast Asian countries. The rising prevalence of skin diseases and chronic diseases has increased the demand for mobile diagnostic tools as the telemedicine industry is expanding rapidly. In addition, the adoption of medical photo apps is also being driven by government-led efforts to modernize healthcare and the increasing use of AI-powered mobile platforms. Increased demographics of patients and a growing middle class provide a significant user base, thereby boosting regional market growth.
The need for digital health technologies is increasing in Europe, which is leading to the growth of the medical photo apps market, with many countries focusing on telemedicine. Medical photo apps are penetrating the region, most commonly in dermatology and plastic & reconstructive surgery, as clinicians adopt mobile imaging tools for diagnosis, tracking, and documentation. In addition, encouraging government initiatives facilitating the digital transformation of healthcare and technological advancements in artificial intelligence & image processing are further strengthening the growth of the market. This growth is led by a few key players, including Germany, the UK, and Spain, indicating a regional shift toward the adoption of smart mobile health solutions in routine clinical practice.
Latin America and MEA (Middle East & Africa) are expected to witness moderate growth in the medical photo apps market analysis during the forecast period due to increasing digital infrastructure, along with growing adoption of smartphones among healthcare providers and patients. Emerging markets such as Brazil, Mexico, South Africa, and the UAE have shown gradual adoption of visual imaging tools in telemedicine and clinical documentation, specifically in dermatologic, dental, and plastic surgical specialties. While adoption is still behind more mature regions, increased investment in health IT systems and awareness of mobile clinical solutions are helping to accelerate the uptake in these regions. While slower, due to differences in culture, language, and over-cautiousness associated with costs, digital health solutions targeted to a local ecosystem and regional pilot programs are creating a stepping stone for the ramped-up proliferation of digital health solutions shortly.

Get Customized Report as per Your Business Requirement - Enquiry Now
Medical Photo Apps Market Key Players:
The medical photo apps market companies are Figure 1, IMAIOS e-Anatomy, DermEngine, Modmed (Modernizing Medicine), DrChrono, VisualDx, Epic Systems Corporation, SkinVision, Canfield Scientific, Compulink Healthcare Solutions, NimbleRx, Carestream Dental, Remedy, MediBapp, MedX Health Corp., 3Derm Systems, Photomed Technologies, Proximie, Touch Surgery (by Medtronic), Siilo, and other players.
Recent Developments:
-
Jan 2025, Core Sound Imaging, provider of medical imaging platform Studycast, today announced an $80 million growth investment from PSG, a leading growth equity firm that specializes in partnering with software and technology-enabled services companies to capitalize on transformational growth.
- July 2024: DermEngine Mobile launches new diagnostic shortcuts, 48MP resolution Zoom preview for total body photography (TBP), and automatic blur detection to help streamline dermatology workflows and improve accuracy for diagnoses.
- July 2025, The latest AI-driven features of DermEngine—including its OptimaScan enhancement for TBP—were showcased at the AAD 2025 and Healthed Women’s & Children’s Health Update events, solidifying its position as a leader in AI-driven dermoscopy imaging.
Report Attributes | Details |
---|---|
Market Size in 2024 | USD 497.42 million |
Market Size by 2032 | USD 1443.98 million |
CAGR | CAGR of 14.30% From 2025 to 2032 |
Base Year | 2024 |
Forecast Period | 2025-2032 |
Historical Data | 2021-2023 |
Report Scope & Coverage | Market Size, Segments Analysis, Competitive Landscape, Regional Analysis, DROC & SWOT Analysis, Forecast Outlook |
Key Segments | • By Type (Medical Photos, 3D Medical Imaging, Medical Videos) • By Application (Dermatology, Plastic & Reconstructive Surgery, Orthopedic, Others) • By Platform (Android, iOS, Others) • By Device (Smartphones, Tablets) • By End Use (Healthcare Providers, Patients, Others) |
Regional Analysis/Coverage | North America (US, Canada, Mexico), Europe (Germany, France, UK, Italy, Spain, Poland, Turkey, Rest of Europe), Asia Pacific (China, India, Japan, South Korea, Singapore, Australia, Rest of Asia Pacific), Middle East & Africa (UAE, Saudi Arabia, Qatar, South Africa, Rest of Middle East & Africa), Latin America (Brazil, Argentina, Rest of Latin America) |
Company Profiles | The medical photo apps market companies are Figure 1, IMAIOS e-Anatomy, DermEngine, Modmed (Modernizing Medicine), DrChrono, VisualDx, Epic Systems Corporation, SkinVision, Canfield Scientific, Compulink Healthcare Solutions, NimbleRx, Carestream Dental, Remedy, MediBapp, MedX Health Corp., 3Derm Systems, Photomed Technologies, Proximie, Touch Surgery (by Medtronic), Siilo, and other players. |
Table Of Contents
1. Introduction
1.1 Market Definition & Scope
1.2 Research Assumptions & Abbreviations
1.3 Research Methodology
2. Executive Summary
2.1 Market Snapshot
2.2 Market Absolute $ Opportunity Assessment & Y-o-Y Analysis, 2021–2032
2.3 Market Size & Forecast, By Segmentation, 2021–2032
2.3.1 Market Size By Type
2.3.2 Market Size By Application
2.3.2 Market Size By Platform
2.3.2 Market Size By Device
2.3.2 Market Size By End Use
2.4 Market Share & BPS Analysis By Region, 2024
2.5 Industry Growth Scenarios – Conservative, Likely & Optimistic
2.6 Industry CxO’s Perspective
3. Market Overview
3.1 Market Dynamics
3.1.1 Drivers
3.1.2 Restraints
3.1.3 Opportunities
3.1.4 Key Market Trends
3.2 Industry PESTLE Analysis
3.3 Key Industry Forces (Porter’s) Impacting Market Growth
3.4 Industry Life Cycle Assessment
3.5 Parent Market Overview
3.6 Market Risk Assessment
4. Statistical Insights & Trends Reporting
4.1 Usage Penetration & Active User Base (2024)
4.1.1 Global and Regional Monthly Active Users (North America, Europe, Asia Pacific, etc.)
4.1.2 Growth in Daily Usage Frequency by Healthcare Professionals
4.1.3 Integration Rates of Medical Photo Apps in Clinical Workflows
4.2 App Download & Subscription Trends (2024), by Region
4.2.1 Total Downloads of Free vs. Paid Medical Photo Apps
4.2.2 Regional Breakdown of Subscription Models (Android vs. iOS Platforms)
4.2.3 Specialty-wise Adoption Trends (Dermatology, Plastic Surgery, etc.)
4.3 App Usage Volume and Data Upload Trends (2020–2032)
4.3.1 Annual Image/Video Upload Volumes via Medical Photo Apps
4.3.2 Utilization of Cloud-based Storage for Medical Imaging Data
4.3.3 Growth of App-based Visual Teleconsultation Sessions
4.4 Healthcare IT Spending on Mobile Health Applications (2024), by Region
4.4.1 Government and Institutional Investment in Medical Photo App Technology
4.4.2 Commercial and Private Sector Spending on Mobile Imaging Tools
4.4.3 Out-of-Pocket Consumer Expenditure on Premium Medical Imaging Apps
5. Medical Photo Apps Market Segmental Analysis & Forecast, By Type, 2021 – 2032, Value (USD Million)
5.1 Introduction
5.2 Medical Photos
5.2.1 Key Trends
5.2.2 Market Size & Forecast, 2021 – 2032
5.3 3D Medical Imaging
5.3.1 Key Trends
5.3.2 Market Size & Forecast, 2021 – 2032
5.4 Medical Videos
5.4.1 Key Trends
5.4.2 Market Size & Forecast, 2021 – 2032
6. Medical Photo Apps Market Segmental Analysis & Forecast, By Application, 2021 – 2032, Value (USD Million)
6.1 Introduction
6.2 Dermatology
6.2.1 Key Trends
6.2.2 Market Size & Forecast, 2021 – 2032
6.3 Plastic & Reconstructive Surgery
6.3.1 Key Trends
6.3.2 Market Size & Forecast, 2021 – 2032
6.4 Orthopedic
6.4.1 Key Trends
6.4.2 Market Size & Forecast, 2021 – 2032
6.5 Others (ENT, Dental, Eye Condition)
6.5.1 Key Trends
6.5.2 Market Size & Forecast, 2021 – 2032
7. Medical Photo Apps Market Segmental Analysis & Forecast, By Platform, 2021 – 2032, Value (USD Million)
7.1 Introduction
7.2 Android
7.2.1 Key Trends
7.2.2 Market Size & Forecast, 2021 – 2032
7.3 IOS
7.3.1 Key Trends
7.3.2 Market Size & Forecast, 2021 – 2032
7.4 Others (Web-based Platforms, Cross-platform Solutions, Desktop Apps)
7.4.1 Key Trends
7.4.2 Market Size & Forecast, 2021 – 2032
8. Medical Photo Apps Market Segmental Analysis & Forecast, By Device, 2021 – 2032, Value (USD Million)
8.1 Introduction
8.2 Smartphones
8.2.1 Key Trends
8.2.2 Market Size & Forecast, 2021 – 2032
8.3 Tablets
8.3.1 Key Trends
8.3.2 Market Size & Forecast, 2021 – 2032
9. Medical Photo Apps Market Segmental Analysis & Forecast, By End Use, 2021 – 2032, Value (USD Million)
9.1 Introduction
9.2 Healthcare Providers
9.2.1 Key Trends
9.2.2 Market Size & Forecast, 2021 – 2032
9.3 Patients
9.3.1 Key Trends
9.3.2 Market Size & Forecast, 2021 – 2032
9.4 Others
9.4.1 Key Trends
9.4.2 Market Size & Forecast, 2021 – 2032
10. Medical Photo Apps Market Segmental Analysis & Forecast By Region, 2021 – 2032, Value (USD Million)
10.1 Introduction
10.2 North America
10.2.1 Key Trends
10.2.2 Medical Photo Apps Market Size & Forecast, By Type, 2021 – 2032
10.2.3 Medical Photo Apps Market Size & Forecast, By Application, 2021 – 2032
10.2.4 Medical Photo Apps Market Size & Forecast, By Platform, 2021 – 2032
10.2.5 Medical Photo Apps Market Size & Forecast, By Device, 2021 – 2032
10.2.6 Medical Photo Apps Market Size & Forecast, By End Use, 2021 – 2032
10.2.7 Medical Photo Apps Market Size & Forecast, By Country, 2021 – 2032
10.2.7.1 USA
10.2.7.1.1 Medical Photo Apps Market Size & Forecast, By Type, 2021 – 2032
10.2.7.1.2 Medical Photo Apps Market Size & Forecast, By Application, 2021 – 2032
10.2.7.1.3 Medical Photo Apps Market Size & Forecast, By Platform, 2021 – 2032
10.2.7.1.4 Medical Photo Apps Market Size & Forecast, By Device, 2021 – 2032
10.2.7.1.5 Medical Photo Apps Market Size & Forecast, By End Use, 2021 – 2032
10.2.7.2 Canada
10.2.7.2.1 Medical Photo Apps Market Size & Forecast, By Type, 2021 – 2032
10.2.7.2.2 Medical Photo Apps Market Size & Forecast, By Application, 2021 – 2032
10.2.7.2.3 Medical Photo Apps Market Size & Forecast, By Platform, 2021 – 2032
10.2.7.2.4 Medical Photo Apps Market Size & Forecast, By Device, 2021 – 2032
10.2.7.2.5 Medical Photo Apps Market Size & Forecast, By End Use, 2021 – 2032
10.3 Europe
10.3.1 Key Trends
10.3.2 Medical Photo Apps Market Size & Forecast, By Type, 2021 – 2032
10.3.3 Medical Photo Apps Market Size & Forecast, By Application, 2021 – 2032
10.3.4 Medical Photo Apps Market Size & Forecast, By Platform, 2021 – 2032
10.3.5 Medical Photo Apps Market Size & Forecast, By Device, 2021 – 2032
10.3.6 Medical Photo Apps Market Size & Forecast, By End Use, 2021 – 2032
10.3.7 Medical Photo Apps Market Size & Forecast, By Country, 2021 – 2032
10.3.7.1 Germany
10.3.7.1.1 Medical Photo Apps Market Size & Forecast, By Type, 2021 – 2032
10.3.7.1.2 Medical Photo Apps Market Size & Forecast, By Application, 2021 – 2032
10.3.7.1.3 Medical Photo Apps Market Size & Forecast, By Platform, 2021 – 2032
10.3.7.1.4 Medical Photo Apps Market Size & Forecast, By Device, 2021 – 2032
10.3.7.1.5 Medical Photo Apps Market Size & Forecast, By End Use, 2021 – 2032
10.3.7.2 UK
10.3.7.2.1 Medical Photo Apps Market Size & Forecast, By Type, 2021 – 2032
10.3.7.2.2 Medical Photo Apps Market Size & Forecast, By Application, 2021 – 2032
10.3.7.2.3 Medical Photo Apps Market Size & Forecast, By Platform, 2021 – 2032
10.3.7.2.4 Medical Photo Apps Market Size & Forecast, By Device, 2021 – 2032
10.3.7.2.5 Medical Photo Apps Market Size & Forecast, By End Use, 2021 – 2032
10.3.7.3 France
10.3.7.3.1 Medical Photo Apps Market Size & Forecast, By Type, 2021 – 2032
10.3.7.3.2 Medical Photo Apps Market Size & Forecast, By Application, 2021 – 2032
10.3.7.3.3 Medical Photo Apps Market Size & Forecast, By Platform, 2021 – 2032
10.3.7.3.4 Medical Photo Apps Market Size & Forecast, By Device, 2021 – 2032
10.3.7.3.5 Medical Photo Apps Market Size & Forecast, By End Use, 2021 – 2032
10.3.7.4 Italy
10.3.7.4.1 Medical Photo Apps Market Size & Forecast, By Type, 2021 – 2032
10.3.7.4.2 Medical Photo Apps Market Size & Forecast, By Application, 2021 – 2032
10.3.7.4.3 Medical Photo Apps Market Size & Forecast, By Platform, 2021 – 2032
10.3.7.4.4 Medical Photo Apps Market Size & Forecast, By Device, 2021 – 2032
10.3.7.4.5 Medical Photo Apps Market Size & Forecast, By End Use, 2021 – 2032
10.3.7.5 Spain
10.3.7.5.1 Medical Photo Apps Market Size & Forecast, By Type, 2021 – 2032
10.3.7.5.2 Medical Photo Apps Market Size & Forecast, By Application, 2021 – 2032
10.3.7.5.3 Medical Photo Apps Market Size & Forecast, By Platform, 2021 – 2032
10.3.7.5.4 Medical Photo Apps Market Size & Forecast, By Device, 2021 – 2032
10.3.7.5.5 Medical Photo Apps Market Size & Forecast, By End Use, 2021 – 2032
10.3.7.6 Russia
10.3.7.6.1 Medical Photo Apps Market Size & Forecast, By Type, 2021 – 2032
10.3.7.6.2 Medical Photo Apps Market Size & Forecast, By Application, 2021 – 2032
10.3.7.6.3 Medical Photo Apps Market Size & Forecast, By Platform, 2021 – 2032
10.3.7.6.4 Medical Photo Apps Market Size & Forecast, By Device, 2021 – 2032
10.3.7.6.5 Medical Photo Apps Market Size & Forecast, By End Use, 2021 – 2032
10.3.7.7 Poland
10.3.7.7.1 Medical Photo Apps Market Size & Forecast, By Type, 2021 – 2032
10.3.7.7.2 Medical Photo Apps Market Size & Forecast, By Application, 2021 – 2032
10.3.7.7.3 Medical Photo Apps Market Size & Forecast, By Platform, 2021 – 2032
10.3.7.7.4 Medical Photo Apps Market Size & Forecast, By Device, 2021 – 2032
10.3.7.7.5 Medical Photo Apps Market Size & Forecast, By End Use, 2021 – 2032
10.3.7.8 Rest of Europe
10.3.7.8.1 Medical Photo Apps Market Size & Forecast, By Type, 2021 – 2032
10.3.7.8.2 Medical Photo Apps Market Size & Forecast, By Application, 2021 – 2032
10.3.7.8.3 Medical Photo Apps Market Size & Forecast, By Platform, 2021 – 2032
10.3.7.8.4 Medical Photo Apps Market Size & Forecast, By Device, 2021 – 2032
10.3.7.8.5 Medical Photo Apps Market Size & Forecast, By End Use, 2021 – 2032
10.4 Asia-Pacific
10.4.1 Key Trends
10.4.2 Medical Photo Apps Market Size & Forecast, By Type, 2021 – 2032
10.4.3 Medical Photo Apps Market Size & Forecast, By Application, 2021 – 2032
10.4.4 Medical Photo Apps Market Size & Forecast, By Platform, 2021 – 2032
10.4.5 Medical Photo Apps Market Size & Forecast, By Device, 2021 – 2032
10.4.6 Medical Photo Apps Market Size & Forecast, By End Use, 2021 – 2032
10.4.7 Medical Photo Apps Market Size & Forecast, By Country, 2021 – 2032
10.4.7.1 China
10.4.7.1.1 Medical Photo Apps Market Size & Forecast, By Type, 2021 – 2032
10.4.7.1.2 Medical Photo Apps Market Size & Forecast, By Application, 2021 – 2032
10.4.7.1.3 Medical Photo Apps Market Size & Forecast, By Platform, 2021 – 2032
10.4.7.1.4 Medical Photo Apps Market Size & Forecast, By Device, 2021 – 2032
10.4.7.1.5 Medical Photo Apps Market Size & Forecast, By End Use, 2021 – 2032
10.4.7.2 India
10.4.7.2.1 Medical Photo Apps Market Size & Forecast, By Type, 2021 – 2032
10.4.7.2.2 Medical Photo Apps Market Size & Forecast, By Application, 2021 – 2032
10.4.7.2.3 Medical Photo Apps Market Size & Forecast, By Platform, 2021 – 2032
10.4.7.2.4 Medical Photo Apps Market Size & Forecast, By Device, 2021 – 2032
10.4.7.2.5 Medical Photo Apps Market Size & Forecast, By End Use, 2021 – 2032
10.4.7.3 Japan
10.4.7.3.1 Medical Photo Apps Market Size & Forecast, By Type, 2021 – 2032
10.4.7.3.2 Medical Photo Apps Market Size & Forecast, By Application, 2021 – 2032
10.4.7.3.3 Medical Photo Apps Market Size & Forecast, By Platform, 2021 – 2032
10.4.7.3.4 Medical Photo Apps Market Size & Forecast, By Device, 2021 – 2032
10.4.7.3.5 Medical Photo Apps Market Size & Forecast, By End Use, 2021 – 2032
10.4.7.4 South Korea
10.4.7.4.1 Medical Photo Apps Market Size & Forecast, By Type, 2021 – 2032
10.4.7.4.2 Medical Photo Apps Market Size & Forecast, By Application, 2021 – 2032
10.4.7.4.3 Medical Photo Apps Market Size & Forecast, By Platform, 2021 – 2032
10.4.7.4.4 Medical Photo Apps Market Size & Forecast, By Device, 2021 – 2032
10.4.7.4.5 Medical Photo Apps Market Size & Forecast, By End Use, 2021 – 2032
10.4.7.5 Australia
10.4.7.5.1 Medical Photo Apps Market Size & Forecast, By Type, 2021 – 2032
10.4.7.5.2 Medical Photo Apps Market Size & Forecast, By Application, 2021 – 2032
10.4.7.5.3 Medical Photo Apps Market Size & Forecast, By Platform, 2021 – 2032
10.4.7.5.4 Medical Photo Apps Market Size & Forecast, By Device, 2021 – 2032
10.4.7.5.5 Medical Photo Apps Market Size & Forecast, By End Use, 2021 – 2032
10.4.7.6 ASEAN Countries
10.4.7.6.1 Medical Photo Apps Market Size & Forecast, By Type, 2021 – 2032
10.4.7.6.2 Medical Photo Apps Market Size & Forecast, By Application, 2021 – 2032
10.4.7.6.3 Medical Photo Apps Market Size & Forecast, By Platform, 2021 – 2032
10.4.7.6.4 Medical Photo Apps Market Size & Forecast, By Device, 2021 – 2032
10.4.7.6.5 Medical Photo Apps Market Size & Forecast, By End Use, 2021 – 2032
10.4.7.7 Rest of Asia-Pacific
10.4.7.7.1 Medical Photo Apps Market Size & Forecast, By Type, 2021 – 2032
10.4.7.7.2 Medical Photo Apps Market Size & Forecast, By Application, 2021 – 2032
10.4.7.7.3 Medical Photo Apps Market Size & Forecast, By Platform, 2021 – 2032
10.4.7.7.4 Medical Photo Apps Market Size & Forecast, By Device, 2021 – 2032
10.4.7.7.5 Medical Photo Apps Market Size & Forecast, By End Use, 2021 – 2032
10.5 Latin America
10.5.1 Key Trends
10.5.2 Medical Photo Apps Market Size & Forecast, By Type, 2021 – 2032
10.5.3 Medical Photo Apps Market Size & Forecast, By Application, 2021 – 2032
10.5.4 Medical Photo Apps Market Size & Forecast, By Platform, 2021 – 2032
10.5.5 Medical Photo Apps Market Size & Forecast, By Device, 2021 – 2032
10.5.6 Medical Photo Apps Market Size & Forecast, By End Use, 2021 – 2032
10.5.7 Medical Photo Apps Market Size & Forecast, By Country, 2021 – 2032
10.5.7.1 Brazil
10.5.7.1.1 Medical Photo Apps Market Size & Forecast, By Type, 2021 – 2032
10.5.7.1.2 Medical Photo Apps Market Size & Forecast, By Application, 2021 – 2032
10.5.7.1.3 Medical Photo Apps Market Size & Forecast, By Platform, 2021 – 2032
10.5.7.1.4 Medical Photo Apps Market Size & Forecast, By Device, 2021 – 2032
10.5.7.1.5 Medical Photo Apps Market Size & Forecast, By End Use, 2021 – 2032
10.5.7.2 Argentina
10.5.7.2.1 Medical Photo Apps Market Size & Forecast, By Type, 2021 – 2032
10.5.7.2.2 Medical Photo Apps Market Size & Forecast, By Application, 2021 – 2032
10.5.7.2.3 Medical Photo Apps Market Size & Forecast, By Platform, 2021 – 2032
10.5.7.2.4 Medical Photo Apps Market Size & Forecast, By Device, 2021 – 2032
10.5.7.2.5 Medical Photo Apps Market Size & Forecast, By End Use, 2021 – 2032
10.5.7.3 Mexico
10.5.7.3.1 Medical Photo Apps Market Size & Forecast, By Type, 2021 – 2032
10.5.7.3.2 Medical Photo Apps Market Size & Forecast, By Application, 2021 – 2032
10.5.7.3.3 Medical Photo Apps Market Size & Forecast, By Platform, 2021 – 2032
10.5.7.3.4 Medical Photo Apps Market Size & Forecast, By Device, 2021 – 2032
10.5.7.3.5 Medical Photo Apps Market Size & Forecast, By End Use, 2021 – 2032
10.5.7.4 Colombia
10.5.7.4.1 Medical Photo Apps Market Size & Forecast, By Type, 2021 – 2032
10.5.7.4.2 Medical Photo Apps Market Size & Forecast, By Application, 2021 – 2032
10.5.7.4.3 Medical Photo Apps Market Size & Forecast, By Platform, 2021 – 2032
10.5.7.4.4 Medical Photo Apps Market Size & Forecast, By Device, 2021 – 2032
10.5.7.4.5 Medical Photo Apps Market Size & Forecast, By End Use, 2021 – 2032
10.5.7.5 Rest of Latin America
10.5.7.5.1 Medical Photo Apps Market Size & Forecast, By Type, 2021 – 2032
10.5.7.5.2 Medical Photo Apps Market Size & Forecast, By Application, 2021 – 2032
10.5.7.5.3 Medical Photo Apps Market Size & Forecast, By Platform, 2021 – 2032
10.5.7.5.4 Medical Photo Apps Market Size & Forecast, By Device, 2021 – 2032
10.5.7.5.5 Medical Photo Apps Market Size & Forecast, By End Use, 2021 – 2032
10.6 Middle East & Africa
10.6.1 Key Trends
10.6.2 Medical Photo Apps Market Size & Forecast, By Type, 2021 – 2032
10.6.3 Medical Photo Apps Market Size & Forecast, By Application, 2021 – 2032
10.6.4 Medical Photo Apps Market Size & Forecast, By Platform, 2021 – 2032
10.6.5 Medical Photo Apps Market Size & Forecast, By Device, 2021 – 2032
10.6.6 Medical Photo Apps Market Size & Forecast, By End Use, 2021 – 2032
10.6.7 Medical Photo Apps Market Size & Forecast, By Country, 2021 – 2032
10.6.7.1 UAE
10.6.7.1.1 Medical Photo Apps Market Size & Forecast, By Type, 2021 – 2032
10.6.7.1.2 Medical Photo Apps Market Size & Forecast, By Application, 2021 – 2032
10.6.7.1.3 Medical Photo Apps Market Size & Forecast, By Platform, 2021 – 2032
10.6.7.1.4 Medical Photo Apps Market Size & Forecast, By Device, 2021 – 2032
10.6.7.1.5 Medical Photo Apps Market Size & Forecast, By End Use, 2021 – 2032
10.6.7.2 Saudi Arabia
10.6.7.2.1 Medical Photo Apps Market Size & Forecast, By Type, 2021 – 2032
10.6.7.2.2 Medical Photo Apps Market Size & Forecast, By Application, 2021 – 2032
10.6.7.2.3 Medical Photo Apps Market Size & Forecast, By Platform, 2021 – 2032
10.6.7.2.4 Medical Photo Apps Market Size & Forecast, By Device, 2021 – 2032
10.6.7.2.5 Medical Photo Apps Market Size & Forecast, By End Use, 2021 – 2032
10.6.7.3 Qatar
10.6.7.3.1 Medical Photo Apps Market Size & Forecast, By Type, 2021 – 2032
10.6.7.3.2 Medical Photo Apps Market Size & Forecast, By Application, 2021 – 2032
10.6.7.3.3 Medical Photo Apps Market Size & Forecast, By Platform, 2021 – 2032
10.6.7.3.4 Medical Photo Apps Market Size & Forecast, By Device, 2021 – 2032
10.6.7.3.5 Medical Photo Apps Market Size & Forecast, By End Use, 2021 – 2032
10.6.7.4 Egypt
10.6.7.4.1 Medical Photo Apps Market Size & Forecast, By Type, 2021 – 2032
10.6.7.4.2 Medical Photo Apps Market Size & Forecast, By Application, 2021 – 2032
10.6.7.4.3 Medical Photo Apps Market Size & Forecast, By Platform, 2021 – 2032
10.6.7.4.4 Medical Photo Apps Market Size & Forecast, By Device, 2021 – 2032
10.6.7.4.5 Medical Photo Apps Market Size & Forecast, By End Use, 2021 – 2032
10.6.7.5 South Africa
10.6.7.5.1 Medical Photo Apps Market Size & Forecast, By Type, 2021 – 2032
10.6.7.5.2 Medical Photo Apps Market Size & Forecast, By Application, 2021 – 2032
10.6.7.5.3 Medical Photo Apps Market Size & Forecast, By Platform, 2021 – 2032
10.6.7.5.4 Medical Photo Apps Market Size & Forecast, By Device, 2021 – 2032
10.6.7.5.5 Medical Photo Apps Market Size & Forecast, By End Use, 2021 – 2032
10.6.7.6 Rest of Middle East & Africa
10.6.7.6.1 Medical Photo Apps Market Size & Forecast, By Type, 2021 – 2032
10.6.7.6.2 Medical Photo Apps Market Size & Forecast, By Application, 2021 – 2032
10.6.7.6.3 Medical Photo Apps Market Size & Forecast, By Platform, 2021 – 2032
10.6.7.6.4 Medical Photo Apps Market Size & Forecast, By Device, 2021 – 2032
10.6.7.6.5 Medical Photo Apps Market Size & Forecast, By End Use, 2021 – 2032
11. Competitive Landscape
11.1 Key Players' Positioning
11.2 Competitive Developments
11.2.1 Key Strategies Adopted (%), By Key Players, 2024
11.2.2 Year-Wise Strategies & Development, 2021 – 2025
11.2.3 Number Of Strategies Adopted By Key Players, 2024
11.3 Market Share Analysis, 2024
11.4 Product/Service & Application Benchmarking
11.4.1 Product/Service Specifications & Features By Key Players
11.4.2 Product/Service Heatmap By Key Players
11.4.3 Application Heatmap By Key Players
11.5 Industry Start-Up & Innovation Landscape
11.6 Key Company Profiles
11.6.1 Figure 1
11.6.1.1 Company Overview & Snapshot
11.6.1.2 Product/Service Portfolio
11.6.1.3 Key Company Financials
11.6.1.4 SWOT Analysis
11.6.2 IMAIOS e-Anatomy
11.6.2.1 Company Overview & Snapshot
11.6.2.2 Product/Service Portfolio
11.6.2.3 Key Company Financials
11.6.2.4 SWOT Analysis
11.6.3 DermEngine
11.6.3.1 Company Overview & Snapshot
11.6.3.2 Product/Service Portfolio
11.6.3.3 Key Company Financials
11.6.3.4 SWOT Analysis
11.6.4 Modmed (Modernizing Medicine)
11.6.4.1 Company Overview & Snapshot
11.6.4.2 Product/Service Portfolio
11.6.4.3 Key Company Financials
11.6.4.4 SWOT Analysis
11.6.5 DrChrono
11.6.5.1 Company Overview & Snapshot
11.6.5.2 Product/Service Portfolio
11.6.5.3 Key Company Financials
11.6.5.4 SWOT Analysis
11.6.6 VisualDx
11.6.6.1 Company Overview & Snapshot
11.6.6.2 Product/Service Portfolio
11.6.6.3 Key Company Financials
11.6.6.4 SWOT Analysis
11.6.7 Epic Systems Corporation
11.6.7.1 Company Overview & Snapshot
11.6.7.2 Product/Service Portfolio
11.6.7.3 Key Company Financials
11.6.7.4 SWOT Analysis
11.6.8 SkinVision
11.6.8.1 Company Overview & Snapshot
11.6.8.2 Product/Service Portfolio
11.6.8.3 Key Company Financials
11.6.8.4 SWOT Analysis
11.6.9 Canfield Scientific
11.6.9.1 Company Overview & Snapshot
11.6.9.2 Product/Service Portfolio
11.6.9.3 Key Company Financials
11.6.9.4 SWOT Analysis
11.6.10 Compulink Healthcare Solutions
11.6.10.1 Company Overview & Snapshot
11.6.10.2 Product/Service Portfolio
11.6.10.3 Key Company Financials
11.6.10.4 SWOT Analysis
11.6.11 NimbleRx
11.6.11.1 Company Overview & Snapshot
11.6.11.2 Product/Service Portfolio
11.6.11.3 Key Company Financials
11.6.11.4 SWOT Analysis
11.6.12 Carestream Dental
11.6.12.1 Company Overview & Snapshot
11.6.12.2 Product/Service Portfolio
11.6.12.3 Key Company Financials
11.6.12.4 SWOT Analysis
11.6.13 Remedy
11.6.13.1 Company Overview & Snapshot
11.6.13.2 Product/Service Portfolio
11.6.13.3 Key Company Financials
11.6.13.4 SWOT Analysis
11.6.14 MediBapp
11.6.14.1 Company Overview & Snapshot
11.6.14.2 Product/Service Portfolio
11.6.14.3 Key Company Financials
11.6.14.4 SWOT Analysis
11.6.15 MedX Health Corp.
11.6.15.1 Company Overview & Snapshot
11.6.15.2 Product/Service Portfolio
11.6.15.3 Key Company Financials
11.6.15.4 SWOT Analysis
11.6.16 3Derm Systems
11.6.16.1 Company Overview & Snapshot
11.6.16.2 Product/Service Portfolio
11.6.16.3 Key Company Financials
11.6.16.4 SWOT Analysis
11.6.17 Photomed Technologies
11.6.17.1 Company Overview & Snapshot
11.6.17.2 Product/Service Portfolio
11.6.17.3 Key Company Financials
11.6.17.4 SWOT Analysis
11.6.18 Proximie
11.6.18.1 Company Overview & Snapshot
11.6.18.2 Product/Service Portfolio
11.6.18.3 Key Company Financials
11.6.18.4 SWOT Analysis
11.6.19 Touch Surgery (by Medtronic)
11.6.19.1 Company Overview & Snapshot
11.6.19.2 Product/Service Portfolio
11.6.19.3 Key Company Financials
11.6.19.4 SWOT Analysis
11.6.20 Siilo
11.6.20.1 Company Overview & Snapshot
11.6.20.2 Product/Service Portfolio
11.6.20.3 Key Company Financials
11.6.20.4 SWOT Analysis
12. Analyst Recommendations
12.1 SNS Insider Opportunity Map
12.2 Industry Low-Hanging Fruit Assessment
12.3 Market Entry & Growth Strategy
12.4 Analyst Viewpoint & Suggestions On Market Growth
13. Assumptions
14. Disclaimer
15. Appendix
15.1 List Of Tables
15.2 List Of Figures
Key Market Segments:
By Type
-
- Medical Photos
- 3D Medical Imaging
- Medical Videos
By Application
-
- Dermatology
- Plastic & Reconstructive Surgery
- Orthopedic
- Others (ENT, Dental, Eye Condition)
By Platform
-
- Android
- iOS
- Others (Web-based Platforms, Cross-platform Solutions, Desktop Apps)
By Device
-
- Smartphones
- Tablets
By End Use
-
- Healthcare Providers
- Patients
- Others (Medical Imaging Centers, Research Institutions, Medical Educators & Training Institutes, etc.)
Request for Segment Customization as per your Business Requirement: Segment Customization Request
Regional Coverage:
North America
- US
- Canada
Europe
- Germany
- France
- UK
- Italy
- Spain
- Russia
- Poland
- Rest of Europe
Asia Pacific
- China
- India
- Japan
- South Korea
- Australia
- ASEAN Countries
- Rest of Asia Pacific
Middle East & Africa
- UAE
- Saudi Arabia
- Qatar
- Egypt
- South Africa
- Rest of Middle East & Africa
Latin America
- Brazil
- Argentina
- Mexico
- Colombia
- Rest of Latin America
Request for Country Level Research Report: Country Level Customization Request
Available Customization
With the given market data, SNS Insider offers customization as per the company’s specific needs. The following customization options are available for the report:
- Detailed Volume Analysis
- Criss-Cross segment analysis (e.g., Product X Application)
- Competitive Product Benchmarking
- Geographic Analysis
- Additional countries in any of the regions
- Customized Data Representation
- Detailed analysis and profiling of additional market players
An accurate research report requires proper strategizing as well as implementation. There are multiple factors involved in the completion of good and accurate research report and selecting the best methodology to compete the research is the toughest part. Since the research reports we provide play a crucial role in any company’s decision-making process, therefore we at SNS Insider always believe that we should choose the best method which gives us results closer to reality. This allows us to reach at a stage wherein we can provide our clients best and accurate investment to output ratio.
Each report that we prepare takes a timeframe of 350-400 business hours for production. Starting from the selection of titles through a couple of in-depth brain storming session to the final QC process before uploading our titles on our website we dedicate around 350 working hours. The titles are selected based on their current market cap and the foreseen CAGR and growth.
The 5 steps process:
Step 1: Secondary Research:
Secondary Research or Desk Research is as the name suggests is a research process wherein, we collect data through the readily available information. In this process we use various paid and unpaid databases which our team has access to and gather data through the same. This includes examining of listed companies’ annual reports, Journals, SEC filling etc. Apart from this our team has access to various associations across the globe across different industries. Lastly, we have exchange relationships with various university as well as individual libraries.

Step 2: Primary Research
When we talk about primary research, it is a type of study in which the researchers collect relevant data samples directly, rather than relying on previously collected data. This type of research is focused on gaining content specific facts that can be sued to solve specific problems. Since the collected data is fresh and first hand therefore it makes the study more accurate and genuine.
We at SNS Insider have divided Primary Research into 2 parts.
Part 1 wherein we interview the KOLs of major players as well as the upcoming ones across various geographic regions. This allows us to have their view over the market scenario and acts as an important tool to come closer to the accurate market numbers. As many as 45 paid and unpaid primary interviews are taken from both the demand and supply side of the industry to make sure we land at an accurate judgement and analysis of the market.
This step involves the triangulation of data wherein our team analyses the interview transcripts, online survey responses and observation of on filed participants. The below mentioned chart should give a better understanding of the part 1 of the primary interview.

Part 2: In this part of primary research the data collected via secondary research and the part 1 of the primary research is validated with the interviews from individual consultants and subject matter experts.
Consultants are those set of people who have at least 12 years of experience and expertise within the industry whereas Subject Matter Experts are those with at least 15 years of experience behind their back within the same space. The data with the help of two main processes i.e., FGDs (Focused Group Discussions) and IDs (Individual Discussions). This gives us a 3rd party nonbiased primary view of the market scenario making it a more dependable one while collation of the data pointers.
Step 3: Data Bank Validation
Once all the information is collected via primary and secondary sources, we run that information for data validation. At our intelligence centre our research heads track a lot of information related to the market which includes the quarterly reports, the daily stock prices, and other relevant information. Our data bank server gets updated every fortnight and that is how the information which we collected using our primary and secondary information is revalidated in real time.

Step 4: QA/QC Process
After all the data collection and validation our team does a final level of quality check and quality assurance to get rid of any unwanted or undesired mistakes. This might include but not limited to getting rid of the any typos, duplication of numbers or missing of any important information. The people involved in this process include technical content writers, research heads and graphics people. Once this process is completed the title gets uploader on our platform for our clients to read it.
Step 5: Final QC/QA Process:
This is the last process and comes when the client has ordered the study. In this process a final QA/QC is done before the study is emailed to the client. Since we believe in giving our clients a good experience of our research studies, therefore, to make sure that we do not lack at our end in any way humanly possible we do a final round of quality check and then dispatch the study to the client.