Allergen Free Food Market Report Scope & Overview:
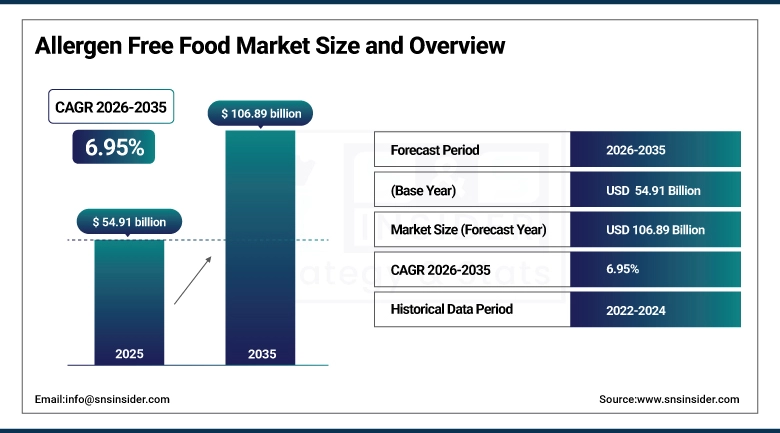
The Allergen Free Food Market size was valued at USD 54.91 Billion in 2025 and is projected to reach USD 106.89 Billion by 2035, growing at a CAGR of 6.95% during the forecast period 2026–2035.
Consumers are increasingly looking for allergen free food across the world as healthy, safe, and inclusive nutrition taking its firm grip globally. Growing proof for home and restaurant feeding on are meals matching dietary choices for dairy, soy, nuts and gluten. Concurrently, the growing incidence of food allergies, improving health standards, and clean label preferences are contributing to the sales of healthy protein in food and beverage products possessing an important protein source. Access to shops, super markets, and the internet is growing, providing great opportunities for international market expansion and innovation.
About 45% of health-conscious consumers regularly purchase allergen free foods through supermarkets and online channels.
Market Size and Forecast:
-
Market Size in 2025: USD 54.91 Billion
-
Market Size by 2035: USD 106.89 Billion
-
CAGR: 6.95% from 2026 to 2035
-
Base Year: 2025
-
Forecast Period: 2026–2035
-
Historical Data: 2022–2024
To Get More Information On Allergen Free Food Market - Request Free Sample Report
Allergen Free Food Market Highlights:
-
The global demand for gluten free bonded class surged up to 16% between 2018–2022 and is among the fastest growing category for allergen free foods segment.
-
Plant-based allergen free snacking is becoming more popular with sales growing nearly 20% in dollar sales between 2022 and 2023 with granola bars, popcorn and baked goods driving the growth.
-
Product innovation remains strong, with a 36% increase in launches soy free over the past 5 years and then nut free solutions for allergy consumers.
-
Organic, allergen free products now represent more than half the market, showcasing consumer demand for clean label, natural, and premium positioned offerings.
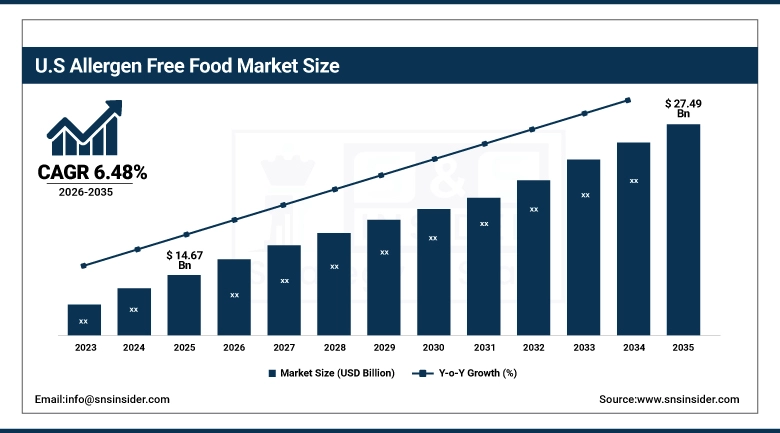
U.S. Allergen Free Food Market Insights
U.S. Allergen Free Food Market size was estimated at USD 14.67 Billion in 2025 which is projected to USD 27.49 Billion by 2035 growing at a CAGR of 6.48%. A rise in the food allergy cases, consumer inclination towards It has been proven that dairy-free, gluten-free products along with rise in health consciousness among manufacturers and consumers are the primary propelling factors for the growth of the market for the sector. However, market growth and investor confidence in long term growth are also bolstered by a strong retail distribution, increasing e-commerce and clean label innovation, as well as premiumization trends and favorable regulatory environment.
Allergen Free Food Market Growth Drivers:
-
Rising Food Allergies and Intolerance Cases are Accelerating Global Demand for Allergen Free Alternatives Across Multiple Food Categories.
The market for allergen-free foods is being driven by the rise in food allergies and intolerances as consumers actively look for inclusive and safe dietary options. According to some studies, the growing number of people suffering from lactose intolerance, nut allergy, gluten sensitivity and soy intolerance has always made people look for substitutes that do not contain any of these allergens. As well as providing more health oriented alternatives, these products also cater for lifestyle choices, which promotes innovation and are improving acceptance of numerous globalised food types.
Over 70% of consumers with food allergies or intolerances actively seek allergen free alternatives, with gluten-free and dairy-free products emerging as the leading segments in the global market.
Allergen Free Food Market Restraints:
-
High Production Costs and Premium Pricing are Major Restraints, Limiting the Cost-effectiveness and Adoption of Allergen Free Food Products on a Large Scale.
The high cost of production and premium price remains an obstacle in the market of allergen-free foods. These types of more stringent safety regulations and specialized manufacturing facilities are often necessary for sourcing certain components such as dairy substitutes, gluten-free grains, and nut-free formulations so that cross-contamination is avoided. These extra procedures lead to higher operating costs, which is reflected in a higher retail price. This in turn makes allergen-free foods more expensive for the general population, restricting their adoption to wealthy segments and hampering their mass-market penetration.
Allergen Free Food Market Opportunities:
-
Expanding Awareness of Food Allergies and Intolerances is Creating Strong Opportunities for Growth and Innovation in Allergen Free Food Products Worldwide.
Opportunities for the market for allergen-free foods are growing as more people become aware of food allergies and intolerances. An increasing consumer awareness regarding the health-associated hazards that gluten, dairy, nuts, and soy present, drive a greater need for trusted and safe alternatives. Better awareness is also forcing customers to demand for allergen-free products due to better media coverage, medical advice and education efforts. This growing body of knowledge facilitates broad global adoption, product diversification, and innovation.
The demand for allergen free and clean-label products is strong, with over 60% of global consumers willing to pay a premium for allergen free and clean-label products. For example, this leads to demand for gluten-free, dairy-free, and nut-free alternatives across many food categories.
Allergen Free Food Market Segmentation Analysis:
-
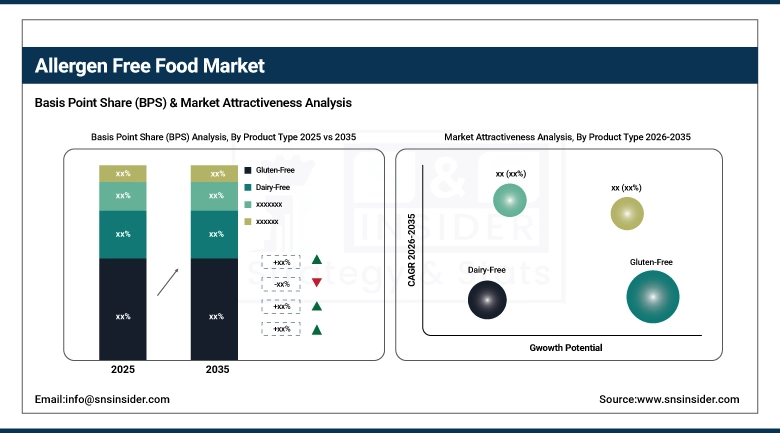
By Product Type, gluten-free emerges as the most adopted allergen free category with a 38.00% share of the market in 2025 and dairy-free substitutes are estimated to be the fastest-growing, at a 7.5% CAGR during 2026–2035.
-
By Application, household consumption remains the largest in 2025 at 60. 00% of volume share as it sees growing consumer demand for allergen free staples as supplied to the everyday diet, while foodservice is the fastest growing channel at a 7.2% CAGR with cafés, bakeries and restaurants adding allergen free offerings to their menus.
-
By Distribution Channel, supermarkets and hypermarkets account for 48.00% share in 2025, while online retail is the fastest growing at 7.8% CAGR, driven by e-commerce penetration and subscription models.
-
By Form, solid products (like allergen free bakery products, snacks, and packaged are estimated to hold market share of 46.00% in 2025 as liquid (comprising allergen free beverages and dairy substitutes) type grow at a highest CAGR of 7.4% during forecast period.
By Product Type, Gluten-Free Leads While Dairy-Free Grows Rapidly
The allergen free food market is largely dominated by gluten free products as these products are recognized by a wider consumer base ranging from celiac disease, gluten intolerance and health conscious consumers. Now, however, they're making a big comeback due to their use in packaged products, snacks and bakery items. Meanwhile, the rapidly expanding dairy-free market is gaining momentum as more and more individuals are on vegan and lactose-free diets. Consumers looking for plant-based and allergen-friendly diets prefer dairy-free beverages and sweets.
By Application, Household Consumption Dominates While Foodservice Fastest Growing
Dominating the market are the allergen free foods that households are stocking in their pantries as families living with food allergies or adopting a healthier lifestyle go allergy-friendly. Far more of a demand of consumer-friendly, clean-label, safe products for cooking, snacking and everyday meal solutions. And with bakeries, restaurants and coffee houses increasingly catering to with a growing presence in the foodservice business, too. Restaurants are adapting to meet the demand for creative, inclusive and safe allergen-friendly dining brought about by increasing consumer awareness.
By Distribution Channel, Supermarkets Dominate While Online Retail Grows Rapidly
Supermarkets/Hypermarkets is the dominant segment in the distribution channel as they offer a wide variety and convenience of shopping all allergen free products in one place. Having long been in that industry is why they are the first choice for all those clients who are interested for safe, and also compliant alternatives. However, internet shopping is taking off because of how easy it is to do, how broad the range is become, and how inventive the styles of presentation of the product and making it available to the public are, and in ways so distant from the drugstore way which is to place things on a shelf. Subscription services are bringing allergen free food to your doorstep – literally – every day and e-commerce platforms are enabling smaller companies to reach a world market with their products.
By Form, Solid Products Lead While Liquid Alternatives Fastest Growing
Solid allergen free foods, including bakery items, snacks, and packaged meals, dominate consumption as they are versatile, convenient, and widely integrated into daily diets. Households find them appealing due to the name and selection. Conversely, liquid options such as plant-based dairy and free-from drinks are quickly multiplying. Whether these products trend more inclusively, offer greater utility, or simply become a health-optimized go-to in any situation, the direction is clear: there is a trend toward more inclusive, utility focused, and healthy beverages..
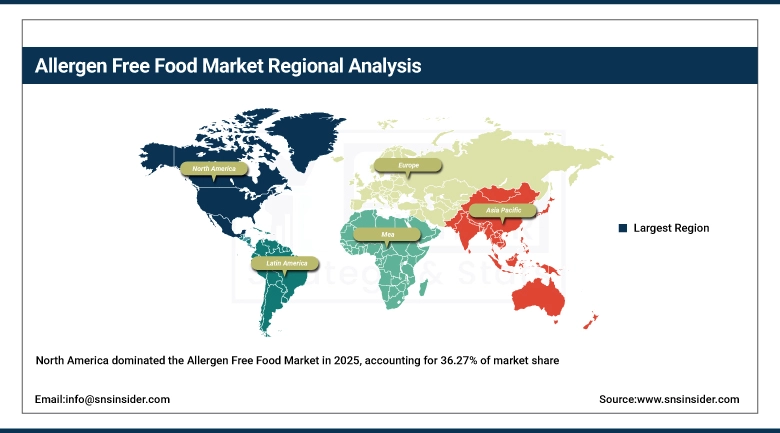
Allergen Free Food Market Regional Analysis:
North America Allergen Free Food Market Insights:
North America dominates the global allergen free food market, holding a 36.27% share in 2025. The Leading position of the region enefits from a high incidence of food allergies, particularly gluten and dairy, and high consumer health and wellness cares. Leading the charge towards innovation are such foods where the presence of allergen-free products can be seen due to availability of more developed foodservice and retail networks in the United States, offering wide range of baked goods, snacks and beverages. But North America is going to need every bit of that new-found emphasis on the clean-label diet, reinforced certification protocol and high-end offerings to stay ahead.
Get Customized Report as Per Your Business Requirement - Enquiry Now
U.S. Allergen Free Food Market Insights
The U.S. leads the allergen free food market within North America, drive the growth owing to the high population of lactose free and gluten free food intolerant population and an increased demand for clean label diets. Hyphenated availability of allergen-free baked goods, snacks, and drinks through sophisticated retail and eCommerce channels and credibility blankets in the form of certification programs. Driven by premiumization, product diversity from plant based innovations, and heightened health consciousness both globally and domestically the US market is particularly well positioned to expand supply and demand for allergen-free foods worldwide.
Asia-Pacific Allergen Free Food Market Insights:
Asia-Pacific is the fastest-growing region, projected to expand at a 7.41% CAGR during 2026–2035. Rising urbanization, middle-class growth, and rising disposable income is creating demand for better quality and safe food substitutes. Countries such as China, India and Japan, have been experiencing growing demand for alternatives with no allergens, following the rising incidence of lactose intolerance as well as wheat allergies. Increasing penetration of e-commerce, indigenous growth of the plant based diet and growing influence of western cuisines on the food offerings have made the burgeon of allergen-free food highly adapted market in the Asia-Pacific.
China Allergen Free Food Market Insights:
China holds the largest market for allergen-free food ingredients market in the Asia-Pacific region, due to its heavily populated consumer base with a rapidly increasing lactose intolerant population and growing health consciousness. China is the growth powerhouse of the region, with fast urbanisation, Western dietary influence, a robust e-commerce, and demand for dairy-free, gluten-free, and other clean-label benefits.
Europe Allergen Free Food Market Insights:
Europe represents a strong market for allergen free foods due to strict regulatory frameworks, consumer demand for transparency, and widespread adoption of gluten-free and dairy-free alternatives. The UK, Germany and France emerge as leading countries when it comes to product innovation, with a focus on the baking and beverage workplaces. Growth continues to be propelled by health-conscious lifestyles and the growing vegan and vegetarian movements. Europe remains a developed yet fast-growing market for allergen-free food products due to its strong retail base and supportive labelling legislation.
UK Allergen Free Food Market Insights:
Europe's allergen free food market is dominated by the UK where the prevalence of gluten and dairy intolerance is high, regulation is tight and consumer awareness strong. With further advancements in both bread and beer innovation, an even more rapid ascent in veganism, and a more established retail scene the UK is leading the region by a considerable margin.
Latin America Allergen Free Food Market Insights:
Latin America is experiencing growing demand for allergen free foods, owing to growing health awareness along with the increasing influence of global dietary trends. Brazil and Mexico are the key markets in the field of growing demand for gluten-free bread and bakery products, and lactose-free dairy. Market growth is also driven by the urbanization and the quick expansion of new retail formats. Free Subscription Experience Full Edition here While price volatility is still dominant, the relative youth of the population and changing taste preferences of the region will allow for the potential for more innovative allergen-free products.
Middle East & Africa Allergen Free Food Market Insights:
The demand of allergen-free food is increasing in the Middle-East and Africa due to rising health awareness and raise in celiac disease as well as in lactose intolerance. Promising The most advanced aspects of the development of what is referred to as high-end allergen-free human food products: these high value products are starting to get noticed even in Gulf countries, which include United Arab Emirates and Saudi Arabia.
Allergen Free Food Market Competitive Landscape:
Nestlé S.A. Nestlé S.A. is a global food and beverage leader with the widest allergen-free foods portfolio including, but not limited to, clean-label, dairy-free, and gluten-free products. Snacks, drinks, and baby food sound too commercial, but the company's muscles are flexing on R&D. Reflecting greater awareness of allergies, brands including Gerber and Garden of Life offer free from or allergenic options, as well as promises of both safety and nutrition. Nestlé: Status as a player, due to status quo relationships, global penetration, strong brand presence and firm commitment to health and well-being influences.
-
In June 2025, Nestlé promised to remove artificial colors from its entire U.S. portfolio by mid-2026, doubling down on its commitment to clean-label ingredients.
Danone S.A. offers a strong portfolio of plant-based and dairy-free products through brands such as Silk and Alpro, which are key players in the allergen-free food market. The business was also benefiting from growing consumer demand for vegan and lactose free alternatives, especially in drinks and yogurts, she added. That, coupled with its commitment to clean label innovation, nutrition and sustainability, further strengthens its positioning in the market. Supported by a global presence with local adaptation, Danone can cater for different consumer demands and ensure persistent growth in allergy free products.
-
In March 2025, Danone launched a new range of dairy-free yogurt alternatives than carry on its well-established Alpro brand, and tapped into the growing consumer need for plant-based and allergen-free alternatives.
Unilever PLC has a good foothold in the allergen free food market, with brands focused on plant-based and allergy-friendly products, including Ben & Jerry Non-Dairy and The Vegetarian Butcher. And it has a worldwide reach and serious marketing clout to propel meatless and dairy-free foods in front of consumers. The focus on allergy issues and appeal to vegans and flexitarian consumers is part of the growing trends in sustainability, well-being and health that Unilever is responding to, as per other recent news in the area. Unilever competes on this front with a global retail footprint and ongoing product innovation.
-
In June 2025, Unilever’s unit Breyers recalled more than 6,600 cases of Rocky Road ice cream that was mislabeled and could have put at risk consumers allergic to nuts.
Allergen Free Food Market Key Players:
-
Nestlé S.A.
-
Danone S.A.
-
Unilever PLC
-
General Mills, Inc.
-
The Hain Celestial Group, Inc.
-
The Kraft Heinz Company
-
Mondelēz International, Inc.
-
Conagra Brands, Inc.
-
Kellogg Company
-
Blue Diamond Growers, Inc.
-
Daiya Foods, Inc.
-
Dr. Schär AG/SpA
-
Enjoy Life Foods, Inc. (a subsidiary of Mondelēz International)
-
Amy’s Kitchen, Inc.
-
Abbott Laboratories, Inc.
-
Boulder Brands, Inc. (a subsidiary of Pinnacle Foods)
-
SunButter LLC
-
Nature’s Path Foods, Inc.
-
Free2b Foods, LLC
-
Earth’s Best Organic (a subsidiary of The Hain Celestial Group, Inc.)
| Report Attributes | Details |
|---|---|
| Market Size in 2025 | USD 54.91 Billion |
| Market Size by 2035 | USD 106.89 Billion |
| CAGR | CAGR of 6.95% From 2026 to 2035 |
| Base Year | 2025 |
| Forecast Period | 2026-2035 |
| Historical Data | 2022-2024 |
| Report Scope & Coverage | Market Size, Segments Analysis, Competitive Landscape, Regional Analysis, DROC & SWOT Analysis, Forecast Outlook |
| Key Segments | • By Product Type (Gluten-Free, Dairy-Free, Nut-Free, Soy-Free, and Others) • By Application (Household, Foodservice, and Institutional) • By Distribution Channel (Supermarkets & Hypermarkets, Specialty Stores, Online Retail, and Direct Sales) • By Form (Solid, Liquid, and Semi-Solid) |
| Regional Analysis/Coverage | North America (US, Canada), Europe (Germany, UK, France, Italy, Spain, Russia, Poland, Rest of Europe), Asia Pacific (China, India, Japan, South Korea, Australia, ASEAN Countries, Rest of Asia Pacific), Middle East & Africa (UAE, Saudi Arabia, Qatar, South Africa, Rest of Middle East & Africa), Latin America (Brazil, Argentina, Mexico, Colombia, Rest of Latin America). |
| Company Profiles | Nestlé S.A., Danone S.A., Unilever PLC, General Mills, Inc., The Hain Celestial Group, Inc., The Kraft Heinz Company, Mondelēz International, Inc., Conagra Brands, Inc., Kellogg Company, Blue Diamond Growers, Inc., Daiya Foods, Inc., Dr. Schär AG/SpA, Enjoy Life Foods, Inc. (a subsidiary of Mondelēz International), Amy’s Kitchen, Inc., Abbott Laboratories, Inc., Boulder Brands, Inc. (a subsidiary of Pinnacle Foods), SunButter LLC, Nature’s Path Foods, Inc., Free2b Foods, LLC, Earth’s Best Organic (a subsidiary of The Hain Celestial Group, Inc.). |
Frequently Asked Questions
North America led the market in 2025, supported by high food allergy prevalence, strong consumer awareness, and advanced retail and foodservice infrastructure.
The gluten-free segment dominates the market, while dairy-free alternatives are the fastest-growing category.
Growth is driven by the rising prevalence of food allergies and intolerances, increasing demand for clean-label products, and growing adoption of plant-based diets.
The market was valued at USD 54.91 Billion in 2025 and is projected to reach USD 106.89 Billion by 2035.
The Allergen Free Food Market is expected to grow at a CAGR of 6.95% during 2026–2035.
Get in Touch
