image

Amplifiers Market Size

Amplifiers Market Revenue Analysis

get more information on Amplifiers Market - Request Sample Report
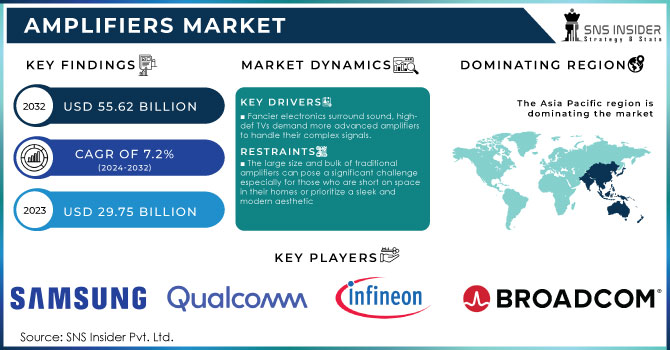
The Amplifiers Market was valued at USD 29.75 billion in 2023 and expected to reach USD 51.9 billion by 2031 and grow at a CAGR of 7.2% over the forecast period 2024-2031.

The amplifier market is raising demand in market by the advancements which are being driven by the need to power ever-more sophisticated consumer electronics and by the demands of new technologies like 5G and the Internet of Things (IoT).

People are demanding better sound and picture quality from their TVs and speakers and that means needing amplifiers that can handle the complex signals from all these fancy electronics. This constant push for innovation creates a never-ending need for more advanced amplifiers. But it's not just about entertainment. The advance world of super-fast 5G networks needs powerful amplifiers to handle the huge amounts of data that lets watch sharp live streams or experience mind-blowing home entertainment. And the Internet of Things (IoT) is adding even more growth to the fire. With all these smart speakers and gadgets talking to each other there's a growing need for special amplifiers to keep them all communicating clearly. As governments around the world invest in building out these next-generation networks and encouraging smart technology, the amplifier market is poised to keep growing for a long time.

Amplifiers Market Overview:

Report Attributes Details
Key Segments • By Product (Transistor Amplifier, Direct Coupled Amplifier, Video Amplifier, Buffer Amplifier, Operational Amplifier, Audio Frequency Amplifier, Intermediate Frequency Amplifier, Ultrasonic Amplifier, Wideband Amplifier, Radio Frequency Amplifier)
• By Type (Power Amplifier , Voltage Amplifier, Current Amplifier)
• By Class (Class-A, Class-B, Class-A/B, Class-G&H, Class-D, Other)
• By Industry (Consumer Audio, Automotive Audio, Computer Audio, Enterprise Audio, Telecommunication, Healthcare, Aerospace, Military & Defense, Other)
Regional Coverage North America (US, Canada, Mexico), Europe (Eastern Europe [Poland, Romania, Hungary, Turkey, Rest of Eastern Europe] Western Europe] Germany, France, UK, Italy, Spain, Netherlands, Switzerland, Austria, Rest of Western Europe]), Asia Pacific (China, India, Japan, South Korea, Vietnam, Singapore, Australia, Rest of Asia Pacific), Middle East & Africa (Middle East [UAE, Egypt, Saudi Arabia, Qatar, Rest of Middle East], Africa [Nigeria, South Africa, Rest of Africa], Latin America (Brazil, Argentina, Colombia, Rest of Latin America)
Company Profiles Samsung Electronics Co Ltd, Qualcomm Inc, Infineon Technologies AG, Xilinx Inc, Texas Instruments Inc, STMicroelectronics, Yamaha, Qorvo, Toshiba Corporatio, Broadcom Inc., Maxim Integrated, NXP Semiconductors, Analog Devices Inc, Infineon Technologies, Analog Devices


MARKET DYNAMICS

KEY DRIVERS:

  • The trend towards premium audio and video experiences

  • Fancier electronics surround sound, high-def TVs demand more advanced amplifiers to handle their complex signals.

The demand for premium audio and video experiences is fueling the amplifier market. As consumers chase immersive entertainment with surround sound systems and high-definition TVs, the need for powerful amplifiers to handle complex signals from these advanced electronics is growing. This constant innovation in consumer electronics creates a ripple effect, requiring ever-more sophisticated amplifiers to keep pace.

RESTRAINTS:

  • The large size and bulk of traditional amplifiers can pose a significant challenge especially for those who are short on space in their homes or prioritize a sleek and modern aesthetic

  • Traditional amplifiers are big and heavy it costs more to move them around at every stage of the process from factories to stores and even to your home.

OPPORTUNITIES:

  • With the expanding reach of 4G and the growth of 5G networks we are witnessing a significant transformation in the way we access and consume data

  • Voice assistants like Alexa and Google Home demand amplifiers for clear voice control.

The amplifier market is being amplified by next-generation connectivity. As 5G networks roll out more powerful amplifiers are needed to handle the richer data streams that enable high-definition live experiences and immersive home entertainment. Beyond entertainment the ever-expanding Internet of Things creates a demand for specialized amplifiers to ensure clear communication between the growing network of interconnected devices from smart speakers like Alexa to a variety of industrial applications.

CHALLENGES:

  • Streaming and Bluetooth speakers mean fewer people need separate amplifiers.

  • The rise of streaming services like music and video platforms has led to a shift in how consumers experience audio and visual content potentially reducing their dependence on traditional dedicate amplifiers.

IMPACT OF RUSSIA-UKRAINE WAR

The war between Russia-Ukraine is causing problems for companies which makes amplifiers. Even though stereos and speakers are the most popular kind of amplifier sold for things like home entertainment. Most of the amplifiers are actually used in cell phones and other mobile devices are more than a quarter of all amplifiers. This is the area that will likely be hurt the most by the war. Russia is the major supplier of important materials like platinum which is used in parts of amplifiers called sensors and makes up 10% of the world's supply is no longer selling these materials to many countries. This disruption combined with potential gas shortages in Europe which supplies more than half of the energy used in the European Union and could impact the production of computer chips creates a very difficult situation for companies that make amplifiers.

IMPACT OF ECONOMIC SLOWDOWN

An economic slowdown could hit the impact on amplifier market by showing thing like when times get difficult the companies making amplifiers might wait to buy new machines with fancy features like AI. This could slow down the market's growth since new technology is a big selling point for electronics. Also people might be less likely to go all out on top-of-the-line amplifiers with the best sound and picture. This means fewer people buying the powerful amplifiers needed for those features which again hurts the market.

KEY MARKET SEGMENTS

   By Type

  • Power Amplifier  

  • Voltage Amplifier

  • Current Amplifier

The power amplifiers hold the dominant position in the market. This is driven by the high demand for strong audio experiences in consumer electronics like smartphones, home theaters and car audio systems. These devices rely on power amplifiers to boost weak signals for clear and powerful sound.
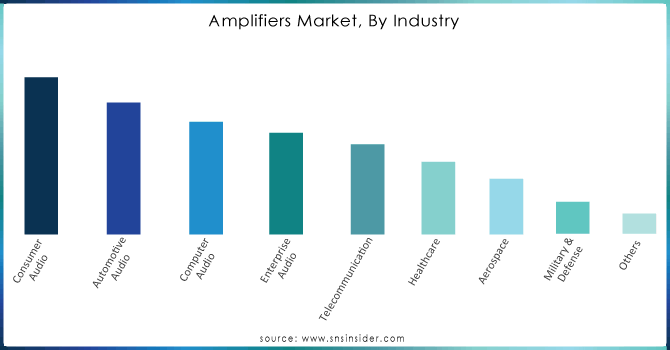
By Product

  • Transistor Amplifier

  • Direct Coupled Amplifier

  • Video Amplifier

  • Buffer Amplifier

  • Operational Amplifier

  • Audio Frequency Amplifier

  • Intermediate Frequency Amplifier

  • Ultrasonic Amplifier

  • Wideband Amplifier

  • Radio Frequency Amplifier

By Class

  • Class-A

  • Class-B

  • Class-A/B

  • Class-G&H

  • Class-D

  • Other

By Industry

  • Consumer Audio

  • Automotive Audio

  • Computer Audio

  • Enterprise Audio

  • Telecommunication

  • Healthcare

  • Aerospace

  • Military & Defense

  • Others

The consumer audio market dominates the amplifier market  driven by the rising popularity of music streaming services, home entertainment systems and portable speakers. The increasing demand for high-quality audio experiences fuels the need for powerful and efficient amplifiers in these consumer electronics.

Amplifier-Market-By-Industry

To Get Customized Report as per your Business Requirement - Request For Customized Report
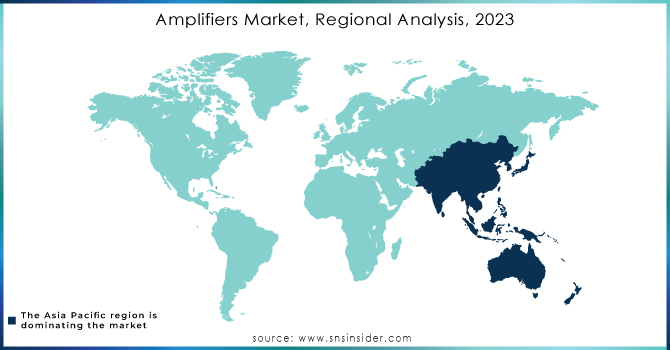
REGIONAL ANALYSIS:

The Asia Pacific region is dominant in the amplifier market driven by a confluence of factors. Its massive population especially in increasing economies like China and India creates a vast potential consumer base for electronics that rely on amplifiers. These growing economies in Asia mean people have more money to spend on things they want like fancy electronics with speakers that need amplifiers. And lots of big electronics companies already make their products in Asia so it's an easy place to sell more amplifiers.

The North America is a fastest growing region for top-notch audio experiences driving demand for powerful and complex amplifiers during the forecast periods. Europe has a well-established consumer electronics market with a high emphasis on quality audio experiences which translates to a steady demand for amplifiers.

Amplifiers-Market--By-Region

REGIONAL COVERAGE:

North America

  • US

  • Canada

  • Mexico

Europe

  • Eastern Europe

    • Poland

    • Romania

    • Hungary

    • Turkey

    • Rest of Eastern Europe

  • Western Europe

    • Germany

    • France

    • UK

    • Italy

    • Spain

    • Netherlands

    • Switzerland

    • Austria

    • Rest of Western Europe

Asia Pacific

  • China

  • India

  • Japan

  • South Korea

  • Vietnam

  • Singapore

  • Australia

  • Rest of Asia Pacific

Middle East & Africa

  • Middle East

    • UAE

    • Egypt

    • Saudi Arabia

    • Qatar

    • Rest of the Middle East

  • Africa

    • Nigeria

    • South Africa

    • Rest of Africa

Latin America

  • Brazil

  • Argentina

  • Colombia

  • Rest of Latin America

KEY PLAYERS :

The key players in amplifiers are Samsung Electronics Co Ltd, Qualcomm Inc, Infineon Technologies AG, Xilinx Inc, Texas Instruments Inc, STMicroelectronics, Yamaha, Qorvo, Toshiba Corporation, Broadcom Inc., Maxim Integrated, NXP Semiconductors, Analog Devices Inc, Infineon Technologies, Analog Devices and Other.

Toshiba Corporation-Company Financial Analysis

Company Landscape Analysis

RECENT DEVELOPMENT

In February 2024: Big news for industrial designers is the STMicro, ADI, and Rohm released new op amps boasting low offset, low drift and wide gain bandwidth - perfect for next-gen industrial applications.

Amplifiers Market Report Scope:

Report Attributes Details
Market Size in 2023 US$ 29.75 Billion
Market Size by 2031 US$ 51.9 Billion
CAGR CAGR of 7.2% From 2023 to 2030
Base Year 2023
Forecast Period 2024-2031
Historical Data 2020-2022
Report Scope & Coverage Market Size, Segments Analysis, Competitive  Landscape, Regional Analysis, DROC & SWOT Analysis, Forecast Outlook
Key Drivers • The trend towards premium audio and video experiences
• Fancier electronics surround sound, high-def TVs demand more advanced amplifiers to handle their complex signals.
Restraints • The large size and bulk of traditional amplifiers can pose a significant challenge especially for those who are short on space in their homes or prioritize a sleek and modern aesthetic
• Traditional amplifiers are big and heavy it costs more to move them around at every stage of the process from factories to stores and even to your home.

Frequently Asked Questions

Ans:  The Amplifiers Market is expected to grow at a CAGR of 7.2%.

Ans: Amplifiers Market size was USD 29.75 billion in 2023 and is expected to Reach USD 51.9 billion by 2031.

Ans: The trend towards premium audio and video experiences.

Ans: The size of amplifiers can be a challenge for space and style

Ans: The Asia Pacific region reigns supreme in the amplifier market driven by a confluence of factors.

TABLE OF CONTENTS

1. Introduction
1.1 Market Definition
1.2 Scope
1.3 Research Assumptions

2. Industry Flowchart

3. Research Methodology

4. Market Dynamics
4.1 Drivers
4.2 Restraints
4.3 Opportunities
4.4 Challenges

5. Impact Analysis
5.1 Impact of Russia-Ukraine Crisis
5.2 Impact of Economic Slowdown on Major Countries
5.2.1 Introduction
5.2.2 United States
5.2.3 Canada
5.2.4 Germany
5.2.5 France
5.2.6 UK
5.2.7 China
5.2.8 Japan
5.2.9 South Korea
5.2.10 India

6. Value Chain Analysis

7. Porter’s 5 Forces Model

8. Pest Analysis

9. Amplifiers Market Segmentation, By Product
9.1 Introduction
9.2 Trend Analysis
9.3Transistor Amplifier
9.4 Direct Coupled Amplifier
9.5 Video Amplifier
9.6 Buffer Amplifier
9.7 Operational Amplifier
9.8 Audio Frequency Amplifier
9.9 Intermediate Frequency Amplifier
9.10 Ultrasonic Amplifier
9.11 Wideband Amplifier
9.12 Radio Frequency Amplifier

10. Amplifiers Market Segmentation, By Type
10.1 Introduction
10.2 Trend Analysis
10.3 Power Amplifier
10.4 Voltage Amplifier
10.5 Current Amplifier

11. Amplifiers Market Segmentation, By Class
11.1 Introduction
11.2 Trend Analysis
11.3  Class-A
11.4 Class-B
11.5 Class-A/B
11.5 Class-G&H
11.6 Class-D
11.7 Other

12. Amplifiers Market Segmentation, By Industry
12.1 Introduction
12.2 Trend Analysis
12.3 Class-A
12.4 Class-B
12.5 Class-A/B
12.6 Class-G&H
12.7 Class-D
12.8 Other

13. Regional Analysis
13.1 Introduction
13.2 North America
13.2.1 Trend Analysis
13.2.2 North America Amplifiers Market by Country
13.2.3 North America Amplifiers Market, By Product
13.2.4 North America Amplifiers Market, By Type
13.2.5 North America Amplifiers Market, By Class
13.2.6 North America Amplifiers Market, By Industry
13.2.7 USA
13.2.7.1 USA Amplifiers Market By Product
13.2.7.2 USA Amplifiers Market By Type
13.2.7.3 USA Amplifiers Market By Class
13.2.7.4 USA Amplifiers Market By Industry
13.2.8 Canada
13.2.8.1 Canada Amplifiers Market By Product
13.2.8.2 Canada Amplifiers Market By Type
13.2.8.3 Canada Amplifiers Market Market By Class
13.2.8.4 Canada Amplifiers Market Market By Industry
13.2.9 Mexico
13.2.9.1 Mexico Amplifiers Market By Product
13.2.9.2 Mexico Amplifiers Market By Type
13.2.9.3 Mexico Amplifiers Market By Class
13.2.9.4 Mexico Amplifiers Market By Industry
13.3 Europe
13.3.1 Trend Analysis
13.3.2 Eastern Europe
13.3.2.1 Eastern Europe Amplifiers Market by Country
13.3.2.2 Eastern Europe Amplifiers Market By Product
13.3.2.3 Eastern Europe Amplifiers Market By Type
13.3.2.4 Eastern Europe Amplifiers Market By Class
13.3.2.5 Eastern Europe Amplifiers Market By Industry
13.3.2.6 Poland
13.3.2.6.1 Poland Amplifiers Market By Product
13.3.2.6.2 Poland Amplifiers Market By Type
13.3.2.6.3 Poland Amplifiers Market By Class
13.3.2.6.4 Poland Amplifiers Market By Industry
13.3.2.7 Romania
13.3.2.7.1 Romania Amplifiers Market By Product
13.3.2.7.2 Romania Amplifiers Market By Type
13.3.2.7.3 Romania Amplifiers Market By Class
13.3.2.7.4 Romania Amplifiers Market By Industry
13.3.2.8 Hungary
13.3.2.8.1 Hungary Amplifiers Market By Product
13.3.2.8.2 Hungary Amplifiers Market By Type
13.3.2.8.3 Hungary Amplifiers Market By Class
13.3.2.8.4 Hungary Amplifiers Market By Industry
13.3.2.9 Turkey
13.3.2.9.1 Turkey Amplifiers Market By Product
13.3.2.9.2 Turkey Amplifiers Market By Type
13.3.2.9.3 Turkey Amplifiers Market By Class
13.3.2.9.4 Turkey Amplifiers Market By Industry
13.3.2.10 Rest of Eastern Europe
13.3.2.10.1 Rest of Eastern Europe Amplifiers Market By Product
13.3.2.10.2 Rest of Eastern Europe Amplifiers Market By Type
13.3.2.10.3 Rest of Eastern Europe Amplifiers Market By Class
13.3.2.10.4 Rest of Eastern Europe Amplifiers Market By Industry
13.3.3 Western Europe
13.3.3.1 Western Europe Amplifiers Market by Country
13.3.3.2 Western Europe Amplifiers Market By Product
13.3.3.3 Western Europe Amplifiers Market By Type
13.3.3.4 Western Europe Amplifiers Market By Class
13.3.3.5 Western Europe Amplifiers Market By Industry
13.3.3.6 Germany
13.3.3.6.1 Germany Amplifiers Market By Product
13.3.3.6.2 Germany Amplifiers Market By Type
13.3.3.6.3 Germany Amplifiers Market By Class
13.3.3.6.4 Germany Amplifiers Market By Industry
13.3.3.7 France
13.3.3.7.1 France Amplifiers Market By Product
13.3.3.7.2 France Amplifiers Market By Type
13.3.3.7.3 France Amplifiers Market By Class
13.3.3.7.4 France Amplifiers Market By Industry
13.3.3.8 UK
13.3.3.8.1 UK Amplifiers Market By Product
13.3.3.8.2 UK Amplifiers Market By Type
13.3.3.8.3 UK Amplifiers Market By Class
13.3.3.8.4 UK Amplifiers Market By Industry
13.3.3.9 Italy
13.3.3.9.1 Italy Amplifiers Market, By Product
13.3.3.9.2 Italy Amplifiers Market By Type
13.3.3.9.3 Italy Amplifiers Market By Class
13.3.3.9.4 Italy Amplifiers Market By Industry
13.3.3.10 Spain
13.3.3.10.1 Spain Amplifiers Market By Product
13.3.3.10.2 Spain Amplifiers Market By Type
13.3.3.10.3 Spain Amplifiers Market By Class
13.3.3.10.4 Spain Amplifiers Market By Industry
13.3.3.11 Netherlands
13.3.3.11.1 Netherlands Amplifiers Market By Product
13.3.3.11.2 Netherlands Amplifiers Market By Type
13.3.3.11.3 Netherlands Amplifiers Market By Class
13.3.3.11.4 Netherlands Amplifiers Market By Industry
13.3.3.12 Switzerland
13.3.3.12.1 Switzerland Amplifiers Market By Product
13.3.3.12.2 Switzerland Amplifiers Market By Type
13.3.3.12.3 Switzerland Amplifiers Market By Class
13.3.3.12.4 Switzerland Amplifiers Market By Industry
13.3.3.13 Austria
13.3.3.13.1 Austria Amplifiers Market By Product
13.3.3.13.2 Austria Amplifiers Market By Type
13.3.3.13.3 Austria Amplifiers Market By Class
13.3.3.13.4 Austria Amplifiers Market By Industry
13.3.3.14 Rest of Western Europe
13.3.3.14.1 Rest of Western Europe Amplifiers Market By Product
13.3.3.14.2 Rest of Western Europe Amplifiers Market By Type
13.3.3.14.3 Rest of Western Europe Amplifiers Market By Class
13.3.3.14.4 Rest of Western Europe Amplifiers Market By Industry
13.4 Asia-Pacific
13.4.1 Trend Analysis
13.4.2 Asia-Pacific Amplifiers Market by Country
13.4.3 Asia-Pacific Amplifiers Market By Product
13.4.4 Asia-Pacific Amplifiers Market By Type
13.4.5 Asia-Pacific Amplifiers Market By Class
13.4.6 Asia-Pacific Amplifiers Market By Industry
13.4.7 China
13.4.7.1 China Amplifiers Market By Product
13.4.7.2 China Amplifiers Market By Type
13.4.7.3 China Amplifiers Market By Class
13.4.7.4 China Amplifiers Market By Industry
13.4.8 India
13.4.8.1 India Amplifiers Market By Product
13.4.8.2 India Amplifiers Market By Type
13.4.8.3 India Amplifiers Market By Class
13.4.8.4 India Amplifiers Market By Industry
13.4.9 Japan
13.4.9.1 Japan Amplifiers Market By Product
13.4.9.2 Japan Amplifiers Market By Type
13.4.9.3 Japan Amplifiers Market By Class
13.4.9.4 Japan Amplifiers Market By Industry
13.4.10 South Korea
13.4.10.1 South Korea Amplifiers Market By Product
13.4.10.2 South Korea Amplifiers Market By Type
13.4.10.3 South Korea Amplifiers Market By Class
13.4.10.4 South Korea Amplifiers Market By Industry
13.4.11 Vietnam
13.4.11.1 Vietnam Amplifiers Market By Product
13.4.11.2 Vietnam Amplifiers Market By Type
13.4.11.3 Vietnam Amplifiers Market By Class
13.4.11.4 Vietnam Amplifiers Market By Industry
13.4.12 Singapore
13.4.12.1 Singapore Amplifiers Market By Product
13.4.12.2 Singapore Amplifiers Market By Type
13.4.12.3 Singapore Amplifiers Market By Class
13.4.12.4 Singapore Amplifiers Market By Industry
13.4.13 Australia
13.4.13.1 Australia Amplifiers Market By Product
13.4.13.2 Australia Amplifiers Market By Type
13.4.13.3 Australia Amplifiers Market By Class
13.4.13.4 Australia Amplifiers Market By Industry
13.4.14 Rest of Asia-Pacific
13.4.14.1 Rest of Asia-Pacific Amplifiers Market By Product
13.4.14.2 Rest of Asia-Pacific Amplifiers Market By Type
13.4.14.3 Rest of Asia-Pacific Amplifiers Market By Class
13.4.14.4 Rest of Asia-Pacific Amplifiers Market By Industry
13.5 Middle East & Africa
13.5.1 Trend Analysis
13.5.2 Middle East
13.5.2.1 Middle East Amplifiers Market by Country
13.5.2.2 Middle East Amplifiers Market By Product
13.5.2.3 Middle East Amplifiers Market By Type
13.5.2.4 Middle East Amplifiers Market By Class
13.5.2.5 Middle East Amplifiers Market By Industry
13.5.2.6 UAE
13.5.2.6.1 UAE Amplifiers Market By Product
13.5.2.6.2 UAE Amplifiers Market By Type
13.5.2.6.3 UAE Amplifiers Market By Class
13.5.2.6.4 UAE Amplifiers Market By Industry
13.5.2.7 Egypt
13.5.2.7.1 Egypt Amplifiers Market By Product
13.5.2.7.2 Egypt Amplifiers Market By Type
13.5.2.7.3 Egypt Amplifiers Market By Class
13.5.2.7.4 Egypt Amplifiers Market By Industry
13.5.2.8 Saudi Arabia
13.5.2.8.1 Saudi Arabia Amplifiers Market By Product
13.5.2.8.2 Saudi Arabia Amplifiers Market By Type
13.5.2.8.3 Saudi Arabia Amplifiers Market By Class
13.5.2.8.4 Saudi Arabia Amplifiers Market By Industry
13.5.2.9 Qatar
13.5.2.9.1 Qatar Amplifiers Market By Product
13.5.2.9.2 Qatar Amplifiers Market By Type
13.5.2.9.3 Qatar Amplifiers Market By Class
13.5.2.9.4 Qatar Amplifiers Market By Industry
13.5.2.10 Rest of Middle East
13.5.2.10.1 Rest of Middle East Amplifiers Market By Product
13.5.2.10.2 Rest of Middle East Amplifiers Market By Type
13.5.2.10.3 Rest of Middle East Amplifiers Market By Class
13.5.2.10.4 Rest of Middle East Amplifiers Market By Industry
13.5.3 Africa
13.5.3.1 Africa Amplifiers Market by Country
13.5.3.2 Africa Amplifiers Market By Product
13.5.3.3 Africa Amplifiers Market By Type
13.5.3.4 Africa Amplifiers Market By Class
13.5.3.5 Africa Amplifiers Market By Industry
13.5.3.6 Nigeria
13.5.3.6.1 Nigeria Amplifiers Market By Product
13.5.3.6.2 Nigeria Amplifiers Market By Type
13.5.3.6.3 Nigeria Amplifiers Market By Class
13.5.3.6.4 Nigeria Amplifiers Market By Industry
13.5.3.7 South Africa
13.5.3.7.1 South Africa Amplifiers Market By Product
13.5.3.7.2 South Africa Amplifiers Market By Type
13.5.3.7.3 South Africa Amplifiers Market By Class
13.5.3.7.4 South Africa Amplifiers Market By Industry
13.5.3.8 Rest of Africa
13.5.3.8.1 Rest of Africa Amplifiers Market By Product
13.5.3.8.2 Rest of Africa Amplifiers Market By Type
13.5.3.8.3 Rest of Africa Amplifiers Market By Class
13.5.3.8.4 Rest of Africa Amplifiers Market By Industry
13.6 Latin America
13.6.1 Trend Analysis
13.6.2 Latin America Amplifiers Market by country
13.6.3 Latin America Amplifiers Market, By Product
13.6.4 Latin America Amplifiers Market, By Type
13.6.5 Latin America Amplifiers Market, By Class
13.6.6 Latin America Amplifiers Market, By Industry
13.6.7 Brazil
13.6.7.1 Brazil Amplifiers Market By Product
13.6.7.2 Brazil Amplifiers Market By Type
13.6.7.3 Brazil Amplifiers Market By Class
13.6.7.4 Brazil Amplifiers Market By Industry
13.6.8 Argentina
13.6.8.1 Argentina Amplifiers Market By Product
13.6.8.2 Argentina Amplifiers Market By Type
13.6.8.3 Argentina Amplifiers Market By Class
13.6.8.4 Argentina Amplifiers Market By Industry
13.6.9 Colombia
13.6.9.1 Colombia Amplifiers Market By Product
13.6.9.2 Colombia Amplifiers Market By Type
13.6.9.3 Colombia Amplifiers Market By Class
13.6.9.4 Colombia Amplifiers Market By Industry
13.6.10 Rest of Latin America
13.6.10.1 Rest of Latin America Amplifiers Market, By Product
13.6.10.2 Rest of Latin America Amplifiers Market, By Type
13.6.10.3 Rest of Latin America Amplifiers Market, By Class
13.6.10.4 Rest of Latin America Amplifiers Market, By Industry

14. Company Profiles
14.1 Samsung Electronics Co Ltd
14.1.1 Company Overview
14.1.2 Financial
14.1.3 Products/ Services Offered
14.1.4 SWOT Analysis
14.1.5 The SNS View
14.2 Qualcomm Inc
14.2.1 Company Overview
14.2.2 Financial
14.2.3 Products/ Services Offered
14.2.4 SWOT Analysis
14.2.5 The SNS View
14.3 Infineon Technologies AG
14.3.1 Company Overview
14.3.2 Financial
14.3.3 Products/ Services Offered
14.3.4 SWOT Analysis
14.3.5 The SNS View
14.4 Xilinx Inc
14.4.1 Company Overview
14.4.2 Financial
14.4.3 Products/ Services Offered
14.4.4 SWOT Analysis
14.4.5 The SNS View
14.5 Texas Instruments Inc
14.5.1 Company Overview
14.5.2 Financial
14.5.3 Products/ Services Offered
14.5.4 SWOT Analysis
14.5.5 The SNS View
14.6 STMicroelectronics
14.6.1 Company Overview
14.6.2 Financial
14.6.3 Products/ Services Offered
14.6.4 SWOT Analysis
14.6.5 The SNS View
14.7  Yamaha, Qorvo
14.7.1 Company Overview
14.7.2 Financial
14.7.3 Products/ Services Offered
14.7.4 SWOT Analysis
14.7.5 The SNS View
14.8 Toshiba Corporation
14.8.1 Company Overview
14.8.2 Financial
14.8.3 Products/ Services Offered
14.8.4 SWOT Analysis
14.8.5 The SNS View
14..9  Broadcom Inc.,
14.9.1 Company Overview
14.9.2 Financial
14.9.3 Products/ Services Offered
14.9.4 SWOT Analysis
14.9.5 The SNS View
14.10Maxim Integrated
14.10.1 Company Overview
14.10.2 Financial
14.10.3 Products/ Services Offered
14.10.4 SWOT Analysis
14.10.5 The SNS View
14.11 NXP Semiconductors
14.11.1 Company Overview
14.11.2 Financial
14.11.3 Products/ Services Offered
14.11.4 SWOT Analysis
14.11.5 The SNS View
14.12 Analog Devices Inc
14.12.1 Company Overview
14.12.2 Financial
14.12.3 Products/ Services Offered
14.12 .4 SWOT Analysis
14.12.5 The SNS View
14.13 Infineon Technologies
14.13.1 Company Overview
14.13.2 Financial
14.13.3 Products/ Services Offered
14.13 .4 SWOT Analysis
14.13.5 The SNS View
14.14 Analog Devices 
14.14.1 Company Overview
14.14.2 Financial
14.14.3 Products/ Services Offered
14.14 .4 SWOT Analysis
14.14.5 The SNS View

15. Competitive Landscape
15.1 Competitive Benchmarking
15.2 Market Share Analysis
15.3 Recent Developments
15.3.1 End User News
15.3.2 Company News
15.3.3 Mergers & Acquisitions

16. Use Case and Best Practices

17. Conclusion

An accurate research report requires proper strategizing as well as implementation. There are multiple factors involved in the completion of good and accurate research report and selecting the best methodology to compete the research is the toughest part. Since the research reports we provide play a crucial role in any company’s decision-making process, therefore we at SNS Insider always believe that we should choose the best method which gives us results closer to reality. This allows us to reach at a stage wherein we can provide our clients best and accurate investment to output ratio.

Each report that we prepare takes a timeframe of 350-400 business hours for production. Starting from the selection of titles through a couple of in-depth brain storming session to the final QC process before uploading our titles on our website we dedicate around 350 working hours. The titles are selected based on their current market cap and the foreseen CAGR and growth.


The 5 steps process:

Step 1: Secondary Research:

Secondary Research or Desk Research is as the name suggests is a research process wherein, we collect data through the readily available information. In this process we use various paid and unpaid databases which our team has access to and gather data through the same. This includes examining of listed companies’ annual reports, Journals, SEC filling etc. Apart from this our team has access to various associations across the globe across different industries. Lastly, we have exchange relationships with various university as well as individual libraries.

Secondary Research

Step 2: Primary Research

When we talk about primary research, it is a type of study in which the researchers collect relevant data samples directly, rather than relying on previously collected data.  This type of research is focused on gaining content specific facts that can be sued to solve specific problems. Since the collected data is fresh and first hand therefore it makes the study more accurate and genuine.

We at SNS Insider have divided Primary Research into 2 parts.

Part 1 wherein we interview the KOLs of major players as well as the upcoming ones across various geographic regions. This allows us to have their view over the market scenario and acts as an important tool to come closer to the accurate market numbers. As many as 45 paid and unpaid primary interviews are taken from both the demand and supply side of the industry to make sure we land at an accurate judgement and analysis of the market.

This step involves the triangulation of data wherein our team analyses the interview transcripts, online survey responses and observation of on filed participants. The below mentioned chart should give a better understanding of the part 1 of the primary interview.

Primary Research

Part 2: In this part of primary research the data collected via secondary research and the part 1 of the primary research is validated with the interviews from individual consultants and subject matter experts.

Consultants are those set of people who have at least 12 years of experience and expertise within the industry whereas Subject Matter Experts are those with at least 15 years of experience behind their back within the same space. The data with the help of two main processes i.e., FGDs (Focused Group Discussions) and IDs (Individual Discussions). This gives us a 3rd party nonbiased primary view of the market scenario making it a more dependable one while collation of the data pointers.

Step 3: Data Bank Validation

Once all the information is collected via primary and secondary sources, we run that information for data validation. At our intelligence centre our research heads track a lot of information related to the market which includes the quarterly reports, the daily stock prices, and other relevant information. Our data bank server gets updated every fortnight and that is how the information which we collected using our primary and secondary information is revalidated in real time.

Data Bank Validation

Step 4: QA/QC Process

After all the data collection and validation our team does a final level of quality check and quality assurance to get rid of any unwanted or undesired mistakes. This might include but not limited to getting rid of the any typos, duplication of numbers or missing of any important information. The people involved in this process include technical content writers, research heads and graphics people. Once this process is completed the title gets uploader on our platform for our clients to read it.

Step 5: Final QC/QA Process:

This is the last process and comes when the client has ordered the study. In this process a final QA/QC is done before the study is emailed to the client. Since we believe in giving our clients a good experience of our research studies, therefore, to make sure that we do not lack at our end in any way humanly possible we do a final round of quality check and then dispatch the study to the client.


  •            5000 (33% Discount)


  •            8950 (40% Discount)


  •            3050 (23% Discount)

Start a Conversation

Hi! Click one of our member below to chat on Phone