Power MOSFET Market Size Analysis:
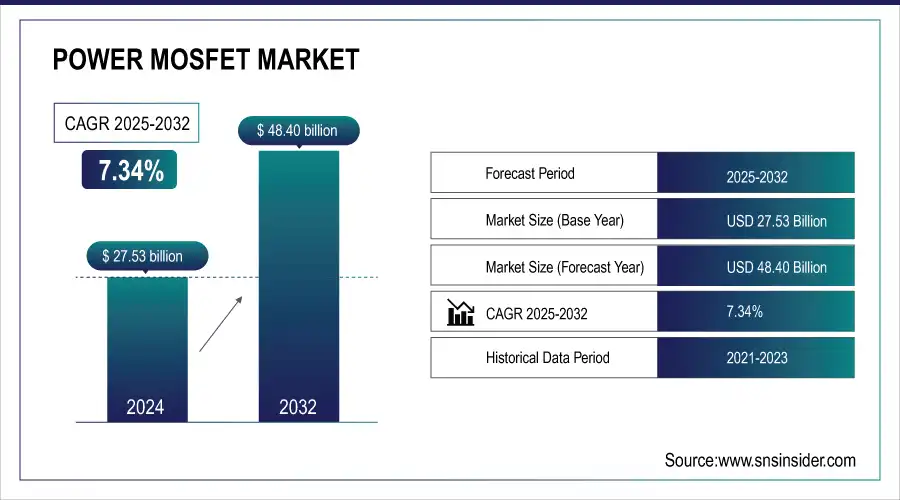
The Power MOSFET Market size was valued at USD 27.53 billion in 2024 and is expected to reach USD 48.40 billion by 2032, growing at a CAGR of 7.34% over the forecast period of 2025-2032.
To Get more information On Power MOSFET Market - Request Free Sample Report
Need for power-efficient electronic systems is the major driving force for the power MOSFET market as they are trending due to their high switching speed, high-power capabilities, and energy-efficient property, coupled with rapid adoption in electric vehicles, renewable energy systems, industrial automation, and high-performance consumer electronics demanding fast switching and low power loss.
Rapid development of battery technology, coupled with increasing traction for electric vehicles, is expected to propel the growth of the boost power MOSFET market. Electrification trends, semiconductor technology advances, and greater use in consumer electronics are only further fueling adoption. In modern power management applications, power MOSFETs are very efficient, small, and thermally advantageous devices. Additionally, the expanding scope of the market is also supported by the emerging trends of IoT, 5G, and smart grids.
-
General Motors, in collaboration with LG Energy Solution, is developing lithium manganese-rich (LMR) battery technology, aiming to deliver up to 400 miles of range. These advancements necessitate efficient power conversion, where Power MOSFETs play a crucial role.
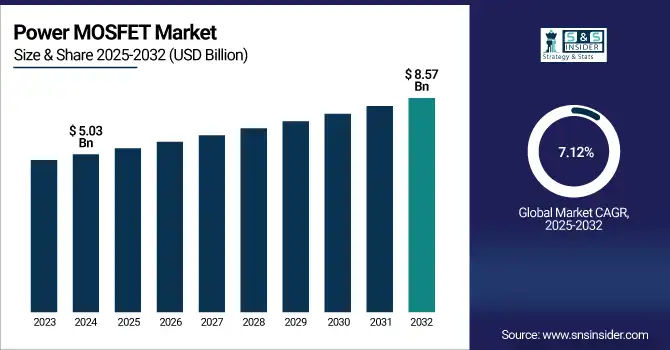
The U.S. power MOSFET market size is estimated to be valued at USD 5.03 billion in 2024 and is projected to grow at a CAGR of 7.12%, reaching USD 8.57 billion by 2032. The U.S. power MOSFET market growth is driven by rapid transportation electrification, growing industrial automation investments, and upgrading power infrastructure. The presence of a large number of key semiconductor manufacturers, along with increasing R&D for power electronics, enables innovation.
Power MOSFET Market Dynamics:
Key Drivers:
-
Power MOSFET Market Growth is Driven by Miniaturization Energy Efficiency and Rising Electrification Across Key Sectors
Rapidly rising demand for small-sized, high-performance, and compact energy-efficient power devices in the automotive, industrial, and consumer electronics sectors is anticipated to drive the growth of the power MOSFET market over the forecast period. As the competition between electric vehicle (EV) and hybrid electric vehicle (HEV) gains momentum, the demand for high-performance and efficient power conversion systems utilizing power MOSFET has become increasingly important. These factors highlight key power MOSFET market trends, including miniaturization, energy efficiency, and the shift toward electrification across industries.
-
China plans to invest up to USD 800 billion by 2030 in upgrading its electricity grid, including ultra-high-voltage lines. Such investments enhance the deployment of power MOSFETs in grid applications, supporting efficient power distribution and management.
Restraints:
-
Challenges Occur in Manufacturing Advanced MOSFETs Due to Material Complexity and Design Constraints for Industrial Applications
The high-achieving MOSFETs come with a major drawback, as the manufacturing of advanced MOSFETs involves layers of sophistication, particularly in the case of high-quality materials, such as silicon carbide (SiC) and gallium nitride (GaN). These materials typically possess unique processing methods that restrict production scale and efficiency. Furthermore, design constraints at these high voltage and high-power limits may prevent the implementation of power MOSFETs in some areas where the needs of specific industrial applications may exceed what a Power MOSFET can simultaneously provide.
Opportunities:
-
Advancements in SiC GaN and IoT 5G Open New Growth Opportunities for MOSFETs in Power Systems
Recent advancements in semiconductor technology, led by silicon carbide (SiC) and gallium nitride (GaN) materials, are opening up new growth trajectories for pre-existing currents with increased voltage capabilities and thermal performance. In addition to this, the growing number of IoT and 5G devices also create very appealing opportunities for MOSFETs in very compact power systems. A long-term opportunity for innovation and market expansion exists on the back of continued digital transformation and automation in industries enabled by a conducive government policy regime and incentives.
-
In March 2024, the U.S. National Telecommunications and Information Administration (NTIA) made over USD 800 million available to states and territories for digital equity projects. Such support accelerates the adoption of advanced technologies, including power semiconductors, fostering innovation and market expansion
Challenges:
-
Thermal Management and Market Fragmentation Pose Challenges for MOSFET Reliability in Power Systems
The significant challenge is the thermal management of MOSFETs in power systems. As power devices grow larger and larger and operate with an increasing capacity, dissipating heat to avoid overheating is becoming a key challenge. This is especially the case in applications that need constant power output, such as electric vehicles and industrial automation. Market fragmentation and a multitude of suppliers with widely differing quality standards are prone to generating inconsistency in product reliability, posing obstacles for end-users in industries reliant on high-performance devices.
Power MOSFET Market Segmentation Analysis:
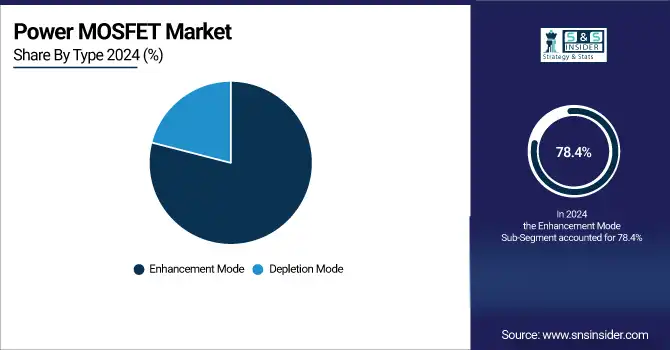
By Type
In 2024, enhancement mode captured 78.4% of the power MOSFET market share and will retain the largest revenue share throughout the forecast period, while recording the highest CAGR over 2025-2032. Their excellent performance concerning switching efficiency, on-resistance, and thermal stability renders much of this dominance in automotive, consumer electronics, and industrial power systems. Enhancement mode, since it can be turned on or off by using a positive voltage, and therefore, it can take better control over the power flow. They can be used in many applications, from electric vehicles to line and load power inverters to portable electronics, where high-speed switching and reliability features are critical, which, combined with an increasing need for these applications, is driving the growth of this market.
By Power Rate
The high-power segment accounted for 40.8% of the global power MOSFET market in 2024. High-power semiconductors continue to drive this dominance due to the growing need for high-performance, energy-efficient devices in applications including electric vehicles (EVs), renewables, industrial equipment, and power electronics. High-power MOSFETs provide benefits, such as high efficiency, switching capability, and thermal management, and they are ideal for high-voltage, high-current situations where quality is a must.
The medium-power segment is projected to observe a rapid CAGR over 2025-2032. The power management systems also find their adoption in consumer electronics, telecom, and industrial automation, among others, which further drives the market growth. These are essential for certain applications where high compactness, low cost, and high switching speed are the main benefits of medium-power MOSFETs. This segment is expected to grow rapidly with the increasing adoption of IoT devices, smart grids, and the increasing roll-out of 5G infrastructure.
By Application
The automotive sector led the power MOSFET market, with a 27.2% share. This dominance is mainly driven by the increasing number of electric vehicles (EVs) and hybrid electric vehicles (HEVs), where electric power conversion systems are needed. Power MOSFETs are key players for Improved Performance & Efficiency in Managing Power from the battery to motor and powertrain components in EVs. This market share is also complemented by automotive applications, including advanced driver-assistance systems (ADAS) and onboard charging systems.
Consumer electronics are projected to offer the fastest CAGR growth over 2025-2032. Such growth is fueled by the increasing needs for mobile, low-power, portable devices, including mobile phones, laptops, tablets, and wearables. These devices require power MOSFETs for power management that deliver high efficiency, small size, and fast switching. This growth is further fueled by the rising trend of IoT devices and 5G technology to better power-efficient electronic devices.
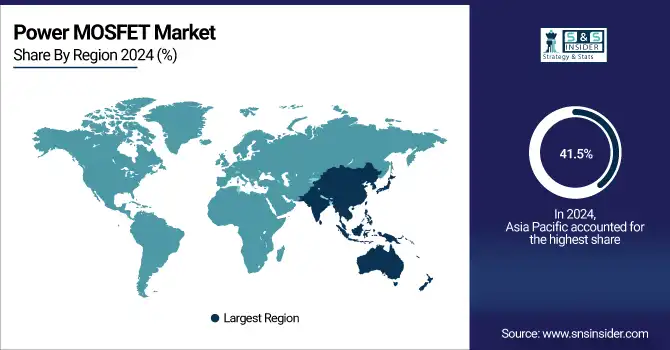
Power MOSFET Market Regional Outlook:
In 2024, Asia Pacific held a market share of 41.5% and is projected to exhibit the highest CAGR during 2025-2032. The reason for this growth is the fast-paced industrialization and technological evolution of countries including China, Japan, and South Korea, where a huge chunk of the semiconductor and automotive industries exists. High demand for electric vehicles, wind, and storage from this region is likely to boost the market growth. In addition, Asia Pacific is the heart of developing and adopting advanced technologies such as 5G, IoT, and smart grid, all of which are supported by efficient power management solutions including power MOSFET. This is supported by the country's favorable government policies and investment scope semiconductor and electronics sectors.
Get Customized Report as per Your Business Requirement - Enquiry Now
China is the leading power MOSFET market in Asia Pacific owing to the presence of a manufacturing base. Power MOSFET demand in automotive, consumer electronics, and industrial applications is fueled by the country being a global leader in semiconductor production.
North America is expected to be a steadily increasing region for the growth of the power MOSFET market due to high demand for energy-efficient solutions across the automotive, industrial, and consumer electronics sectors. This has been driven in large part by the energy transition toward electric vehicles (EVs) and the growing deployment of renewable energy systems. The progress being made in semiconductor technologies, such as silicon carbide (SiC) and gallium nitride (GaN), is once again enabling better power management. Digital transformation and industrial automation in the region constantly propel the power MOSFETs with the impetus to operate.
North America power MOSFET market is driven by the United States leading the region, and gaining position across globally in technology innovations in electric vehicle manufacturing, renewable energy generation, and electronics & semiconductor manufacturing. The need for cutting-edge power management devices is due to their solid infrastructure and R&D investments.
In Europe, the regulatory push for energy efficiency and sustainability is driving the growth of the power MOSFET market. Growing adoption of electric vehicles and renewable energy initiatives, along with industrial automation, is profoundly driving the market growth. In addition, improvements in power semiconductor technology types and the increasing requirement of smart grid and 5G infrastructure boost the power MOSFET industry. Additionally, the focus of the region to reduce carbon emissions and promote clean energy are also driving high growth of high-performance energy-efficient power devices.
The European market was dominated by Germany due to the country's leadership in the automotive and industrial sectors. This drives high demand for energy-efficient power solutions, backed by the country-specific strong focus on electric vehicle production, renewable energy integration, and overall advanced manufacturing capabilities.
The power MOSFET market in Latin America and the Middle East & Africa (MEA) is gradually gaining momentum due to higher industrial automation investments, renewable energy business investments, and infrastructure development. They also support the high-efficiency power management systems, as rising energy demand and the trend for electrification drive the adoption of these technologies. The build-out of telecommunications networks, particularly with 4G and 5G implementations, also enables more compact and high-efficiency elements such as Power MOSFETs.
Key Players Listed in the Power MOSFET Market are:
Some of the major power MOSFETs companies are Infineon Technologies, ON Semiconductor, STMicroelectronics, Toshiba, Vishay, Renesas, ROHM, Nexperia, Alpha and Omega Semiconductor, and Diodes Incorporated.
Recent Developments:
-
In March 2024, Infineon launched the OptiMOS™ 7 80 V MOSFET with industry-lowest on-resistance of 1.3 mΩ, optimized for high-efficiency automotive applications. The new device supports compact design, meets AEC-Q101 standards, and is ideal for 48 V systems like EPS and battery switches.
-
In March 2025, Vishay launched its Gen 4.5 650V E Series power MOSFET with significantly reduced on-resistance and gate charge for improved power conversion efficiency.
| Report Attributes | Details |
|---|---|
| Market Size in 2024 | USD 27.53 Billion |
| Market Size by 2032 | USD 48.40 Billion |
| CAGR | CAGR of 7.34% From 2025 to 2032 |
| Base Year | 2024 |
| Forecast Period | 2025-2032 |
| Historical Data | 2021-2023 |
| Report Scope & Coverage | Market Size, Segments Analysis, Competitive Landscape, Regional Analysis, DROC & SWOT Analysis, Forecast Outlook |
| Key Segments | • By Type (Depletion Mode, and Enhancement Mode) • By Power Rate (High power, Medium power, and Low power) • By Application (Energy & Power, Inverter & UPS, Consumer Electronics, Automotive, Industrial, and Others) |
| Regional Analysis/Coverage | North America (US, Canada, Mexico), Europe (Germany, France, UK, Italy, Spain, Poland, Turkey, Rest of Europe), Asia Pacific (China, India, Japan, South Korea, Singapore, Australia, Taiwan, Rest of Asia Pacific), Middle East & Africa (UAE, Saudi Arabia, Qatar, South Africa, Rest of Middle East & Africa), Latin America (Brazil, Argentina, Rest of Latin America) |
| Company Profiles | Infineon Technologies, ON Semiconductor, STMicroelectronics, Toshiba, Vishay, Renesas, ROHM, Nexperia, Alpha and Omega Semiconductor, and Diodes Incorporated. |
Frequently Asked Questions
Ans: Asia Pacific dominated the Power MOSFET Market in 2024.
Ans: The Enhancement Mode segment dominated the Power MOSFET Market in 2024.
Ans: The major growth factor of the Power MOSFET market is the increasing demand for energy-efficient power conversion systems driven by the rapid adoption of electric vehicles, industrial automation, and renewable energy solutions.
Ans: The Power MOSFET Market size was USD 27.53 billion in 2024 and is expected to reach USD 48.40 billion by 2032.
Ans: The Power MOSFET Market is expected to grow at a CAGR of 7.34% from 2025-2032.
Get in Touch
