Anti-Money Laundering Solution Market Report Scope & Overview:
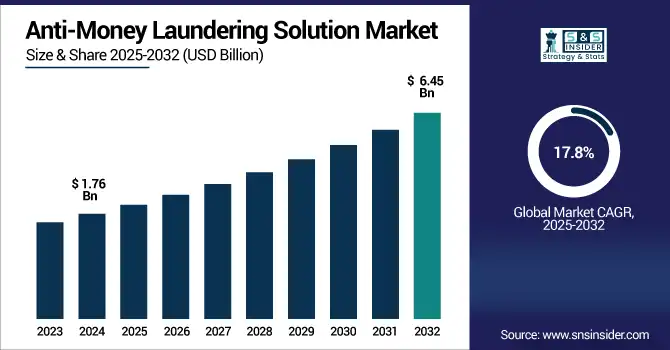
The Anti-Money Laundering Solution Market Size was valued at USD 2.07 billion in 2025 and is expected to reach USD 7.74 billion by 2033 and grow at a CAGR of 17.88% over the forecast period of 2026-2033.
The market is growing due to increasing financial crimes, stringent regulatory and compliance requirements, and soaring global digital transactions. AML solutions allow financial institutions to detect suspicious activity, remain compliant, and mitigate the threat of financial crimes. These solutions are equipped with cutting-edge technologies, including AI, machine learning, and data analytics to supplement transaction monitoring, customer due diligence, and reporting capabilities. Under this growing pressure from global regulators and the increasing requirement for real-time risk management, developing sophisticated AML technology platforms becomes a priority investment for these firms. The market is very dynamically developing, supported by a larger share of cloud, automation, and market demand across banking, fintech, and insurance.
According to research, an AI Compliance Agent enabled a large multinational bank to deploy AI models in six weeks, reducing alert volumes by 45%-65% but still producing over 99% of the number of SARs historically produced. These developments demonstrate how AI-powered AML tools help automate monitoring, reduce false positives by orders of magnitude, and dial up overall regulatory compliance for financial institutions.
Anti-Money Laundering Solution Market Size and Forecast:
-
Market Size in 2025: USD 2.07 Billion
-
Market Size by 2033: USD 7.74 Billion
-
CAGR: 17.88% from 2026 to 2033
-
Base Year: 2025
-
Forecast Period: 2026–2033
-
Historical Data: 2022–2024
To Get more information on Anti-Money Laundering Solution Market - Request Free Sample Report
Anti-Money Laundering Solution Market Trends:
-
Increasing regulatory scrutiny and stricter global AML compliance mandates
-
Rapid adoption of AI- and machine learning-powered transaction monitoring systems
-
Growing deployment of cloud-based AML platforms for scalability and real-time risk detection
-
Rising demand for automated suspicious activity reporting and false-positive reduction tools
-
Expanding AML adoption across banking, fintech, insurance, and digital payment ecosystems
-
Integration of blockchain and advanced analytics for enhanced transparency and fraud prevention
The U.S. Anti-Money Laundering Solution Market size is projected to grow from USD 0.87 Billion in 2025 to reach USD 3.28 Billion by 2033, growing at a CAGR of 17.45% from 2026 to 2033.
Growth is driven by stringent regulatory compliance requirements, increasing financial fraud and cybercrime incidents, rising adoption of AI- and machine learning-powered transaction monitoring systems, and continuous investments by banks and fintech companies to strengthen risk management and real-time fraud detection capabilities.
Anti-Money Laundering Solution Market Drivers:
-
Intensified Regulatory Enforcement and AML Compliance Mandates Drive Market Growth
Stricter regulatory compliance has emerged as the primary factor driving growth for AML solutions in the U.S. As their financial crimes grow even more sophisticated, government agencies and regulatory bodies have taken a zero-tolerance approach toward failure to comply. In turn, this has produced a more-or-less self-perpetuating cycle where banks and similar institutions are forced to invest in sophisticated compliance infrastructure both to comply with the rules and also to protect their reputations. The need to increase the stringency of audit procedures and the imposition of greater financial penalties have also put the heat on firms to improve the quality of their monitoring defenses, identify suspicious transactions, and record a full audit trail. This, in turn, has driven the rise of AI-enabled platforms and integrated AML suites, which can adapt to constantly evolving threat structures and compliance landscapes.
Moreover, establishing a real-time peer-to-peer network of trust operators has raised AML compliance to a strategically critical level within financial institutions nationwide and raised demand for mission-critical, scalable solutions.
Anti-Money Laundering Solution Market Restraints:
-
High Implementation Costs and System Integration Complexities Limit AML Adoption Among Mid-Sized and Smaller U.S. Financial Institutions
Despite growing awareness and regulatory need, the adoption of anti-money laundering (AML) solutions is significantly restrained by high implementation costs and integration challenges. Implementing a full-scale AML program can be significantly burdensome to mid-sized banks, affiliates, credit unions, and smaller fintechs, including significant investment in hardware, licensing, and training. These companies also have to overcome the challenge of fitting new tech into their current IT environment, which is often dated or piecemeal. Interfacing AML tools with core banking systems, customer databases, and external data sources can complicate matters and point to long installation times and increased operational risk.
In addition, ongoing upkeep costs, such as model tuning, regulatory updates, and staff training contribute to the financial burden. This results in many organizations delaying deployment or opting for less functionality with substandard compliance coverage. Conversely, their exposure to fines is and remains great. This lack of balance between cost and value creates a barrier for suppliers wanting to exploit more price-conscious parts of the marketplace. As a result, larger players have no problem rolling out state-of-the-art AML solutions, and the smaller players are open to exploitation on a scale that is not conducive to the market as a whole being able to grow and scale long term.
Anti-Money Laundering Solution Market Opportunities:
-
Growing Adoption of Blockchain-Based AML Infrastructure Offers Scalable Transparency and New Growth Avenues for Tech-Forward AML Vendor
The growing trend of blockchain technology-based compliance is a significant opportunity for the growth perspective of the U.S. Anti-Money Laundering Solution Market. Now, as organizations continue to demand real-time transparency, tamper-resistant databases, and secure methods of sharing information, AML and KYC systems are turning to blockchain in order to enhance their capabilities. That decreases dependence on information stored in siloed databases while allowing for smarter, faster investigations. For Anti Money Laundering vendors (AML), the use of blockchain will serve as an edge and gateway to the crypto, digital payments, and cross-border finance clients.
Also, blockchain, by automating data validation and sharing among organized players, helps to reduce the cost of compliance. Institutions that adopt these innovations are not only better prepared for audits but also positioned as industry leaders in regulatory innovation. This technological evolution significantly expands the market's scope, encouraging partnerships between fintechs, regtech firms, and traditional AML solution providers to address the future of compliance more efficiently.
Anti-Money Laundering Solution Market Challenges:
-
Balancing AI-Powered AML Monitoring with Analyst Workload Remains a Core Challenge for Sustainable Solution Deployment
While artificial intelligence (AI) has revolutionized transaction monitoring and threat detection in AML systems, its rapid integration poses a serious challenge for balancing automation with human workload. Financial institutions deploying AI often encounter excessive false positives, overwhelming compliance analysts with alerts that lack contextual accuracy. As models evolve, so does the need for continuous training, testing, and recalibration, an effort-intensive process. Without proper calibration, AI tools can trigger unnecessary investigations, create alert fatigue, and increase the risk of genuine suspicious activities being overlooked.
Furthermore, frontline analysts must now possess both compliance knowledge and technical skills to interpret AI-driven insights, raising training demands. This dual burden can stretch operational teams thin, particularly in institutions with limited resources. If not addressed, these challenges can lead to poor adoption rates, reduced user confidence in the system, and inefficiencies in compliance workflows. Therefore, organizations must carefully design AML systems that complement human judgment rather than replace it, ensuring a functional balance between automation accuracy and manageable analyst workloads. This integration issue remains a key hurdle in realizing the full potential of next-generation AML solutions.
Anti-Money Laundering Solution Market Segmentation Analysis:
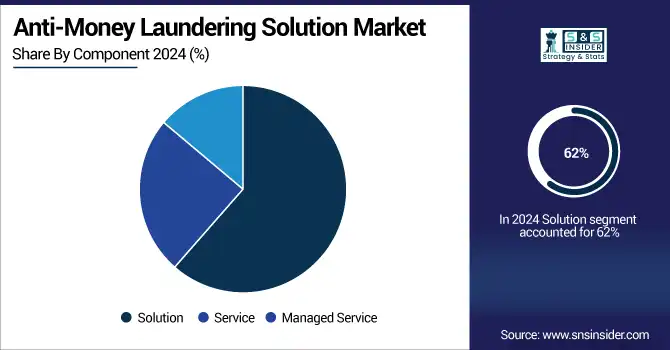
By Component
The Solution segment leads the Anti-Money Laundering Solution Market Growth with a 62% revenue share in 2025, driven by robust demand for AI-powered monitoring platforms and real-time analytics. BAE Systems' NetReveal upgrade improved investigation accuracy, boosting solution adoption. These developments address rising compliance demands, making integrated AML solutions the preferred choice for large institutions, thus driving the segment’s continued dominance in the overall AML solution landscape.
The Service segment is growing rapidly due to increasing reliance on consulting, integration, and post-deployment support. With a CAGR of 19.81%, providers, such as WorkFusion and LexisNexis have expanded service portfolios to include managed analytics and risk advisory services. CaseWare launched end-to-end compliance support offerings in 2025, improving service-driven AML efficiency. As financial institutions navigate complex global regulations, demand for expert-led AML implementation and support services has surged, positioning this segment for accelerated long-term growth across multiple business tiers.
By Deployment Type
Cloud deployment dominates with a 67% share in 2025, fueled by scalability, cost-efficiency, and remote accessibility. FIS Global introduced a cloud-native AML module integrating AI, while Oracle launched real-time compliance engines with a cloud-first architecture. Cloud models support dynamic regulation updates and instant risk scoring, making them vital for agile compliance. As institutions migrate from legacy infrastructure, cloud-based AML systems become critical for modern governance, helping vendors scale offerings while meeting regulatory expectations across increasingly digitalized banking environments.
On-premises AML solutions segment is witnessing 21.04% CAGR growth, driven by demand from institutions with sensitive data and strict internal control requirements. BAE Systems and Fiserv have introduced customizable and high-security AML software tailored for on-prem environments. Government and large private banks often prefer on-prem setups for complete control over data flow and audit logs. This segment benefits from growing cybersecurity concerns, leading institutions to invest in internalized AML frameworks, especially in sectors prioritizing regulatory independence and infrastructure sovereignty.
By Technology Type
The Automotive sector dominated in 2025, and is also experiencing 19.99% CAGR growth in AML solution adoption as fraud in automotive financing and cross-border supply chains intensifies. Recent advancements by Experian in fraud prevention tools have been integrated into AML systems tailored for auto lenders. With vehicle financing prone to identity fraud and illicit trade links, AML platforms now monitor high-risk patterns across dealerships and insurers. These tools help automotive firms maintain compliance with tightened AML directives in finance-related automotive operations.
By Organization Size
Large enterprises held a 65% share in 2025, owing to their vast transaction volumes and global compliance obligations. Companies including FICO and SAS have deployed enterprise-grade AML platforms featuring real-time monitoring, multilingual support, and AI-based case management. These solutions align with complex regulatory frameworks and cross-border operations typical of large institutions. Investment in robust compliance infrastructure ensures operational resilience, making large enterprises key contributors to overall market revenue in the rapidly evolving AML solution landscape.
SMEs are growing at a CAGR of 19.78%, driven by expanding access to cost-effective and modular AML tools. Due to lower entry barriers and simplified deployment for smaller firms. As SMEs increasingly face regulatory oversight, particularly in fintech and crypto sectors, they are investing in lightweight, scalable compliance tools, fueling rapid AML adoption within this agile and underserved market segment.
Anti-Money Laundering Solution Market Regional Analysis:
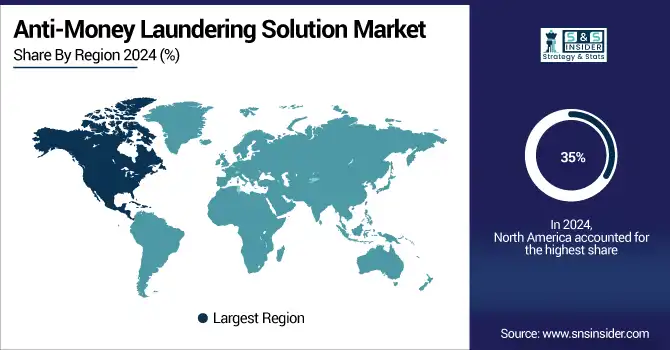
North America Anti-Money Laundering Solution Market Insights:
North America is the dominant region in the Anti-Money Laundering Solution Market share of around 35% in 2025, driven by stringent compliance mandates, advanced financial ecosystems, and high adoption of digital banking. The region’s proactive regulatory enforcement and focus on financial transparency accelerate AML technology deployment across institutions. The U.S. dominates in North America, supported by its robust banking infrastructure, active fintech sector, and continued investments in AI-driven compliance systems. The country’s leadership in regulatory innovation and financial crime detection positions it as the key regional contributor.
Asia Pacific Anti-Money Laundering Solution Market Insights:
In 2025, Asia Pacific is the fastest-growing region in the Anti-Money Laundering Solution Market with a CAGR of around 21.9% during the forecast period of 2026–2033, fueled by rapid digitization, rising fintech adoption, and government-led financial reforms. Growing transaction volumes and increasing cross-border payment activity have created urgency for automated AML tools. China is the fastest-growing country in the Asia Pacific region, driven by its expanding banking landscape and strong regulatory enforcement in digital finance. Large-scale fintech development, e-commerce growth, and national data compliance efforts support China's increasing reliance on advanced AML platforms.
Europe Anti-Money Laundering Solution Market Insights:
Europe was a significant regional contributor to the Anti-Money Laundering Solution Market in 2025. Strong compliance integration under EU AML directives and high-risk awareness among financial institutions drive technology investments. Germany remains the dominant country in Europe, led by its global financial institutions and a strong focus on corporate governance. The rise of digital banking and stricter oversight from BaFin have fueled increased adoption of AML solutions across German banks. Germany’s push toward transaction transparency and digital compliance frameworks continues to support Europe’s steady market expansion.
Middle East & Africa and Latin America Anti-Money Laundering Solution Market Insights:
In 2025, the Middle East & Africa and Latin America regions are emerging markets in the Anti-Money Laundering Solution industry, showing moderate yet promising growth. In MEA, countries, such as the UAE and Saudi Arabia are investing in AML platforms due to rising cross-border capital flows and efforts to align with international compliance standards. Digital banking growth and economic diversification in these nations are supporting broader AML adoption. In Latin America, Brazil leads the market due to its tightening anti-corruption regulations and modernizing financial system. Fintech proliferation and increasing AML awareness across banking institutions are setting the stage for long-term regional growth.
Get Customized Report as per Your Business Requirement - Enquiry Now
Key Players:
-
NICE Actimize
-
FIS (Fidelity National Information Services)
-
SAS Institute Inc.
-
Oracle Corporation
-
BAE Systems plc
-
LexisNexis Risk Solutions
-
Thomson Reuters Corporation
-
FICO (Fair Isaac Corporation)
-
ACI Worldwide, Inc.
-
Experian plc
-
Refinitiv (LSEG)
-
Tata Consultancy Services (TCS)
-
Infosys Limited
-
Eastnets
-
ComplyAdvantage
-
Feedzai
-
Temenos AG
-
Fenergo
Recent Developments:
-
May 2025 – Brazilian bank Bradesco deployed the FICO Platform (SAFER) to enhance its real-time fraud and compliance systems, processing nearly 1 billion PIX transactions monthly. The platform integrates KYC, AML, and real-time monitoring to reduce fraud and false positives significantly, streamlining compliance processes.
-
April 2025 – NICE Actimize was named a Leader in the Forrester Wave: Anti‑Money Laundering Solutions Q2 2025. It earned the highest possible scores across all 10 evaluated criteria, covering AI/ML-based risk scoring, data integration, watchlist screening, case management, and more, cementing its position in the AML solutions landscape.
| Report Attributes | Details |
|---|---|
| Market Size in 2025 | USD 2.07 Billion |
| Market Size by 2033 | USD 7.74 Billion |
| CAGR | CAGR of 17.88% From 2026 to 2033 |
| Base Year | 2025 |
| Forecast Period | 2026-2033 |
| Historical Data | 2022-2024 |
| Report Scope & Coverage | Market Size, Segments Analysis, Competitive Landscape, Regional Analysis, DROC & SWOT Analysis, Forecast Outlook |
| Key Segments | • By Component (Solution, Service, Managed Service) • By Technology Type (Know Your Customer (KYC) Systems, Transaction Monitoring, Case Management, Compliance Management, Auditing and Reporting) • By Deployment Type (On-Premises, Cloud) • By Organization Size (Small & Medium Enterprises (SMEs), Large Enterprises) |
| Regional Analysis/Coverage | North America (US, Canada, Mexico), Europe (Germany, France, UK, Italy, Spain, Poland, Turkey, Rest of Europe), Asia Pacific (China, India, Japan, South Korea, Singapore, Australia, Taiwan, Rest of Asia Pacific), Middle East & Africa (UAE, Saudi Arabia, Qatar, South Africa, Rest of Middle East & Africa), Latin America (Brazil, Argentina, Rest of Latin America) |
| Company Profiles | NICE Actimize, Fiserv, Inc., FIS (Fidelity National Information Services), SAS Institute Inc., Oracle Corporation, BAE Systems plc, LexisNexis Risk Solutions, Thomson Reuters Corporation, FICO (Fair Isaac Corporation), ACI Worldwide, Inc., Experian plc, Refinitiv (LSEG), Tata Consultancy Services (TCS), Infosys Limited, Accenture plc, Eastnets, ComplyAdvantage, Feedzai, Temenos AG, Fenergo, and Others |
Get in Touch
