Zero-touch Provisioning Market Report Scope & Overview:
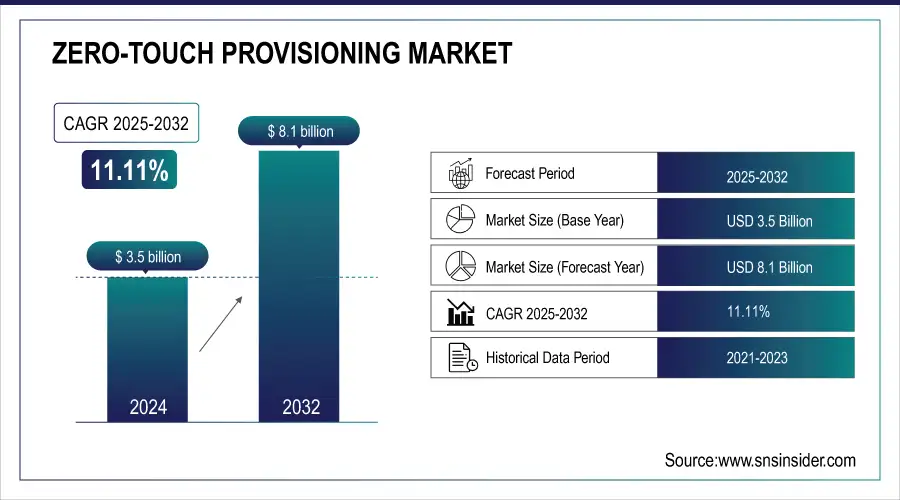
The Zero-touch Provisioning Market size was valued at USD 3.5 billion in 2024 and is expected to reach USD 8.1 billion by 2032, growing at a CAGR of 11.11% during 2025-2032.
Zero-touch provisioning market growth is attributed to the need for automated network deployment, which creates a demand push towards digital transformation, cloud, and IoT, and in turn increases the demand for Zero-touch provisioning market. The increasing interest of the enterprises for a more automated approach, which will involve much less manual configuration, allows for much lower operational expenditures, and efficient and faster device onboarding and control.
Telecom and IT sectors account for the largest share as per the zero-touch provisioning market analysis, as they require seamless provision for large-scale and complex networks. The primary ingredients that are fueling growth are the transition to SDN/ NFV, interoperability between multiple vendor devices, and increased need for network security. zero-touch provisioning market trends feature growing adoption of AI and intent-based networking. Enterprise digitalization and the global rollout of 5G are anticipated to drive strong CAGR during the market through 2032.
To Get more information on Zero-touch Provisioning Market - Request Free Sample Report
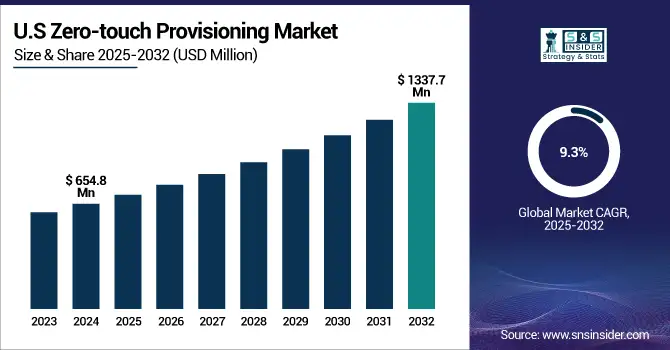
The U.S. Zero-Touch Provisioning (ZTP) Market was valued at USD 654.8 Million in 2022 and is projected to reach USD 1,337.7 Million by 2030, growing at a CAGR of 9.3% over 2023-2032. The growth mainly driven by increased cloud services adoption and 5G infrastructure rollout that requires automated, quick Network provisioning.
In 2023, the EX4000 Series enables rapid deployment, with the capability to install and configure up to 4,000 access points in a single day, significantly accelerating network rollouts.
Zero-touch Provisioning Market Dynamics:
Driver:
-
Increased Network Scale and Device Diversity Lead Organizations to Adopt ZTP to Streamline Provisioning and Reduce Manual Errors
Fully automated provisioning solutions are needed to sustain the fast growth of enterprise networks, cloud infrastructure, and 5G services. Zero-Touch Provisioning is being used by organizations for faster device onboarding, lowering configuration errors, and for lower operational expenditures. Especially in multi-vendor environments, manual processes are time-consuming and prone to errors. This makes ZTP a key ingredient of the networks of the future by integrating and scaling the networks without a huge impact on the workload on the network administrators. ZTP automation is emerging as a key enterprise digital transformation strategy in service providers, data centers, and enterprise networks as businesses need to capitalize on agility, efficiency, and uptime.
For instance, the number of connected Internet of Things devices worldwide was 18.8 billion in 2024, marking a 13% increase from 2023.
Restraints:
-
Automated Provisioning Without Oversight Raises Risks of Misconfigurations and Vulnerabilities, Limiting Enterprise Confidence in Full-Scale Deployment
While beneficial, security, and misconfiguration are concerns with ZTP. Since devices are provisioned with no manual intervention, if there is a vulnerability in the automation scripts or platform, the networks can be vulnerable to an attack. Most of the provisioning is done behind the curtains with limited visibility to detect anomalies or malicious configurations. While ZTP is the perfect solution to scale networks in and out, enterprises may shy away from full-scale ZTP adoption out of fear of unregulated deployments or out-of-sync security policies. Such is especially true for those industries with high compliance standards, think of finance or healthcare firms, where one small misconfiguration issue can have a large regulatory or operational impact.
A 2023 report revealed that 74% of organizations faced major security incidents from misconfigurations, with nearly 50% of cloud breaches caused by preventable errors like default settings or excessive permissions.
Opportunities:
-
Integration of AI and Intent-Based Networking Opens New Potential for Intelligent, Adaptive ZTP Systems that Align with Business Goals
Big Opportunity For ZTP as the application of AI can augment ZTP platforms with predictive provisioning, anomaly detection, and automated decision-making to allow even lower levels of human oversight. Zero touch provisioning (ZTP) can be used to align our network configurations with high-level business goals using Intent-Based Networking, thereby improving network operational efficiency and agility. Intelligent networks will be self-optimizing, and ZTP solutions with integrated AI and IBN will lead the pack by far. This evolution creates an opportunity for vendors to provide more intelligent, intuitive provisioning platforms for next-gen enterprise and carrier-grade networks.
For instance, Juniper Networks’ AI-native EX4000 switches with Mist AI cut operational expenses by 85%, reduce network trouble tickets by 90%, and onsite truck rolls by 85%, highlighting major efficiency gains from AI-powered ZTP.
Challenges:
-
Lack of Standard Protocols and Device Compatibility Create Integration Hurdles in Heterogeneous Network Environments
Interoperability between multi-vendor environments is one of the central challenges that the ZTP market is facing. Most enterprises run heterogeneous networks, where different devices from different vendors run on multiple provisioning protocols and formats. This deep inconsistency makes it difficult to do automation and impairs ZTP deployments at scale. Alternatively, vendors could provide proprietary solutions, meaning they are less interoperable and harder to integrate. This limited the ability of organizations to implement full-throttle ZTP as there are no universal standards, and current platforms are not vendor-agnostic. Solving this conundrum is going to take concerted ingenuity, standardization, and attention to platform-agnostic supply to unleash all that ZTP could be in the right ecosystems within your enterprise.
Zero-touch Provisioning Market Segmentation Analysis:
By Component
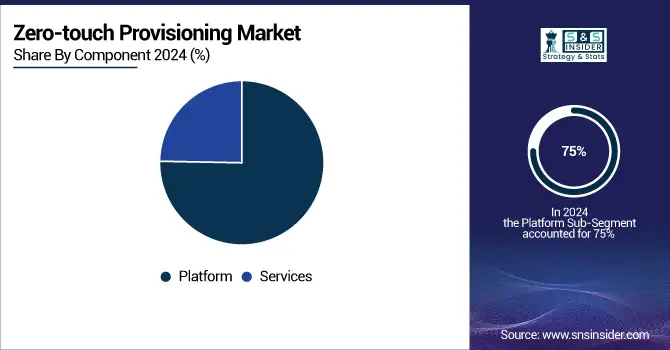
The platform segment dominated the market and accounted for 75% of the zero-touch provisioning market share in 2024, owing to its centralized nature, its scalability, and multi-vendor compatibility. As enterprises expect AI-based automation-driven provisioning across more complex and dynamic infrastructures, this segment will maintain its leadership through 2032 with increased adoption of AI, SDN, and intent-based networking.
The services segment is expected to register the fastest CAGR during the forecast period, driven by increasing complexity in network deployments, paired with a need for experience-based support. Consulting, integration, and maintenance services for hybrid, multi-cloud, and security-sensitive enterprise environments would drive this segment to grow most rapidly over 2025-2032.
For instance, In December 2023, Anuta Networks launched ATOM AVA, an AI assistant for its ATOM platform that streamlines onboarding, reduces errors, and boosts productivity for network operators through proactive issue detection and simplified troubleshooting.
By Device Type
Switches segment dominated the zero-touch provisioning market and accounted for a significant revenue share in 2024, since they are key elements in backbone and data center networks that typically interconnect a high number of multi-vendor devices in a single environment. With increasing demands around scalability and security, key motivations driving enterprises toward switch automation will continue to be focused on speed of deployment, centralized management, and intent-based, automated, and integrated provisioning over 2025-2032.
The IoT devices segment is expected to register the fastest CAGR during 2025-2032, due to smart infrastructure and edge deployments. The increase in connected devices will trigger the growth of automated provisioning, which will bring optimal onboarding, real-time updates, and security management across multiple areas, such as healthcare devices, manufacturing devices, smart city, and smart home.
By Network Complexity
The complex network architecture segment led the zero-touch provisioning market and held the largest share in 2024 due to increasing enterprise demand for complex network infrastructure, including data center, cloud, and remote site infrastructure. The demand that ZTP ignites for scalable, policy-driven provisioning in hybrid IT environments will maintain momentum through 2025 to 2032, as this capability drives the need to reduce configuration errors and automatically deploy services across the layered networks it creates.
The dynamic network environment segment is expected to register the fastest CAGR during the forecast period as companies adopt agile, cloud-native, and mobile-first architectures. ZTP adoption will also take off during 2025-2032, as configuration changes become more frequent, adaptive security needs dictate the requirement, and real-time provisioning becomes critical for operational agility, uptime, and compliance policy adherence to rapidly changing digital ecosystems.
By Enterprise Size
The large enterprise segment dominated the zero-touch provisioning market and represented 69% of revenue share as they have complex IT infrastructures, with a large number of devices and a need for centralized, automated provisioning. Adoption will continue through this period, as these organizations look to leverage AI for network automation to drive down operational costs, improve scalability, and increase security for their global operations running on a network.
SMEs is expected to register the fastest CAGR during the forecast period 2025-2032, As SMEs are increasingly turning toward scalable networking solutions on the cloud. the expected adoption of simplified ZTP platforms, managed services, and an increase in the seriousness of cybersecurity, which will permit SMEs to leverage automation of provisioning using ZTP without the overhead of substantial in-house IT man-power/knowledge.
By Industry
The IT & Telecom segment dominated the zero-touch provisioning market and represented a significant revenue share in 2024, driven by massive volumes of devices, the demand for rapid provisioning, and dependence on extremely complex, multi-vendor networks. Growth will be sustained over 2025-2032 as continuous 5G rollouts, network function virtualization, and AI-based automation enable CSPs to constantly seek efficiency, scalability, and cost-effective low-latency provisioning.
The healthcare segment is expected to register the fastest CAGR during the forecast period, propelled by the speedup of digitalization in hospitals and care services. Adoption of connected medical devices and remote monitoring, combined with stringent data security demands, will drive ZTP adoption during 2025-2032, enabling ZTP to automate and comply with network provisioning to mission-critical healthcare environments.
Zero-touch Provisioning Market Regional Outlook:
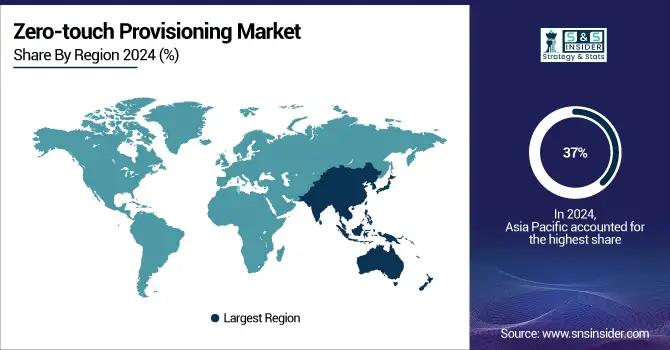
Asia Pacific dominated the zero-touch provisioning market and accounted for 37% of revenue share in 2024, due to the high rate of digitalization along with the growth of the telecom services. Sustained investment in automated provisioning solutions across the region will result from smart city projects led by governments and large-scale 5G rollouts, injecting USD 16 billion during 2025-2032.
Get Customized Report as per Your Business Requirement - Enquiry Now
In the Asia-Pacific region, China dominated the zero-touch provisioning market due to the Aggressive 5G infrastructure expansion and government-backed digital transformation initiatives. Fully automated provisioning technologies are planned to increase nationwide demand over 2025-2032, driven by the adoption of edge computing, AI-integrated networking, and industrial IoT.
North America is expected to register the fastest CAGR during the forecast period due to a high enterprise demand for AI-based network automation, rising cybersecurity needs, and a mature cloud environment. U.S. enterprises will pioneer adoption from 2025 to 2032 as they renew legacy systems and expand intelligent provisioning across hybrid IT environments.
Europe is the second-largest region in the zero-touch provisioning (ZTP) market due to the high adoption of SDN, NFV, and cloud over the years. The deployment of ZTP in every industry vertical will be fueled by increasing regulatory focus on data security and rapid enterprise digitalization over 2025-2032.
The European ZTP market is led by Germany, which is supported by the country developing itself as one of the advanced manufacturing sectors in the region, growing industrial automation, and a strict security focus in IT infrastructure.
Key Players:
The major zero-touch provisioning market companies are Cisco, Juniper Networks, Hewlett-Packard Enterprise (HPE), Nokia, Ericsson, IBM, Dell Technologies, Extreme Networks, Arista Networks, VMware, and others.
Recent Developments:
-
In December 2024, Juniper Networks highlighted its advancements in AI-Native Networking, emphasizing the integration of Mist AI™ and the Marvis Virtual Network Assistant to simplify network management. These tools provide proactive recommendations and support self-driving actions using natural language processing, aiming to reduce operational costs and improve user experiences.
-
In February 2024, HPE emphasized the role of Zero-Touch Provisioning in its GreenLake platform to empower private cloud at the edge. This capability simplifies the deployment and management of IT resources by automating the configuration and provisioning process, reducing the need for manual intervention and enabling rapid scaling across distributed enterprise environments.
|
Report Attributes |
Details |
|---|---|
|
Market Size in 2024 |
US$ 3.5 Billion |
|
Market Size by 2032 |
US$ 8.1 Billion |
|
CAGR |
CAGR of 11.11 % From 2025 to 2032 |
|
Base Year |
2024 |
|
Forecast Period |
2025-2032 |
|
Historical Data |
2021-2023 |
|
Report Scope & Coverage |
Market Size, Segments Analysis, Competitive Landscape, Regional Analysis, DROC & SWOT Analysis, Forecast Outlook |
|
Key Segments |
• By Component (Platform, Services) |
|
Regional Analysis/Coverage |
North America (US, Canada, Mexico), Europe (Germany, France, UK, Italy, Spain, Poland, Turkey, Rest of Europe), Asia Pacific (China, India, Japan, South Korea, Singapore, Australia, Rest of Asia Pacific), Middle East & Africa (UAE, Saudi Arabia, Qatar, South Africa, Rest of Middle East & Africa), Latin America (Brazil, Argentina, Rest of Latin America) |
|
Company Profiles |
Cisco, Juniper Networks, Hewlett Packard Enterprise (HPE), Nokia, Ericsson, IBM, Dell Technologies, Extreme Networks, Arista Networks, Vmware and others in report |
Frequently Asked Questions
Ans- Asia-Pacific region dominated the Zero-touch Provisioning Market with 37% of revenue share in 2024.
Ans- The Large Enterprises segment dominated the identity as a service market and represented 69% of revenue share in 2024.
Ans- Increased Network Scale and Device Diversity Lead Organizations to Adopt ZTP to Streamline Provisioning and Reduce Manual Errors
Ans- The Zero-touch Provisioning Market size was valued at USD 3.5 billion in 2024 and is expected to reach USD 8.1 billion by 2032
Ans- The CAGR of the Zero-touch Provisioning Market during the forecast period is 11.11% during 2025-2032.
Get in Touch
