Antiscalants Market Report Scope & Overview:
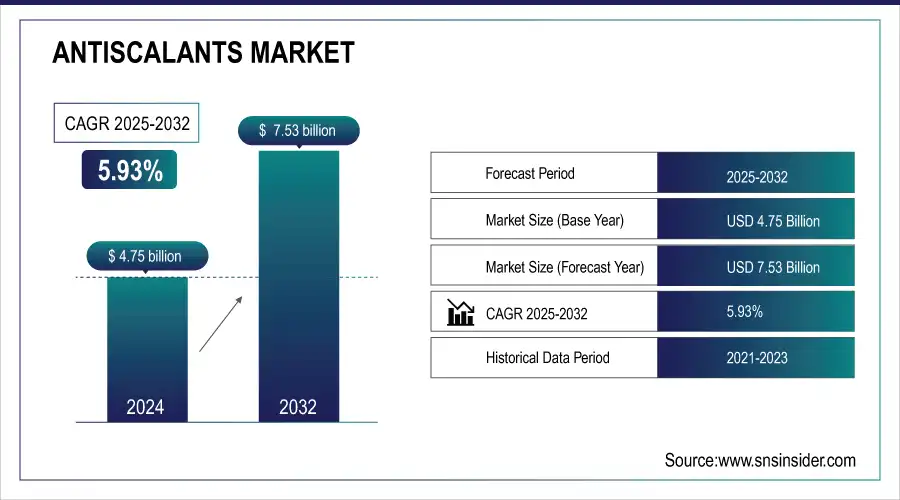
The Antiscalants Market Size was valued at USD 4.75 Billion in 2024 and is expected to reach USD 7.53 Billion by 2032, growing at a CAGR of 5.93% over the forecast period of 2025-2032.

To Get more information on Antiscalants Market - Request Free Sample Report
The Antiscalants Market is evolving with key trends shaping its future. Our report delves into the investment trends and funding in antiscalants, revealing how increased financial support is driving innovation. Technological disruptions in the water treatment industry are accelerating the development of more efficient and effective antiscalants solutions, revolutionizing water purification processes. As industries face specific challenges, the demand for customized antiscalants for specific industrial needs is growing, ensuring tailored solutions for optimal performance. The performance metrics of different antiscalants products are also explored in our report, comparing the effectiveness of various solutions across applications. These insights provide a comprehensive understanding of the market's dynamics, helping stakeholders make informed decisions in a rapidly evolving landscape.
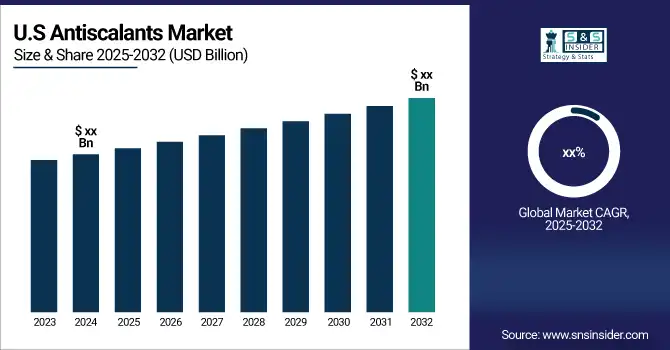
The US Antiscalants Market Size was valued at USD 0.62 Billion in 2024 and is expected to reach USD 1.13 Billion by 2032, growing at a CAGR of 6.76% over the forecast period of 2025-2032.
The U.S. Antiscalants Market is experiencing robust growth due to increasing demand for water treatment solutions, particularly in industries like oil and gas, power generation, and municipal water systems. Factors driving this growth include stringent water quality regulations and the rising need for efficient desalination and industrial water treatment processes. For instance, the U.S. Environmental Protection Agency (EPA) has enforced regulations that stimulate the adoption of advanced water treatment technologies. Companies like Dow Chemicals and Kemira are also actively innovating antiscalant formulations to meet these demands, focusing on eco-friendly solutions and improved performance, aligning with sustainability trends and regulatory pressures.
Market Size and Forecast:
-
Market Size in 2024 USD 4.75 Billion
-
Market Size by 2032 USD 7.53 Billion
-
CAGR of 5.93% From 2025 to 2032
-
Base Year 2024
-
Forecast Period 2025-2032
-
Historical Data 2021-2023
Key IoT Antiscalants Market Trends:
-
Rising industrialization and urbanization are driving adoption of advanced water treatment solutions like reverse osmosis and desalination.
-
Stringent government regulations, including EPA standards, are pushing industries to use effective antiscalants for water quality compliance.
-
Expansion of water recycling and wastewater treatment technologies increases demand for efficient scale-prevention solutions.
-
Heavy investments in desalination plants across water-scarce regions, particularly the Middle East, North Africa, and Asia, fuel market growth.
-
Manufacturers are focusing on eco-friendly, high-performance, and cost-effective antiscalant formulations tailored for sustainable water treatment operations.
IoT Antiscalants Market Growth Drivers:
-
Increasing Need for Advanced Water Treatment Solutions in Municipal and Industrial Applications Fuels Antiscalant Adoption Across Multiple Sectors
The growing demand for clean, sustainable water resources has driven the need for advanced water treatment solutions across various industries. Water scarcity, coupled with increasing industrialization, has prompted sectors such as oil & gas, power generation, and municipal water systems to adopt more sophisticated methods, including reverse osmosis and desalination. These methods rely heavily on antiscalants to prevent the formation of scales and fouling that can damage membranes and reduce system efficiency. Regulatory pressures are also a key factor in driving the market for antiscalants. The U.S. Environmental Protection Agency (EPA) and other governmental bodies worldwide enforce stringent water quality standards, promoting the use of effective chemicals in water treatment systems. Furthermore, the adoption of water recycling and wastewater treatment technologies has further amplified the need for efficient antiscalants. As industries prioritize sustainability and operational efficiency, antiscalants are becoming a vital component in maintaining the functionality of water treatment plants, ensuring a reliable, high-quality water supply for various applications.
IoT Antiscalants Market Restraints:
-
High Production Costs Associated with Eco-Friendly Antiscalants Limiting Widespread Adoption Among Small and Medium-Sized Enterprises
While eco-friendly antiscalants have gained traction due to their environmental benefits, their adoption is hindered by high production costs. The development of sustainable formulations often requires advanced raw materials, cutting-edge research, and specialized production processes, which significantly increase the cost of manufacturing. These higher production costs are passed on to end-users, making eco-friendly products more expensive than their conventional counterparts. This poses a significant challenge for small and medium-sized enterprises (SMEs), especially in developing markets, where cost sensitivity is high. For instance, in industries like mining, where profit margins are tight, the adoption of higher-cost antiscalants is less appealing, even though they offer environmental advantages. Additionally, the lack of financial resources or access to advanced technology limits the ability of these smaller players to develop and implement greener solutions. As a result, the growth of eco-friendly antiscalants is somewhat restricted, as the price disparity prevents widespread adoption in cost-sensitive markets and industries that rely on large-scale, budget-conscious operations.
IoT Antiscalants Market Opportunities:
-
Expanding Desalination Industry Presents Significant Growth Opportunities for Antiscalants in Coastal and Water-Scarce Regions
The growing demand for desalination in coastal and water-scarce regions offers a significant growth opportunity for the antiscalants market. As global freshwater resources become increasingly limited, desalination has emerged as a critical solution to ensure a reliable water supply for millions of people. Countries in regions like the Middle East, North Africa, and parts of Asia are investing heavily in desalination plants to address water scarcity challenges. Antiscalants are essential in desalination processes, as they prevent the accumulation of scale on membranes, which can reduce plant efficiency and lifespan. The rise in desalination projects presents an ideal opportunity for manufacturers to develop specialized antiscalant products tailored to the specific conditions of these plants. Companies can capitalize on this trend by offering high-performance, eco-friendly, and cost-effective solutions that ensure efficient desalination operations. As more regions adopt desalination technologies, the demand for effective antiscalants will continue to surge, creating new revenue streams for manufacturers in the market.
IoT Antiscalants Market Segment Analysis:
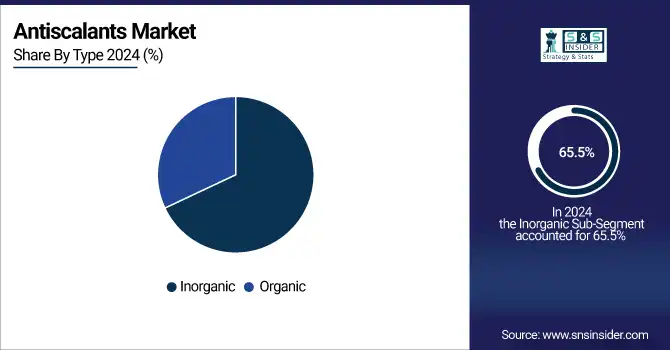
By Type
In 2024, the inorganic segment dominated the Antiscalants Market with a market share of 65.5%. The widespread adoption of inorganic antiscalants can be attributed to their proven efficacy in controlling scale formation in water treatment systems, particularly in high-demand industries such as oil and gas, mining, and power generation. Inorganic antiscalants, such as phosphonates, offer excellent performance under extreme conditions like high temperatures and pressures, making them suitable for challenging industrial applications. For instance, Dow Chemicals provides a variety of inorganic antiscalants that are widely used in desalination and industrial water treatment applications. Additionally, their cost-effectiveness compared to organic alternatives has made them the preferred choice for large-scale operations.
By Product Type
In 2024, fluorides dominated the product type segment in the Antiscalants Market, holding a market share of 28.6%. The dominance of fluorides can be attributed to their superior ability to prevent scale formation and fouling in critical applications such as desalination and reverse osmosis systems. Fluorides are known for their high performance in preventing the precipitation of salts such as calcium and magnesium, which are common culprits in scaling. Companies like Solenis have pioneered advanced fluoride-based antiscalants, ensuring that these products maintain high efficiency in water treatment processes. The growing demand for freshwater, particularly in water-scarce regions, has led to increased investments in desalination technologies, where fluoride-based antiscalants are essential.
By Application
In 2024, the oil and gas sector dominated the application segment of the Antiscalants Market with a market share of 29.5%. The oil and gas industry’s demand for antiscalants is driven by the need to maintain the efficiency of water treatment systems used in drilling, hydraulic fracturing, and water injection operations. These processes often encounter scaling challenges due to the high mineral content of water used in these operations. Antiscalants prevent the formation of scale that can clog equipment, reduce operational efficiency, and lead to costly downtime. Companies like Kemira and BASF provide specialized antiscalants tailored to the oil and gas industry, ensuring the reliability of water management systems.
IoT Antiscalants Market Regional Analysis:
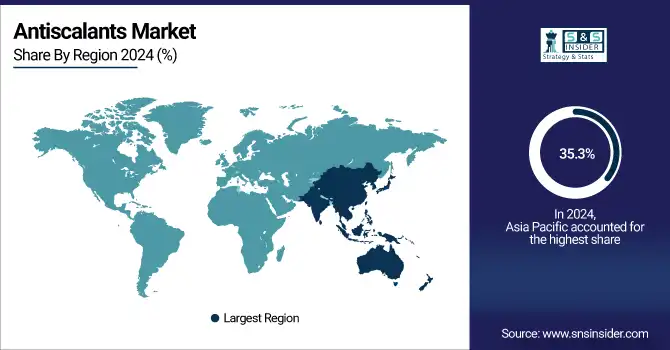
Asia Pacific IoT Antiscalants Market Insights
The Asia Pacific region dominated the Antiscalants Market in 2024, with a market share of 35.3%. The dominance of this region can be attributed to its large industrial base, rapid industrialization, and increasing demand for water treatment solutions. Countries like China, India, and Australia are major contributors to the market, with significant investments in desalination, water treatment, and mining operations. For instance, China’s extensive industrial growth and need for efficient water management have made it one of the largest consumers of antiscalants, particularly in power generation and chemical sectors. India’s rising population and industrial needs have also contributed to the increasing demand for antiscalants. In Australia, the need for desalination and water recycling technologies in arid regions further supports the growth of the antiscalants market. The increasing awareness of environmental sustainability and the growing regulatory emphasis on efficient water use are also propelling the adoption of antiscalants in the region. As industries across Asia Pacific continue to expand, the demand for effective water treatment chemicals like antiscalants is expected to grow, solidifying the region's market dominance.
North America IoT Antiscalants Market Insights
The North America region emerged to be the fastest-growing region in the Antiscalants Market during the forecast period, with a significant CAGR. The growth is primarily driven by increasing investments in advanced water treatment technologies and stringent regulations aimed at improving water quality. The United States, in particular, is a major contributor to the market growth due to its large-scale desalination projects, municipal water treatment systems, and industrial applications. For example, the demand for antiscalants is rising in California, where severe drought conditions and the need for sustainable water management have led to the widespread adoption of desalination technologies. Additionally, the oil and gas industry in the U.S. is a major driver, where antiscalants are used to prevent scaling in water injection systems. The increasing focus on environmental sustainability, along with growing awareness about the efficiency and cost benefits of antiscalants, is further accelerating market growth. As a result, North America’s robust industrial base, coupled with its commitment to water conservation, positions it as the fastest-growing region for antiscalants in the coming years.
Europe IoT Antiscalants Market Insights
Europe’s antiscalants market is driven by strict environmental regulations, advanced industrial infrastructure, and strong adoption of water recycling technologies. Increasing demand from power generation, chemical, and municipal water sectors supports steady growth. Investments in sustainable desalination and eco-friendly antiscalant formulations further strengthen the region’s market outlook.
Latin America (LATAM) and Middle East & Africa (MEA) IoT Antiscalants Market Insights
LATAM and MEA markets are experiencing robust growth due to rapid urbanization, industrialization, and severe water scarcity issues. Heavy investments in desalination projects, particularly in the Middle East, drive significant demand for antiscalants. Expanding oil & gas operations and municipal water treatment initiatives further accelerate market opportunities in these regions.

Get Customized Report as per Your Business Requirement - Enquiry Now
IoT Antiscalants Market Key Players:
-
Acuro Organics (AcuroScale, Acurolite, Antiscalant 502)
-
Ashland (Rheosolve, AV100, Avista Antiscalants)
-
Avista Technologies (Avista 2050, Avista 2030, Avista 6010)
-
BASF SE (Antiscalant 2400, Antiscalant 2500, Antiscalant 2600)
-
BWA Water Additives (BW-3010, BWA Antiscalant 610, BWA Antiscalant 503)
-
Clariant AG (Antiscalant 40, Antiscalant 170, DTI-59)
-
Dow Chemicals (RO Antiscalant 2120, DOW FILMTEC, DOW Antiscalant 2600)
-
Ecolab (ScaleGuard, Nalco 3D TRASAR, Nalco Antiscalant 8889)
-
General Electric (ZEPAK 1200, GE Water Treatment Antiscalant, Scale Control)
-
Italmatch Chemicals S.P.A. (ItalAntiscalant 2050, ItalAntiscalant 2070, Antiscalant 4000)
-
Kemira (Kemira Antiscalant 8610, Kemira 9065, Kemira Antiscalant 1230)
-
Kurita Water Industries Ltd. (Kuriverter, Antiscalant K-220, Kurita Antiscalant K-110)
-
Solenis (Solenis 3000, Solenis 605, ScaleGard)
-
Solvay SA (Antiscalant 8000, ScaleControl, Antiscalant 7100)
-
Syensqo (Syensqo Antiscalant, Syensqo 1000, Syensqo 3000)
-
Veolia Group (Veolia Antiscalant 310, Veolia ScaleSolv, Veolia Anti-Scale)
-
WaterSolve (ScaleSolve 1000, WaterSolve Antiscalant 3000, ScaleSolve 200)
-
Xytel (Xytel Antiscalant, Xytel 100, Xytel 200)
-
Thermax Limited
-
King Lee Technologies
Competitive Landscape for IoT Antiscalants Market:
H2O Innovation specializes in advanced water treatment solutions, including reverse osmosis and desalination systems, where antiscalants play a crucial role. The company provides customized membrane chemicals to enhance system performance, prevent scaling, and extend equipment lifespan. Its focus on innovation and sustainability positions it as a strong player in the antiscalants market.
-
March 2024: H2O Innovation sold its eco-friendly antiscalants, SpectraGuard™ 111 and SpectraGuard™ 311, to over 25 desalination plants worldwide, including seven mega plants. These products significantly reduced CO2 emissions and enhanced transport efficiency by lowering dosage requirements, supporting global sustainability efforts.
Italmatch Chemicals is a global specialty chemical company offering advanced water treatment solutions, including high-performance antiscalants. Its portfolio supports reverse osmosis, desalination, and industrial water systems by preventing scale formation and enhancing operational efficiency. With a focus on sustainability and innovation, Italmatch strengthens its presence in the growing antiscalants market worldwide.
-
April 2024: Univar Solutions partnered with Italmatch Chemicals to offer Dequest® PB eco-friendly antiscalants and dispersants. This collaboration aims to provide manufacturers with sustainable, biodegradable cleaning solutions, addressing the rising demand for environmentally friendly chemicals in water treatment and energy-efficient operations.
Report Attributes | Details |
Market Size in 2024 | USD 4.75 Billion |
Market Size by 2032 | USD 7.53 Billion |
CAGR | CAGR of 5.93% From 2025 to 2032 |
Base Year | 2024 |
Forecast Period | 2025-2032 |
Historical Data | 2021-2023 |
Report Scope & Coverage | Market Size, Segments Analysis, Competitive Landscape, Regional Analysis, DROC & SWOT Analysis, Forecast Outlook |
Key Segments | • By Type (Organic, Inorganic) • By Product Type (Phosphonates, Carboxylates/Carbonates, Sulfonates, Fluorides, Others) • By Application (Power & Construction, Mining, Oil & Gas, Food & Beverage, Chemical & Pharmaceutical, Pulp & Paper, Others) |
Regional Analysis/Coverage | North America (US, Canada), Europe (Germany, UK, France, Italy, Spain, Russia, Poland, Rest of Europe), Asia Pacific (China, India, Japan, South Korea, Australia, ASEAN Countries, Rest of Asia Pacific), Middle East & Africa (UAE, Saudi Arabia, Qatar, South Africa, Rest of Middle East & Africa), Latin America (Brazil, Argentina, Mexico, Colombia, Rest of Latin America). |
Company Profiles | Acuro Organics, Ashland, Avista Technologies, BASF SE, BWA Water Additives, Clariant AG, Dow Chemicals, Ecolab, General Electric, Italmatch Chemicals S.P.A., Kemira, Kurita Water Industries Ltd., Solenis, Solvay SA, Syensqo, Veolia Group, WaterSolve, Xytel, Thermax Limited, King Lee Technologies. |
Table Of Contents
1. Introduction
1.1 Market Definition & Scope
1.2 Research Assumptions & Abbreviations
1.3 Research Methodology
2. Executive Summary
2.1 Market Snapshot
2.2 Market Absolute $ Opportunity Assessment & Y-o-Y Analysis, 2021–2032
2.3 Market Size & Forecast, By Segmentation, 2021–2032
2.3.1 Market Size By Type
2.3.2 Market Size By Product Type
2.3.3 Market Size By Application
2.4 Market Share & Bps Analysis By Region, 2024
2.5 Industry Growth Scenarios – Conservative, Likely & Optimistic
2.6 Industry CxO’s Perspective
3. Market Overview
3.1 Market Dynamics
3.1.1 Drivers
3.1.2 Restraints
3.1.3 Opportunities
3.1.4 Key Market Trends
3.2 Industry PESTLE Analysis
3.3 Key Industry Forces (Porter’s) Impacting Market Growth
3.4 Industry Supply Chain Analysis
3.4.1 Raw Material Suppliers
3.4.2 Manufacturers
3.4.3 Distributors/Suppliers
3.4.4 Customers/End-Users
3.5 Industry Life Cycle Assessment
3.6 Parent Market Overview
3.7 Market Risk Assessment
4. Statistical Insights & Trends Reporting
4.1 Efficiency & Performance Metrics
4.1.1 Average scale inhibition efficiency (%) across different water chemistries
4.1.2 Dosage requirement (mg/L) reduction compared to traditional water treatment chemicals
4.1.3 Average improvement in system lifespan (years) due to antiscalant usage
4.2 Adoption & Application Trends
4.2.1 Percentage adoption by end-use industry (power generation, oil & gas, desalination, mining, food & beverage, municipal water treatment)
4.2.2 Year-on-year growth (%) in antiscalant usage for seawater reverse osmosis (SWRO) desalination plants
4.2.3 Share of applications in membrane systems (RO, NF, UF) vs. conventional boilers and cooling towers (%)
4.3 Chemistry & Product Type Metrics
4.3.1 Distribution (%) of antiscalants by chemical type (phosphonates, polyacrylates, carboxylates, sulfonates, others)
4.3.2 Share of liquid vs. powder formulations in global demand (%)
4.3.3 Average compatibility rate (%) of antiscalants with different membrane types and system designs
4.4 Sustainability & Cost Efficiency Benchmarks
4.4.1 Average reduction in water treatment operational costs (%) achieved with optimized antiscalant dosing
4.4.2 Share of biodegradable and eco-friendly antiscalant products in total market demand (%)
4.4.3 Average reduction in chemical cleaning frequency (%) for RO and NF systems using antiscalants
5. Antiscalants Market Segmental Analysis & Forecast, By Type, 2021 – 2032, Value (USD Billion)
5.1 Introduction
5.2 Organic
5.2.1 Key Trends
5.2.2 Market Size & Forecast, 2021 – 2032
5.3 Inorganic
6. Antiscalants Market Segmental Analysis & Forecast, By Product Type, 2021 – 2032, Value (USD Billion)
6.1 Introduction
6.2 Phosphonates
6.2.1 Key Trends
6.2.2 Market Size & Forecast, 2021 – 2032
6.3 Carboxylates/Carbonates
6.4 Sulfonates
6.5 Fluorides
6.6 Others
7. Antiscalants Market Segmental Analysis & Forecast, By Application, 2021 – 2032, Value (USD Billion)
7.1 Introduction
7.2 Power & Construction
7.2.1 Key Trends
7.2.2 Market Size & Forecast, 2021 – 2032
7.3 Mining
7.4 Oil & Gas
7.5 Food & Beverage
7.6 Chemical & Pharmaceutical
7.7 Pulp & Paper
7.8 Others
8. Antiscalants Market Segmental Analysis & Forecast By Region, 2021 – 2025, Value (USD Billion)
8.1 Introduction
8.2 North America
8.2.1 Key Trends
8.2.2 Antiscalants Market Size & Forecast, By Type, 2021 – 2032
8.2.3 Antiscalants Market Size & Forecast, By Product Type, 2021 – 2032
8.2.4 Antiscalants Market Size & Forecast, By Application, 2021 – 2032
8.2.5 Antiscalants Market Size & Forecast, By Country, 2021 – 2032
8.2.5.1 USA
8.2.5.1.1 Antiscalants Market Size & Forecast, By Type, 2021 – 2032
8.2.5.1.2 Antiscalants Market Size & Forecast, By Product Type, 2021 – 2032
8.2.5.1.3 Antiscalants Market Size & Forecast, By Application, 2021 – 2032
8.2.5.2 Canada
8.2.5.2.1 Antiscalants Market Size & Forecast, By Type, 2021 – 2032
8.2.5.2.2 Antiscalants Market Size & Forecast, By Product Type, 2021 – 2032
8.2.5.2.3 Antiscalants Market Size & Forecast, By Application, 2021 – 2032
8.3 Europe
8.3.1 Key Trends
8.3.2 Antiscalants Market Size & Forecast, By Type, 2021 – 2032
8.3.3 Antiscalants Market Size & Forecast, By Product Type, 2021 – 2032
8.3.4 Antiscalants Market Size & Forecast, By Application, 2021 – 2032
8.3.5 Antiscalants Market Size & Forecast, By Country, 2021 – 2032
8.3.5.1 Germany
8.3.5.1.1 Antiscalants Market Size & Forecast, By Type, 2021 – 2032
8.3.5.1.2 Antiscalants Market Size & Forecast, By Product Type, 2021 – 2032
8.3.5.1.3 Antiscalants Market Size & Forecast, By Application, 2021 – 2032
8.3.5.2 UK
8.3.5.2.1 Antiscalants Market Size & Forecast, By Type, 2021 – 2032
8.3.5.2.2 Antiscalants Market Size & Forecast, By Product Type, 2021 – 2032
8.3.5.2.3 Antiscalants Market Size & Forecast, By Application, 2021 – 2032
8.3.5.3 France
8.3.5.3.1 Antiscalants Market Size & Forecast, By Type, 2021 – 2032
8.3.5.3.2 Antiscalants Market Size & Forecast, By Product Type, 2021 – 2032
8.3.5.3.3 Antiscalants Market Size & Forecast, By Application, 2021 – 2032
8.3.5.4 Italy
8.3.5.4.1 Antiscalants Market Size & Forecast, By Type, 2021 – 2032
8.3.5.4.2 Antiscalants Market Size & Forecast, By Product Type, 2021 – 2032
8.3.5.4.3 Antiscalants Market Size & Forecast, By Application, 2021 – 2032
8.3.5.5 Spain
8.3.5.5.1 Antiscalants Market Size & Forecast, By Type, 2021 – 2032
8.3.5.5.2 Antiscalants Market Size & Forecast, By Product Type, 2021 – 2032
8.3.5.5.3 Antiscalants Market Size & Forecast, By Application, 2021 – 2032
8.3.5.6 Russia
8.3.5.6.1 Antiscalants Market Size & Forecast, By Type, 2021 – 2032
8.3.5.6.2 Antiscalants Market Size & Forecast, By Product Type, 2021 – 2032
8.3.5.6.3 Antiscalants Market Size & Forecast, By Application, 2021 – 2032
8.3.5.7 Poland
8.3.5.7.1 Antiscalants Market Size & Forecast, By Type, 2021 – 2032
8.3.5.7.2 Antiscalants Market Size & Forecast, By Product Type, 2021 – 2032
8.3.5.7.3 Antiscalants Market Size & Forecast, By Application, 2021 – 2032
8.3.5.8 Rest of Europe
8.3.5.8.1 Antiscalants Market Size & Forecast, By Type, 2021 – 2032
8.3.5.8.2 Antiscalants Market Size & Forecast, By Product Type, 2021 – 2032
8.3.5.8.3 Antiscalants Market Size & Forecast, By Application, 2021 – 2032
8.4 Asia-Pacific
8.4.1 Key Trends
8.4.2 Antiscalants Market Size & Forecast, By Type, 2021 – 2032
8.4.3 Antiscalants Market Size & Forecast, By Product Type, 2021 – 2032
8.4.4 Antiscalants Market Size & Forecast, By Application, 2021 – 2032
8.4.5 Antiscalants Market Size & Forecast, By Country, 2021 – 2032
8.4.5.1 China
8.4.5.1.1 Antiscalants Market Size & Forecast, By Type, 2021 – 2032
8.4.5.1.2 Antiscalants Market Size & Forecast, By Product Type, 2021 – 2032
8.4.5.1.3 Antiscalants Market Size & Forecast, By Application, 2021 – 2032
8.4.5.2 India
8.4.5.2.1 Antiscalants Market Size & Forecast, By Type, 2021 – 2032
8.4.5.2.2 Antiscalants Market Size & Forecast, By Product Type, 2021 – 2032
8.4.5.2.3 Antiscalants Market Size & Forecast, By Application, 2021 – 2032
8.4.5.3 Japan
8.4.5.3.1 Antiscalants Market Size & Forecast, By Type, 2021 – 2032
8.4.5.3.2 Antiscalants Market Size & Forecast, By Product Type, 2021 – 2032
8.4.5.3.3 Antiscalants Market Size & Forecast, By Application, 2021 – 2032
8.4.5.4 South Korea
8.4.5.4.1 Antiscalants Market Size & Forecast, By Type, 2021 – 2032
8.4.5.4.2 Antiscalants Market Size & Forecast, By Product Type, 2021 – 2032
8.4.5.4.3 Antiscalants Market Size & Forecast, By Application, 2021 – 2032
8.4.5.5 Australia
8.4.5.5.1 Antiscalants Market Size & Forecast, By Type, 2021 – 2032
8.4.5.5.2 Antiscalants Market Size & Forecast, By Product Type, 2021 – 2032
8.4.5.5.3 Antiscalants Market Size & Forecast, By Application, 2021 – 2032
8.4.5.6 ASEAN Countries
8.4.5.6.1 Antiscalants Market Size & Forecast, By Type, 2021 – 2032
8.4.5.6.2 Antiscalants Market Size & Forecast, By Product Type, 2021 – 2032
8.4.5.6.3 Antiscalants Market Size & Forecast, By Application, 2021 – 2032
8.4.5.7 Rest of Asia-Pacific
8.4.5.7.1 Antiscalants Market Size & Forecast, By Type, 2021 – 2032
8.4.5.7.2 Antiscalants Market Size & Forecast, By Product Type, 2021 – 2032
8.4.5.7.3 Antiscalants Market Size & Forecast, By Application, 2021 – 2032
8.5 Latin America
8.5.1 Key Trends
8.5.2 Antiscalants Market Size & Forecast, By Type, 2021 – 2032
8.5.3 Antiscalants Market Size & Forecast, By Product Type, 2021 – 2032
8.5.4 Antiscalants Market Size & Forecast, By Application, 2021 – 2032
8.5.5 Antiscalants Market Size & Forecast, By Country, 2021 – 2032
8.5.5.1 Brazil
8.5.5.1.1 Antiscalants Market Size & Forecast, By Type, 2021 – 2032
8.5.5.1.2 Antiscalants Market Size & Forecast, By Product Type, 2021 – 2032
8.5.5.1.3 Antiscalants Market Size & Forecast, By Application, 2021 – 2032
8.5.5.2 Argentina
8.5.5.2.1 Antiscalants Market Size & Forecast, By Type, 2021 – 2032
8.5.5.2.2 Antiscalants Market Size & Forecast, By Product Type, 2021 – 2032
8.5.5.2.3 Antiscalants Market Size & Forecast, By Application, 2021 – 2032
8.5.5.3 Mexico
8.5.5.3.1 Antiscalants Market Size & Forecast, By Type, 2021 – 2032
8.5.5.3.2 Antiscalants Market Size & Forecast, By Product Type, 2021 – 2032
8.5.5.3.3 Antiscalants Market Size & Forecast, By Application, 2021 – 2032
8.5.5.4 Colombia
8.5.5.4.1 Antiscalants Market Size & Forecast, By Type, 2021 – 2032
8.5.5.4.2 Antiscalants Market Size & Forecast, By Product Type, 2021 – 2032
8.5.5.4.3 Antiscalants Market Size & Forecast, By Application, 2021 – 2032
8.5.5.5 Rest of Latin America
8.5.5.5.1 Antiscalants Market Size & Forecast, By Type, 2021 – 2032
8.5.5.5.2 Antiscalants Market Size & Forecast, By Product Type, 2021 – 2032
8.5.5.5.3 Antiscalants Market Size & Forecast, By Application, 2021 – 2032
8.6 Middle East & Africa
8.6.1 Key Trends
8.6.2 Antiscalants Market Size & Forecast, By Type, 2021 – 2032
8.6.3 Antiscalants Market Size & Forecast, By Product Type, 2021 – 2032
8.6.4 Antiscalants Market Size & Forecast, By Application, 2021 – 2032
8.6.5 Antiscalants Market Size & Forecast, By Country, 2021 – 2032
8.6.5.1 UAE
8.6.5.1.1 Antiscalants Market Size & Forecast, By Type, 2021 – 2032
8.6.5.1.2 Antiscalants Market Size & Forecast, By Product Type, 2021 – 2032
8.6.5.1.3 Antiscalants Market Size & Forecast, By Application, 2021 – 2032
8.6.5.2 Saudi Arabia
8.6.5.2.1 Antiscalants Market Size & Forecast, By Type, 2021 – 2032
8.6.5.2.2 Antiscalants Market Size & Forecast, By Product Type, 2021 – 2032
8.6.5.2.3 Antiscalants Market Size & Forecast, By Application, 2021 – 2032
8.6.5.3 Qatar
8.6.5.3.1 Antiscalants Market Size & Forecast, By Type, 2021 – 2032
8.6.5.3.2 Antiscalants Market Size & Forecast, By Product Type, 2021 – 2032
8.6.5.3.3 Antiscalants Market Size & Forecast, By Application, 2021 – 2032
8.6.5.4 Egypt
8.6.5.4.1 Antiscalants Market Size & Forecast, By Type, 2021 – 2032
8.6.5.4.2 Antiscalants Market Size & Forecast, By Product Type, 2021 – 2032
8.6.5.4.3 Antiscalants Market Size & Forecast, By Application, 2021 – 2032
8.6.5.5 South Africa
8.6.5.5.1 Antiscalants Market Size & Forecast, By Type, 2021 – 2032
8.6.5.5.2 Antiscalants Market Size & Forecast, By Product Type, 2021 – 2032
8.6.5.5.3 Antiscalants Market Size & Forecast, By Application, 2021 – 2032
8.6.5.6 Rest of Middle East & Africa
8.6.5.6.1 Antiscalants Market Size & Forecast, By Type, 2021 – 2032
8.6.5.6.2 Antiscalants Market Size & Forecast, By Product Type, 2021 – 2032
8.6.5.6.3 Antiscalants Market Size & Forecast, By Application, 2021 – 2032
9. Competitive Landscape
9.1 Key Players' Positioning
9.2 Competitive Developments
9.2.1 Key Strategies Adopted (%), By Key Players, 2024
9.2.2 Year-Wise Strategies & Development, 2021 – 2025
9.2.3 Number Of Strategies Adopted By Key Players, 2024
9.3 Market Share Analysis, 2024
9.4 Product/Service & Application Benchmarking
9.4.1 Product/Service Specifications & Features By Key Players
9.4.2 Product/Service Heatmap By Key Players
9.4.3 Application Heatmap By Key Players
9.5 Industry Start-Up & Innovation Landscape
9.6 Key Company Profiles
9.6.1 Acuro Organics
9.6.1.1 Company Overview & Snapshot
9.6.1.2 Product/Service Portfolio
9.6.1.3 Key Company Financials
9.6.1.4 SWOT Analysis
9.6.2 Ashland
9.6.3 Avista Technologies
9.6.4 BASF SE
9.6.5 BWA Water Additives
9.6.6 Clariant AG
9.6.7 Dow Chemicals
9.6.8 Ecolab
9.6.9 General Electric
9.6.10 Italmatch Chemicals S.P.A.
9.6.11 Kemira
9.6.12 Kurita Water Industries Ltd.
9.6.13 Solenis
9.6.14 Solvay SA
9.6.15 Syensqo
9.6.16 Veolia Group
9.6.17 WaterSolve
9.6.18 Xytel
9.6.19 Thermax Limited
9.6.20 King Lee Technologies
10. Analyst Recommendations
10.1 SNS Insider Opportunity Map
10.2 Industry Low-Hanging Fruit Assessment
10.3 Market Entry & Growth Strategy
10.4 Analyst Viewpoint & Suggestions On Market Growth
11. Assumptions
12. Disclaimer
13. Appendix
13.1 List Of Tables
13.2 List Of Figures
Key Segments:
By Type
-
Organic
-
Inorganic
By Product Type
-
Phosphonates
-
Carboxylates/Carbonates
-
Sulfonates
-
Fluorides
-
Others
By Application
-
Power & Construction
-
Mining
-
Oil & Gas
-
Food & Beverage
-
Chemical & Pharmaceutical
-
Pulp & Paper
-
Others
Request for Segment Customization as per your Business Requirement: Segment Customization Request
Regional Coverage:
North America
-
US
-
Canada
-
Mexico
Europe
-
Eastern Europe
-
Poland
-
Romania
-
Hungary
-
Turkey
-
Rest of Eastern Europe
-
-
Western Europe
-
Germany
-
France
-
UK
-
Italy
-
Spain
-
Netherlands
-
Switzerland
-
Austria
-
Rest of Western Europe
-
Asia Pacific
-
China
-
India
-
Japan
-
South Korea
-
Vietnam
-
Singapore
-
Australia
-
Rest of Asia Pacific
Middle East & Africa
-
Middle East
-
UAE
-
Egypt
-
Saudi Arabia
-
Qatar
-
Rest of Middle East
-
-
Africa
-
Nigeria
-
South Africa
-
Rest of Africa
-
Latin America
-
Brazil
-
Argentina
-
Colombia
-
Rest of Latin America
Request for Country Level Research Report: Country Level Customization Request
Available Customization
With the given market data, SNS Insider offers customization as per the company’s specific needs. The following customization options are available for the report:
-
Detailed Volume Analysis
-
Criss-Cross segment analysis (e.g. Product X Application)
-
Competitive Product Benchmarking
-
Geographic Analysis
-
Additional countries in any of the regions
-
Customized Data Representation
-
Detailed analysis and profiling of additional market players
An accurate research report requires proper strategizing as well as implementation. There are multiple factors involved in the completion of good and accurate research report and selecting the best methodology to compete the research is the toughest part. Since the research reports we provide play a crucial role in any company’s decision-making process, therefore we at SNS Insider always believe that we should choose the best method which gives us results closer to reality. This allows us to reach at a stage wherein we can provide our clients best and accurate investment to output ratio.
Each report that we prepare takes a timeframe of 350-400 business hours for production. Starting from the selection of titles through a couple of in-depth brain storming session to the final QC process before uploading our titles on our website we dedicate around 350 working hours. The titles are selected based on their current market cap and the foreseen CAGR and growth.
The 5 steps process:
Step 1: Secondary Research:
Secondary Research or Desk Research is as the name suggests is a research process wherein, we collect data through the readily available information. In this process we use various paid and unpaid databases which our team has access to and gather data through the same. This includes examining of listed companies’ annual reports, Journals, SEC filling etc. Apart from this our team has access to various associations across the globe across different industries. Lastly, we have exchange relationships with various university as well as individual libraries.

Step 2: Primary Research
When we talk about primary research, it is a type of study in which the researchers collect relevant data samples directly, rather than relying on previously collected data. This type of research is focused on gaining content specific facts that can be sued to solve specific problems. Since the collected data is fresh and first hand therefore it makes the study more accurate and genuine.
We at SNS Insider have divided Primary Research into 2 parts.
Part 1 wherein we interview the KOLs of major players as well as the upcoming ones across various geographic regions. This allows us to have their view over the market scenario and acts as an important tool to come closer to the accurate market numbers. As many as 45 paid and unpaid primary interviews are taken from both the demand and supply side of the industry to make sure we land at an accurate judgement and analysis of the market.
This step involves the triangulation of data wherein our team analyses the interview transcripts, online survey responses and observation of on filed participants. The below mentioned chart should give a better understanding of the part 1 of the primary interview.

Part 2: In this part of primary research the data collected via secondary research and the part 1 of the primary research is validated with the interviews from individual consultants and subject matter experts.
Consultants are those set of people who have at least 12 years of experience and expertise within the industry whereas Subject Matter Experts are those with at least 15 years of experience behind their back within the same space. The data with the help of two main processes i.e., FGDs (Focused Group Discussions) and IDs (Individual Discussions). This gives us a 3rd party nonbiased primary view of the market scenario making it a more dependable one while collation of the data pointers.
Step 3: Data Bank Validation
Once all the information is collected via primary and secondary sources, we run that information for data validation. At our intelligence centre our research heads track a lot of information related to the market which includes the quarterly reports, the daily stock prices, and other relevant information. Our data bank server gets updated every fortnight and that is how the information which we collected using our primary and secondary information is revalidated in real time.

Step 4: QA/QC Process
After all the data collection and validation our team does a final level of quality check and quality assurance to get rid of any unwanted or undesired mistakes. This might include but not limited to getting rid of the any typos, duplication of numbers or missing of any important information. The people involved in this process include technical content writers, research heads and graphics people. Once this process is completed the title gets uploader on our platform for our clients to read it.
Step 5: Final QC/QA Process:
This is the last process and comes when the client has ordered the study. In this process a final QA/QC is done before the study is emailed to the client. Since we believe in giving our clients a good experience of our research studies, therefore, to make sure that we do not lack at our end in any way humanly possible we do a final round of quality check and then dispatch the study to the client.