image

Bio-Based Leather Market Report Scope & Overview:

Bio-Based-Leather-Market Revenue Analysis

Get more information on Bio-Based Leather Market - Request Sample Report

Bio-Based Leather Market Report Scope & Overview:

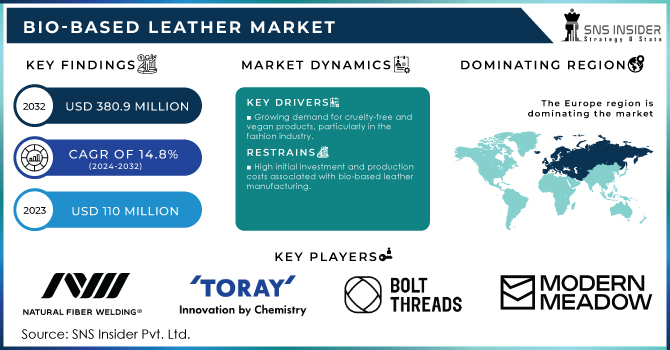
The Bio-Based Leather Market Size was valued at USD 110.0 million in 2023 and is expected to reach USD 380.9 million by 2032 and grow at a CAGR of 14.8% over the forecast period 2024-2032.

The bio-based leather market is rapidly gaining traction due to the increasing demand for sustainable alternatives to traditional leather. Bio-based leather is crafted from renewable resources like agricultural waste, plant-based polymers, and even microorganisms, making it a preferred option for environmentally conscious consumers and industries. Major factors driving this market include heightened consumer awareness of environmental impact, stringent regulations on animal-based leather production, and growing innovations in the material’s strength and durability. Traditional leather production has faced scrutiny due to its high environmental costs, including deforestation, water consumption, and pollution from tanning processes. Bio-based alternatives present a compelling solution, attracting investments and partnerships in various industries, particularly in fashion, automotive, and interior design.

One significant development came in August 2024, when the bio-based vegan leather industry witnessed a surge in innovation as startups introduced high-performance alternatives to synthetic and animal-derived materials. These startups are leveraging advanced technologies to create leather from agricultural by-products and other renewable resources, addressing both sustainability and performance concerns. Companies are focusing on durability, texture, and production scalability to ensure that bio-based leather can compete with conventional leather in terms of quality and longevity. This innovation is crucial as many fashion brands and designers are committed to reducing their carbon footprint, making bio-based leather an attractive option for future collections.

In June 2024, a breakthrough in bio-based leather development was reported when researchers introduced a material that is 60 times stronger than its traditional counterparts. This advancement marks a significant step forward in the market’s potential, as strength and durability have been key challenges for bio-based alternatives. The innovation was developed through a blend of bio-engineered polymers that maintain flexibility while drastically improving the tensile strength of the material. Such advancements are crucial for broader adoption, particularly in industries where leather is subject to high wear and tear, such as in automotive interiors and furniture manufacturing.

The evolving trends within the bio-based leather market reflect a shift toward more sustainable and durable products. As noted in Boze Leather’s June 2024 insights, the industry is seeing increased interest from major corporations aiming to incorporate eco-friendly materials into their product lines. These companies are investing in research and development to produce leather that not only meets sustainability standards but also offers comparable or superior performance to animal-based leathers. The industry is focused on creating bio-based leather that can mimic the look and feel of genuine leather, while also exploring new aesthetic possibilities unique to plant-based materials. This movement aligns with consumer preferences for ethical, high-quality products.

The bio-based leather market is poised to expand further as companies continue to innovate and consumers shift toward more sustainable choices. With major fashion brands, automotive manufacturers, and interior designers looking for alternatives to animal-derived leather, bio-based materials are positioned to become a dominant force. The ability of these materials to offer durability and aesthetic appeal, combined with their eco-friendly nature, has made them increasingly popular in both high-end and mass-market segments. Recent technological advancements and growing awareness of sustainability’s importance will likely propel this market to new heights in the coming years.

Market Dynamics:

Drivers:

  • Rising Environmental Awareness and Consumer Demand for Sustainable Products

The growing emphasis on sustainability and environmental responsibility is a key driver of the bio-based leather market. Consumers are increasingly seeking eco-friendly alternatives that reduce environmental impact, pushing companies to adopt bio-based materials in their products to meet this demand. As consumers become more aware of the environmental damage caused by traditional leather production, which includes high water consumption, deforestation, and the use of harmful chemicals, demand for sustainable alternatives has surged. The fashion, automotive, and furniture industries are under significant pressure to reduce their carbon footprints and find eco-friendly solutions. Bio-based leather offers a renewable, low-impact alternative that appeals to environmentally conscious consumers. This rising demand is further supported by younger generations who prioritize sustainability in their purchasing decisions. Brands are responding by incorporating bio-based leather into their product lines, aligning with the growing market preference for ethical and sustainable choices. Additionally, regulatory policies aimed at reducing carbon emissions and pollution are pushing companies toward adopting bio-based materials, further driving market growth. As environmental awareness increases globally, this trend will likely continue to accelerate the shift toward bio-based leather products.

  • Innovations in bio-based leather production technologies have significantly boosted the market.

Innovations in bio-based leather production technologies have significantly boosted the market. New methods to enhance the durability, texture, and appearance of bio-based leather are helping it compete with traditional leather, making it more appealing for a wide range of applications, from fashion to automotive. Technological advancements in material science are driving the evolution of bio-based leather, enabling it to meet the performance standards of conventional leather. Researchers have developed new processes that increase the strength, durability, and aesthetic appeal of bio-based alternatives, overcoming previous limitations. For instance, new bio-based polymers and materials derived from agricultural waste or microorganisms are now being engineered to mimic the look and feel of traditional leather while offering superior sustainability. Innovations such as the development of bio-based leather that is 60 times stronger than traditional options are expanding its potential in high-performance applications like automotive interiors, furniture, and high-end fashion. Additionally, advancements in production scalability and cost-efficiency are making bio-based leather more accessible to mass markets. These innovations are crucial for its adoption across industries, as they allow bio-based leather to compete with animal leather not only on sustainability but also on performance and cost-effectiveness.

Restraint:

  • High Production Costs and Scalability Challenges

Despite its growing popularity, bio-based leather faces significant challenges in terms of high production costs and scalability. These factors make it difficult for manufacturers to produce bio-based leather at competitive prices compared to traditional leather, limiting its market penetration. Bio-based leather production is still in its early stages, and while it offers substantial environmental benefits, the costs associated with its production remain high. Unlike traditional leather, which benefits from established supply chains and economies of scale, bio-based leather requires advanced materials and specialized processes that drive up costs. For instance, producing leather from plant-based polymers or agricultural waste often involves complex chemical treatments and biotechnological innovations, which can be expensive. Additionally, scaling up production to meet the growing demand presents significant challenges. Many companies working with bio-based leather are startups or smaller enterprises that lack the resources to expand production on a large scale, which results in limited availability and higher prices. As a result, bio-based leather is often priced higher than its animal-based counterpart, making it less accessible to mass-market consumers. Until production costs can be reduced and scalability issues are addressed, this will remain a significant barrier to the widespread adoption of bio-based leather.

Opportunity:

  • Growing Adoption in the Fashion and Automotive Industries

The increasing adoption of bio-based leather in the fashion and automotive industries presents a significant opportunity for market growth. Major brands are seeking sustainable alternatives to animal leather, and bio-based leather’s versatility makes it an ideal material for these sectors. The fashion and automotive industries are two of the largest consumers of traditional leather, but they are also among the sectors most actively seeking sustainable alternatives. In recent years, major fashion houses, as well as automotive manufacturers, have begun incorporating bio-based leather into their products to meet consumer demands for eco-friendly materials. Fashion brands are particularly attracted to bio-based leather for its ability to offer the same luxury appeal as traditional leather without the ethical concerns. High-end designers and fast-fashion brands alike are exploring bio-based leather for clothing, accessories, and footwear. Similarly, automotive companies are incorporating bio-based leather into car interiors as part of their broader sustainability initiatives. With its growing adoption in these industries, the bio-based leather market has the potential to expand significantly in the coming years. As more companies in fashion and automotive move towards sustainability, bio-based leather will become a preferred material, opening up vast opportunities for growth.

Challenge:

  • Limited Awareness and Consumer Perception

One of the significant challenges facing the bio-based leather market is limited consumer awareness and perception. Many consumers are still unfamiliar with bio-based leather or question its durability and quality, which can hinder its widespread adoption in the market. Despite growing environmental awareness, many consumers remain unaware of bio-based leather and its benefits. Traditional leather has a long-established reputation for quality, durability, and luxury, making it the go-to choice for many consumers. In contrast, bio-based leather is a relatively new concept, and some consumers are skeptical about its ability to match the performance and appearance of conventional leather. Additionally, there is confusion in the market, as many consumers may not fully understand the difference between synthetic leather, bio-based leather, and other alternatives. This lack of awareness is compounded by inconsistent marketing and communication from brands, which may fail to clearly highlight the sustainability and performance benefits of bio-based leather. Overcoming this challenge will require targeted educational campaigns, clear labeling, and transparent communication from manufacturers and retailers to build consumer trust and awareness. Without addressing these perception issues, bio-based leather may struggle to achieve mainstream adoption, limiting its growth potential in the broader market.

Key Market Segments

By Source

In 2023, the mushroom-based leather segment dominated the bio-based leather market, accounting for approximately 35% of the market share. Mushroom leather, primarily derived from mycelium, gained significant traction due to its sustainable production process, which requires fewer resources and produces less waste compared to traditional leather. Leading fashion brands have embraced mushroom leather, with companies like Bolt Threads collaborating with high-end designers to create eco-friendly luxury products. Its versatility and close resemblance to animal leather in terms of texture and durability have made it a preferred choice in the fashion industry, accelerating its adoption across multiple sectors.

By End-Use

In 2023, the footwear segment dominated the bio-based leather market, capturing an estimated 40% market share. Footwear brands have increasingly turned to bio-based leather due to rising consumer demand for sustainable and eco-friendly products. Leading companies like Adidas and Nike have introduced bio-based leather shoes as part of their sustainability initiatives, using materials like cactus and pineapple leather in various collections. The durability and aesthetic appeal of bio-based leather make it particularly suitable for footwear, where strength and design flexibility are essential. This trend has helped the segment maintain its leading position in the market.

Regional Analysis

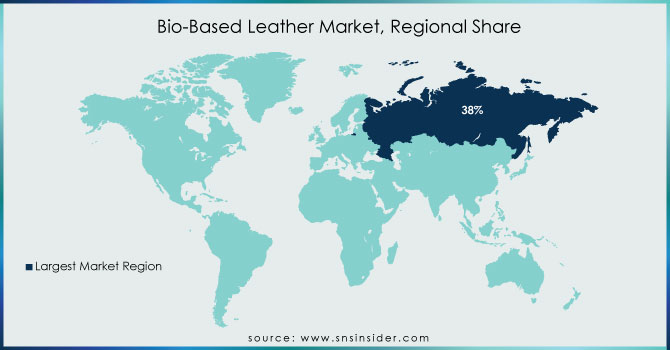
In 2023, Europe dominated the bio-based leather market, holding an estimated 45% market share. The region’s leadership stems from strong environmental regulations, consumer demand for sustainable products, and the presence of numerous eco-conscious fashion brands. European companies like Stella McCartney and Gucci have been early adopters of bio-based leather alternatives, using innovative materials like mushroom and apple leather in their collections. Additionally, governmental policies promoting sustainability have further accelerated the adoption of eco-friendly materials across industries, especially in the fashion and automotive sectors.

Moreover, the Asia-Pacific region is the fastest-growing market for bio-based leather in 2023, with an estimated CAGR of 12%. This growth is fueled by rising consumer awareness about sustainability, expanding footwear and fashion industries, and increasing investments in bio-materials technology in countries like China, India, and Japan. Brands in this region are exploring alternatives to traditional leather due to environmental concerns and shifting consumer preferences. Companies like Allbirds have also tapped into the Asian market with bio-based leather footwear, further driving the rapid adoption of sustainable materials in this region.

Bio-Based-Leather-Market-Regional-Share

Get Customized Report as per your Business Requirement - Request For Customized Report

Key Players 

  • Ananas Anam Ltd. (Pinatex, Pinatex Bags)

  • Bolt Threads Inc. (Mylo, Mylo Footwear)

  • Beyond Leather Materials (Apple Leather, Apple Waste Leather)

  • ECCO Leather (ECCO Leather Shoes, ECCO Leather Bags)

  • Fruitleather Rotterdam (Fruit Leather, Fruitleather Bags)

  • Lignolux (Lignolux Leather, Lignolux Upholstery)

  • Made with Mars (Mars Leather, Mars Accessories)

  • Modern Meadows (Bio-VERA, Bio-Alloy Leather)

  • MycoWorks (Reishi, Mycelium Leather)

  • Natural Fiber Welding Inc. (Mirum, Natural Fiber Leather)

  • Nat-2 (Nat-2 Shoes, Nat-2 Bags)

  • Nova Kaeru (Fish Leather, Eco-Friendly Leather)

  • PEEL Lab (PEEL Leather, PEEL Accessories)

  • Pinatex (Pinatex Textiles, Pinatex Shoes)

  • Proviera (Proviera Leather, Eco-Leather)

  • Tjeerd Veenhoven Studio (Veenhoven Leather, Designer Leather Goods)

  • Toray Industries Inc. (Toray Biodegradable Leather, Eco-Leather Products)

  • Ultrafabrics (Ultrafabrics Bio-Fabric, Eco-Friendly Upholstery)

  • VEGEA (VEGEA Leather, VEGEA Bags)

  • Zoa (Zoa Leather, Sustainable Leather Goods)

Recent Developments

  • September 2024: Beyond Leather Materials introduced an 85% bio-based leather alternative made from apple waste, using Covestro's PU dispersions, promoting sustainability by repurposing agricultural waste.

  • June 2023: Natural Fiber Welding, Inc. partnered with Ahima to simplify the sampling and development process for footwear made with MIRUM, expanding the company’s reach across various markets.

  • June 2023: Modern Meadows entered a strategic partnership with Navis TubeTex, aiming to revolutionize the dyeing, finishing, and coating equipment sector by combining Modern Meadows’ Bio-Alloy technology with Navis TubeTex’s advanced Gaston Systems foam technology.

  • March 2023: Adriano di Marti launched Desserto Agave, a bio-based leather made from agave plant leaves, a byproduct of tequila production. The leaves are processed into fibers and blended with resin to create a leather-like material.

Bio-based Leather Market Report Scope:

Report Attributes Details
Market Size in 2023 US$ 110 Million
Market Size by 2032 US$ 380.9 Million
CAGR CAGR of 14.8% From 2024 to 2032
Base Year 2023
Forecast Period 2024-2032
Historical Data 2020-2022
Report Scope & Coverage Market Size, Segments Analysis, Competitive  Landscape, Regional Analysis, DROC & SWOT Analysis, Forecast Outlook
Key Segments • By Source (Mushroom, Pineapple, Cork, Apple, Tree bark, Leftover Fruits, Cactus, and Others (Corn, Coconut Husk, and Palm))
• By End-Use (Footwear, Garments & Accessories, and Others (Furniture and Automotive))
Regional Analysis/Coverage North America (US, Canada, Mexico), Europe (Eastern Europe [Poland, Romania, Hungary, Turkey, Rest of Eastern Europe] Western Europe] Germany, France, UK, Italy, Spain, Netherlands, Switzerland, Austria, Rest of Western Europe]), Asia Pacific (China, India, Japan, South Korea, Vietnam, Singapore, Australia, Rest of Asia Pacific), Middle East & Africa (Middle East [UAE, Egypt, Saudi Arabia, Qatar, Rest of Middle East], Africa [Nigeria, South Africa, Rest of Africa], Latin America (Brazil, Argentina, Colombia, Rest of Latin America)
Company Profiles Natural Fiber Welding Inc., Ananas Anam Ltd., Toray Industries Inc., Bolt Threads Inc., Modern Meadows, ECCO Leather,  Nat-2, MycoWorks, VEGEA, Fruitleather Rotterdam, Ultrafabrics, Tjeerd Veenhoven studio.
DRIVERS • Increasing consumer awareness and preference for sustainable and eco-friendly products
• Stringent regulations promoting the use of alternatives to traditional leather due to environmental concerns and animal welfare
• Growing demand for cruelty-free and vegan products, particularly in the fashion industry.
Restraints • High initial investment and production costs associated with bio-based leather manufacturing
• Limited availability of raw materials for bio-based leather production, impacting scalability
• Lack of widespread adoption and awareness among consumers and industries

Frequently Asked Questions

Ans. The Compound Annual Growth rate for the Bio-Based Leather Market over the forecast period is 14.8%.

Ans. The projected market size for the Bio-Based Leather Market is USD 380.9 million by 2032.

Ans: China dominated the Asia Pacific region in the Bio-Based Leather Market with the highest revenue share in 2023.

Ans: The key drivers of the Bio-Based Leather Market include increasing consumer demand for sustainable and cruelty-free products, coupled with advancements in biotechnology enabling the development of innovative bio-based leather alternatives.

Ans: One challenge for the Bio-Based Leather Market is the competition from traditional leather and synthetic alternatives.

Table of Content

1. Introduction

1.1 Market Definition

1.2 Scope (Inclusion and Exclusions)

1.3 Research Assumptions

2. Executive Summary

2.1 Market Overview

2.2 Regional Synopsis

2.3 Competitive Summary

3. Research Methodology

3.1 Top-Down Approach

3.2 Bottom-up Approach

3.3. Data Validation

3.4 Primary Interviews

4. Market Dynamics Impact Analysis

4.1 Market Driving Factors Analysis

4.1.2 Drivers

4.1.2 Restraints

4.1.3 Opportunities

4.1.4 Challenges

4.2 PESTLE Analysis

4.3 Porter’s Five Forces Model

5. Statistical Insights and Trends Reporting

5.1 Production Capacity and Utilization, by Country, by Type, 2023

5.2 Raw Material Price Analysis, by Country, by Type, 2023

5.3 Regulatory Impact, by Country, by Type, 2023

5.4 Environmental Metrics: Emissions Data, Waste Management Practices, and Sustainability Initiatives, by Region

5.5 Innovation and R&D, by Type, 2023

6. Competitive Landscape

6.1 List of Major Companies, By Region

6.2 Market Share Analysis, By Region

6.3 Product Benchmarking

6.3.1 Product specifications and features

6.3.2 Pricing

6.4 Strategic Initiatives

6.4.1 Marketing and promotional activities

6.4.2 Distribution and supply chain strategies

6.4.3 Expansion plans and new product launches

6.4.4 Strategic partnerships and collaborations

6.5 Technological Advancements

6.6 Market Positioning and Branding

7. Bio-Based Leather Market Segmentation, by Source

7.1 Chapter Overview

7.2 Mushroom

7.2.1 Mushroom Market Trends Analysis (2020-2032)

7.2.2 Mushroom Market Size Estimates and Forecasts to 2032 (USD Million)

7.3 Pineapple

7.3.1 Pineapple Market Trends Analysis (2020-2032)

7.3.2 Pineapple Market Size Estimates and Forecasts to 2032 (USD Million)

7.4 Cork

7.4.1 Cork Market Trends Analysis (2020-2032)

7.4.2 Cork Market Size Estimates and Forecasts to 2032 (USD Million)

7.5 Apple

7.5.1 Apple Market Trends Analysis (2020-2032)

7.5.2 Apple Market Size Estimates and Forecasts to 2032 (USD Million)

7.6 Tree bark

7.6.1 Tree bark Market Trends Analysis (2020-2032)

7.6.2 Tree bark Market Size Estimates and Forecasts to 2032 (USD Million)

7.7 Leftover Fruits

7.7.1 Leftover Fruits Market Trends Analysis (2020-2032)

7.7.2 Leftover Fruits Market Size Estimates and Forecasts to 2032 (USD Million)

7.8 Cactus

7.8.1 Cactus Market Trends Analysis (2020-2032)

7.8.2 Cactus Market Size Estimates and Forecasts to 2032 (USD Million)

7.9 Others

7.9.1 Others Market Trends Analysis (2020-2032)

7.9.2 Others Market Size Estimates and Forecasts to 2032 (USD Million)

8. Bio-Based Leather Market Segmentation, by End-Use

8.1 Chapter Overview

8.2 Automotive

8.2.1 Automotive Market Trends Analysis (2020-2032)

8.2.2 Automotive Market Size Estimates and Forecasts to 2032 (USD Million)

8.3 Footwear

8.3.1 Footwear Market Trends Analysis (2020-2032)

8.3.2 Footwear Market Size Estimates and Forecasts to 2032 (USD Million)

8.4 Garments & Accessories

8.4.1 Garments & Accessories Market Trends Analysis (2020-2032)

8.4.2 Garments & Accessories Market Size Estimates and Forecasts to 2032 (USD Million)

8.5 Furniture

8.5.1 Furniture Market Trends Analysis (2020-2032)

8.5.2 Furniture Market Size Estimates and Forecasts to 2032 (USD Million)

8.6 Others

8.6.1 Others Market Trends Analysis (2020-2032)

8.6.2 Others Market Size Estimates and Forecasts to 2032 (USD Million)

9. Regional Analysis

9.1 Chapter Overview

9.2 North America

9.2.1 Trends Analysis

9.2.2 North America Bio-Based Leather Market Estimates and Forecasts, by Country (2020-2032) (USD Million)

9.2.3 North America Bio-Based Leather Market Estimates and Forecasts, by Source (2020-2032) (USD Million) 

9.2.4 North America Bio-Based Leather Market Estimates and Forecasts, by End-Use (2020-2032) (USD Million)

9.2.5 USA

9.2.5.1 USA Bio-Based Leather Market Estimates and Forecasts, by Source (2020-2032) (USD Million)

9.2.5.2 USA Bio-Based Leather Market Estimates and Forecasts, by End-Use (2020-2032) (USD Million)

9.2.6 Canada

9.2.6.1 Canada Bio-Based Leather Market Estimates and Forecasts, by Source (2020-2032) (USD Million)

9.2.6.2 Canada Bio-Based Leather Market Estimates and Forecasts, by End-Use (2020-2032) (USD Million)

9.2.7 Mexico

9.2.7.1 Mexico Bio-Based Leather Market Estimates and Forecasts, by Source (2020-2032) (USD Million)

9.2.7.2 Mexico Bio-Based Leather Market Estimates and Forecasts, by End-Use (2020-2032) (USD Million)

9.3 Europe

9.3.1 Eastern Europe

9.3.1.1 Trends Analysis

9.3.1.2 Eastern Europe Bio-Based Leather Market Estimates and Forecasts, by Country (2020-2032) (USD Million)

9.3.1.3 Eastern Europe Bio-Based Leather Market Estimates and Forecasts, by Source (2020-2032) (USD Million) 

9.3.1.4 Eastern Europe Bio-Based Leather Market Estimates and Forecasts, by End-Use (2020-2032) (USD Million)

9.3.1.5 Poland

9.3.1.5.1 Poland Bio-Based Leather Market Estimates and Forecasts, by Source (2020-2032) (USD Million)

9.3.1.5.2 Poland Bio-Based Leather Market Estimates and Forecasts, by End-Use (2020-2032) (USD Million)

9.3.1.6 Romania

9.3.1.6.1 Romania Bio-Based Leather Market Estimates and Forecasts, by Source (2020-2032) (USD Million)

9.3.1.6.2 Romania Bio-Based Leather Market Estimates and Forecasts, by End-Use (2020-2032) (USD Million)

9.3.1.7 Hungary

9.3.1.7.1 Hungary Bio-Based Leather Market Estimates and Forecasts, by Source (2020-2032) (USD Million)

9.3.1.7.2 Hungary Bio-Based Leather Market Estimates and Forecasts, by End-Use (2020-2032) (USD Million)

9.3.1.8 Turkey

9.3.1.8.1 Turkey Bio-Based Leather Market Estimates and Forecasts, by Source (2020-2032) (USD Million)

9.3.1.8.2 Turkey Bio-Based Leather Market Estimates and Forecasts, by End-Use (2020-2032) (USD Million)

9.3.1.9 Rest of Eastern Europe

9.3.1.9.1 Rest of Eastern Europe Bio-Based Leather Market Estimates and Forecasts, by Source (2020-2032) (USD Million)

9.3.1.9.2 Rest of Eastern Europe Bio-Based Leather Market Estimates and Forecasts, by End-Use (2020-2032) (USD Million)

9.3.2 Western Europe

9.3.2.1 Trends Analysis

9.3.2.2 Western Europe Bio-Based Leather Market Estimates and Forecasts, by Country (2020-2032) (USD Million)

9.3.2.3 Western Europe Bio-Based Leather Market Estimates and Forecasts, by Source (2020-2032) (USD Million) 

9.3.2.4 Western Europe Bio-Based Leather Market Estimates and Forecasts, by End-Use (2020-2032) (USD Million)

9.3.2.5 Germany

9.3.2.5.1 Germany Bio-Based Leather Market Estimates and Forecasts, by Source (2020-2032) (USD Million)

9.3.2.5.2 Germany Bio-Based Leather Market Estimates and Forecasts, by End-Use (2020-2032) (USD Million)

9.3.2.6 France

9.3.2.6.1 France Bio-Based Leather Market Estimates and Forecasts, by Source (2020-2032) (USD Million)

9.3.2.6.2 France Bio-Based Leather Market Estimates and Forecasts, by End-Use (2020-2032) (USD Million)

9.3.2.7 UK

9.3.2.7.1 UK Bio-Based Leather Market Estimates and Forecasts, by Source (2020-2032) (USD Million)

9.3.2.7.2 UK Bio-Based Leather Market Estimates and Forecasts, by End-Use (2020-2032) (USD Million)

9.3.2.8 Italy

9.3.2.8.1 Italy Bio-Based Leather Market Estimates and Forecasts, by Source (2020-2032) (USD Million)

9.3.2.8.2 Italy Bio-Based Leather Market Estimates and Forecasts, by End-Use (2020-2032) (USD Million)

9.3.2.9 Spain

9.3.2.9.1 Spain Bio-Based Leather Market Estimates and Forecasts, by Source (2020-2032) (USD Million)

9.3.2.9.2 Spain Bio-Based Leather Market Estimates and Forecasts, by End-Use (2020-2032) (USD Million)

9.3.2.10 Netherlands

9.3.2.10.1 Netherlands Bio-Based Leather Market Estimates and Forecasts, by Source (2020-2032) (USD Million)

9.3.2.10.2 Netherlands Bio-Based Leather Market Estimates and Forecasts, by End-Use (2020-2032) (USD Million)

9.3.2.11 Switzerland

9.3.2.11.1 Switzerland Bio-Based Leather Market Estimates and Forecasts, by Source (2020-2032) (USD Million)

9.3.2.11.2 Switzerland Bio-Based Leather Market Estimates and Forecasts, by End-Use (2020-2032) (USD Million)

9.3.2.12 Austria

9.3.2.12.1 Austria Bio-Based Leather Market Estimates and Forecasts, by Source (2020-2032) (USD Million)

9.3.2.12.2 Austria Bio-Based Leather Market Estimates and Forecasts, by End-Use (2020-2032) (USD Million)

9.3.2.13 Rest of Western Europe

9.3.2.13.1 Rest of Western Europe Bio-Based Leather Market Estimates and Forecasts, by Source (2020-2032) (USD Million)

9.3.2.13.2 Rest of Western Europe Bio-Based Leather Market Estimates and Forecasts, by End-Use (2020-2032) (USD Million)

9.4 Asia Pacific

9.4.1 Trends Analysis

9.4.2 Asia Pacific Bio-Based Leather Market Estimates and Forecasts, by Country (2020-2032) (USD Million)

9.4.3 Asia Pacific Bio-Based Leather Market Estimates and Forecasts, by Source (2020-2032) (USD Million) 

9.4.4 Asia Pacific Bio-Based Leather Market Estimates and Forecasts, by End-Use (2020-2032) (USD Million)

9.4.5 China

9.4.5.1 China Bio-Based Leather Market Estimates and Forecasts, by Source (2020-2032) (USD Million)

9.4.5.2 China Bio-Based Leather Market Estimates and Forecasts, by End-Use (2020-2032) (USD Million)

9.4.6 India

9.4.5.1 India Bio-Based Leather Market Estimates and Forecasts, by Source (2020-2032) (USD Million)

9.4.5.2 India Bio-Based Leather Market Estimates and Forecasts, by End-Use (2020-2032) (USD Million)

9.4.5 Japan

9.4.5.1 Japan Bio-Based Leather Market Estimates and Forecasts, by Source (2020-2032) (USD Million)

9.4.5.2 Japan Bio-Based Leather Market Estimates and Forecasts, by End-Use (2020-2032) (USD Million)

9.4.6 South Korea

9.4.6.1 South Korea Bio-Based Leather Market Estimates and Forecasts, by Source (2020-2032) (USD Million)

9.4.6.2 South Korea Bio-Based Leather Market Estimates and Forecasts, by End-Use (2020-2032) (USD Million)

9.4.7 Vietnam

9.4.7.1 Vietnam Bio-Based Leather Market Estimates and Forecasts, by Source (2020-2032) (USD Million)

9.2.7.2 Vietnam Bio-Based Leather Market Estimates and Forecasts, by End-Use (2020-2032) (USD Million)

9.4.8 Singapore

9.4.8.1 Singapore Bio-Based Leather Market Estimates and Forecasts, by Source (2020-2032) (USD Million)

9.4.8.2 Singapore Bio-Based Leather Market Estimates and Forecasts, by End-Use (2020-2032) (USD Million)

9.4.9 Australia

9.4.9.1 Australia Bio-Based Leather Market Estimates and Forecasts, by Source (2020-2032) (USD Million)

9.4.9.2 Australia Bio-Based Leather Market Estimates and Forecasts, by End-Use (2020-2032) (USD Million)

9.4.10 Rest of Asia Pacific

9.4.10.1 Rest of Asia Pacific Bio-Based Leather Market Estimates and Forecasts, by Source (2020-2032) (USD Million)

9.4.10.2 Rest of Asia Pacific Bio-Based Leather Market Estimates and Forecasts, by End-Use (2020-2032) (USD Million)

9.5 Middle East and Africa

9.5.1 Middle East

9.5.1.1 Trends Analysis

9.5.1.2 Middle East Bio-Based Leather Market Estimates and Forecasts, by Country (2020-2032) (USD Million)

9.5.1.3 Middle East Bio-Based Leather Market Estimates and Forecasts, by Source (2020-2032) (USD Million) 

9.5.1.4 Middle East Bio-Based Leather Market Estimates and Forecasts, by End-Use (2020-2032) (USD Million)

9.5.1.5 UAE

9.5.1.5.1 UAE Bio-Based Leather Market Estimates and Forecasts, by Source (2020-2032) (USD Million)

9.5.1.5.2 UAE Bio-Based Leather Market Estimates and Forecasts, by End-Use (2020-2032) (USD Million)

9.5.1.6 Egypt

9.5.1.6.1 Egypt Bio-Based Leather Market Estimates and Forecasts, by Source (2020-2032) (USD Million)

9.5.1.6.2 Egypt Bio-Based Leather Market Estimates and Forecasts, by End-Use (2020-2032) (USD Million)

9.5.1.7 Saudi Arabia

9.5.1.7.1 Saudi Arabia Bio-Based Leather Market Estimates and Forecasts, by Source (2020-2032) (USD Million)

9.5.1.7.2 Saudi Arabia Bio-Based Leather Market Estimates and Forecasts, by End-Use (2020-2032) (USD Million)

9.5.1.8 Qatar

9.5.1.8.1 Qatar Bio-Based Leather Market Estimates and Forecasts, by Source (2020-2032) (USD Million)

9.5.1.8.2 Qatar Bio-Based Leather Market Estimates and Forecasts, by End-Use (2020-2032) (USD Million)

9.5.1.9 Rest of Middle East

9.5.1.9.1 Rest of Middle East Bio-Based Leather Market Estimates and Forecasts, by Source (2020-2032) (USD Million)

9.5.1.9.2 Rest of Middle East Bio-Based Leather Market Estimates and Forecasts, by End-Use (2020-2032) (USD Million)

9.5.2 Africa

9.5.2.1 Trends Analysis

9.5.2.2 Africa Bio-Based Leather Market Estimates and Forecasts, by Country (2020-2032) (USD Million)

9.5.2.3 Africa Bio-Based Leather Market Estimates and Forecasts, by Source (2020-2032) (USD Million) 

9.5.2.4 Africa Bio-Based Leather Market Estimates and Forecasts, by End-Use (2020-2032) (USD Million)

9.5.2.5 South Africa

9.5.2.5.1 South Africa Bio-Based Leather Market Estimates and Forecasts, by Source (2020-2032) (USD Million)

9.5.2.5.2 South Africa Bio-Based Leather Market Estimates and Forecasts, by End-Use (2020-2032) (USD Million)

9.5.2.6 Nigeria

9.5.2.6.1 Nigeria Bio-Based Leather Market Estimates and Forecasts, by Source (2020-2032) (USD Million)

9.5.2.6.2 Nigeria Bio-Based Leather Market Estimates and Forecasts, by End-Use (2020-2032) (USD Million)

9.5.2.7 Rest of Africa

9.5.2.7.1 Rest of Africa Bio-Based Leather Market Estimates and Forecasts, by Source (2020-2032) (USD Million)

9.5.2.7.2 Rest of Africa Bio-Based Leather Market Estimates and Forecasts, by End-Use (2020-2032) (USD Million)

9.6 Latin America

9.6.1 Trends Analysis

9.6.2 Latin America Bio-Based Leather Market Estimates and Forecasts, by Country (2020-2032) (USD Million)

9.6.3 Latin America Bio-Based Leather Market Estimates and Forecasts, by Source (2020-2032) (USD Million) 

9.6.4 Latin America Bio-Based Leather Market Estimates and Forecasts, by End-Use (2020-2032) (USD Million)

9.6.5 Brazil

9.6.5.1 Brazil Bio-Based Leather Market Estimates and Forecasts, by Source (2020-2032) (USD Million)

9.6.5.2 Brazil Bio-Based Leather Market Estimates and Forecasts, by End-Use (2020-2032) (USD Million)

9.6.6 Argentina

9.6.6.1 Argentina Bio-Based Leather Market Estimates and Forecasts, by Source (2020-2032) (USD Million)

9.6.6.2 Argentina Bio-Based Leather Market Estimates and Forecasts, by End-Use (2020-2032) (USD Million)

9.6.7 Colombia

9.6.7.1 Colombia Bio-Based Leather Market Estimates and Forecasts, by Source (2020-2032) (USD Million)

9.6.7.2 Colombia Bio-Based Leather Market Estimates and Forecasts, by End-Use (2020-2032) (USD Million)

9.6.8 Rest of Latin America

9.6.8.1 Rest of Latin America Bio-Based Leather Market Estimates and Forecasts, by Source (2020-2032) (USD Million)

9.6.8.2 Rest of Latin America Bio-Based Leather Market Estimates and Forecasts, by End-Use (2020-2032) (USD Million)

10. Company Profiles

10.1 Natural Fiber Welding Inc.

10.1.1 Company Overview

10.1.2 Financial

10.1.3 Products/ Services Offered

110.1.4 SWOT Analysis

10.2 Ananas Anam Ltd.

10.2.1 Company Overview

10.2.2 Financial

10.2.3 Products/ Services Offered

10.2.4 SWOT Analysis

10.3 Toray Industries Inc.

10.3.1 Company Overview

10.3.2 Financial

10.3.3 Products/ Services Offered

10.3.4 SWOT Analysis

10.4 Bolt Threads Inc.

10.4.1 Company Overview

10.4.2 Financial

10.4.3 Products/ Services Offered

10.4.4 SWOT Analysis

10.5 Modern Meadows

10.5.1 Company Overview

10.5.2 Financial

10.5.3 Products/ Services Offered

10.5.4 SWOT Analysis

10.6 ECCO Leather

10.6.1 Company Overview

10.6.2 Financial

10.6.3 Products/ Services Offered

10.6.4 SWOT Analysis

10.7 Nat-2

10.7.1 Company Overview

10.7.2 Financial

10.7.3 Products/ Services Offered

10.7.4 SWOT Analysis

10.8 MycoWorks

10.8.1 Company Overview

10.8.2 Financial

10.8.3 Products/ Services Offered

10.8.4 SWOT Analysis

10.9 VEGEA

10.9.1 Company Overview

10.9.2 Financial

10.9.3 Products/ Services Offered

10.9.4 SWOT Analysis

10.10 Fruitleather Rotterdam

             10.9.1 Company Overview

10.9.2 Financial

10.9.3 Products/ Services Offered

10.9.4 SWOT Analysis

10.11 Ultrafabrics

             10.11.1 Company Overview

10.11.2 Financial

10.11.3 Products/ Services Offered

10.11.4 SWOT Analysis

10.12 Tjeerd Veenhoven studio

             10.12.1 Company Overview

10.12.2 Financial

10.12.3 Products/ Services Offered

10.12.4 SWOT Analysis

11. Use Cases and Best Practices

12. Conclusion

An accurate research report requires proper strategizing as well as implementation. There are multiple factors involved in the completion of good and accurate research report and selecting the best methodology to compete the research is the toughest part. Since the research reports we provide play a crucial role in any company’s decision-making process, therefore we at SNS Insider always believe that we should choose the best method which gives us results closer to reality. This allows us to reach at a stage wherein we can provide our clients best and accurate investment to output ratio.

Each report that we prepare takes a timeframe of 350-400 business hours for production. Starting from the selection of titles through a couple of in-depth brain storming session to the final QC process before uploading our titles on our website we dedicate around 350 working hours. The titles are selected based on their current market cap and the foreseen CAGR and growth.


The 5 steps process:

Step 1: Secondary Research:

Secondary Research or Desk Research is as the name suggests is a research process wherein, we collect data through the readily available information. In this process we use various paid and unpaid databases which our team has access to and gather data through the same. This includes examining of listed companies’ annual reports, Journals, SEC filling etc. Apart from this our team has access to various associations across the globe across different industries. Lastly, we have exchange relationships with various university as well as individual libraries.

Secondary Research

Step 2: Primary Research

When we talk about primary research, it is a type of study in which the researchers collect relevant data samples directly, rather than relying on previously collected data.  This type of research is focused on gaining content specific facts that can be sued to solve specific problems. Since the collected data is fresh and first hand therefore it makes the study more accurate and genuine.

We at SNS Insider have divided Primary Research into 2 parts.

Part 1 wherein we interview the KOLs of major players as well as the upcoming ones across various geographic regions. This allows us to have their view over the market scenario and acts as an important tool to come closer to the accurate market numbers. As many as 45 paid and unpaid primary interviews are taken from both the demand and supply side of the industry to make sure we land at an accurate judgement and analysis of the market.

This step involves the triangulation of data wherein our team analyses the interview transcripts, online survey responses and observation of on filed participants. The below mentioned chart should give a better understanding of the part 1 of the primary interview.

Primary Research

Part 2: In this part of primary research the data collected via secondary research and the part 1 of the primary research is validated with the interviews from individual consultants and subject matter experts.

Consultants are those set of people who have at least 12 years of experience and expertise within the industry whereas Subject Matter Experts are those with at least 15 years of experience behind their back within the same space. The data with the help of two main processes i.e., FGDs (Focused Group Discussions) and IDs (Individual Discussions). This gives us a 3rd party nonbiased primary view of the market scenario making it a more dependable one while collation of the data pointers.

Step 3: Data Bank Validation

Once all the information is collected via primary and secondary sources, we run that information for data validation. At our intelligence centre our research heads track a lot of information related to the market which includes the quarterly reports, the daily stock prices, and other relevant information. Our data bank server gets updated every fortnight and that is how the information which we collected using our primary and secondary information is revalidated in real time.

Data Bank Validation

Step 4: QA/QC Process

After all the data collection and validation our team does a final level of quality check and quality assurance to get rid of any unwanted or undesired mistakes. This might include but not limited to getting rid of the any typos, duplication of numbers or missing of any important information. The people involved in this process include technical content writers, research heads and graphics people. Once this process is completed the title gets uploader on our platform for our clients to read it.

Step 5: Final QC/QA Process:

This is the last process and comes when the client has ordered the study. In this process a final QA/QC is done before the study is emailed to the client. Since we believe in giving our clients a good experience of our research studies, therefore, to make sure that we do not lack at our end in any way humanly possible we do a final round of quality check and then dispatch the study to the client.

Key Segments:

By Source

  • Mushroom

  • Pineapple

  • Cork

  • Apple

  • Tree bark

  • Leftover Fruits

  • Cactus

  • Others

By End-Use

  • Automotive

  • Footwear

  • Garments & Accessories

  • Furniture

  • Others

Request for Segment Customization as per your Business Requirement: Segment Customization Request

Regional Coverage:

North America

  • US

  • Canada

  • Mexico

Europe

  • Eastern Europe

    • Poland

    • Romania

    • Hungary

    • Turkey

    • Rest of Eastern Europe

  • Western Europe

    • Germany

    • France

    • UK

    • Italy

    • Spain

    • Netherlands

    • Switzerland

    • Austria

    • Rest of Western Europe

Asia Pacific

  • China

  • India

  • Japan

  • South Korea

  • Vietnam

  • Singapore

  • Australia

  • Rest of Asia Pacific

Middle East & Africa

  • Middle East

    • UAE

    • Egypt

    • Saudi Arabia

    • Qatar

    • Rest of Middle East

  • Africa

    • Nigeria

    • South Africa

    • Rest of Africa

Latin America

  • Brazil

  • Argentina

  • Colombia

  • Rest of Latin America

Request for Country Level Research Report: Country Level Customization Request

Available Customization

  • With the given market data, SNS Insider offers customization as per the company’s specific needs. The following customization options are available for the report:

  • Product Analysis

  • Criss-Cross segment analysis (e.g. Product X Application)

  • Product Matrix which gives a detailed comparison of product portfolio of each company

  • Geographic Analysis

  • Additional countries in any of the regions

  • Company Information

  • Detailed analysis and profiling of additional market players (Up to five)


  •            5000 (33% Discount)


  •            8950 (40% Discount)


  •            3050 (23% Discount)

Start a Conversation

Hi! Click one of our member below to chat on Phone