Bio Butadiene Market Size & Trends:
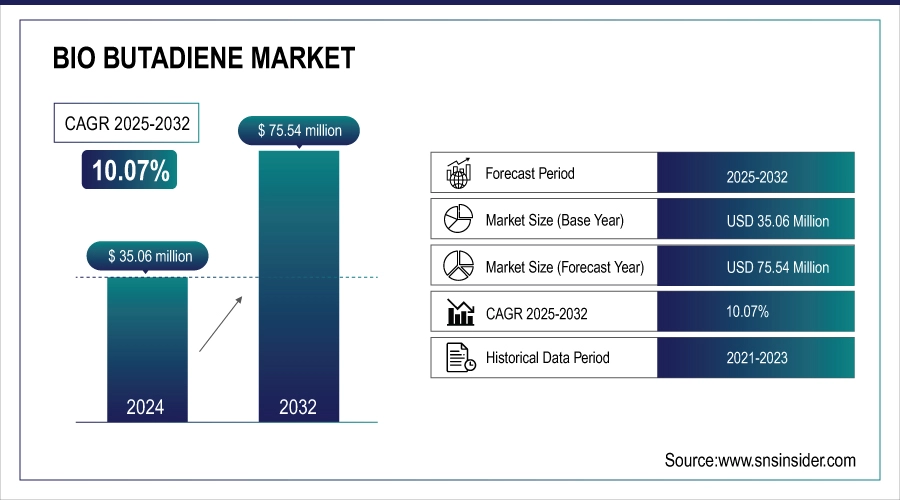
The Bio Butadiene Market Size was valued at USD 35.06 Million in 2024 and is expected to reach USD 75.54 Million by 2032, growing at a CAGR of 10.07% over the forecast period of 2025-2032.
Increasing demand for sustainable and eco-friendly products is driving the Bio Butadiene market analysis as there is a preference for sustainable and eco-friendly materials among manufacturers and consumers, owing to growing consciousness about the environmental issues associated with petrochemical-based products. Sectors including automotive, plastics, and construction are gradually substituting petro-based butadiene for bio-based varieties in the spirit of carbon footprint reduction and in response to global sustainability goals. Bio-butadiene, isolable from renewable feedstocks, such as ethanol and biomass, provides an environmentally friendly alternative that does not sacrifice end-use performance, making it an important candidate for use in synthetic rubber, polymers, and adhesives, which drive the bio butadiene market growth.
Bio Butadiene Market Size and Forecast
-
Market Size in 2024: USD 35.06 Million
-
Market Size by 2032: USD 75.54 Million
-
CAGR: 10.07% from 2025 to 2032
-
Base Year: 2024
-
Forecast Period: 2025–2032
-
Historical Data: 2021–2023
To Get more information On Bio Butadiene Market - Request Free Sample Report
Bio Butadiene Market Trends
-
Rising demand for sustainable and eco-friendly materials across automotive, plastics, and construction industries.
-
Increasing adoption of bio-based feedstocks, such as ethanol and biomass, to reduce carbon footprint.
-
Growing use of bio-butadiene in tires and automotive components, including electric and hybrid vehicles.
-
Government incentives and funding programs supporting bio-based chemical production and R&D.
-
Technological advancements in ethanol-based catalytic processes and fermentation routes improving efficiency and scalability.
-
Expansion in high-performance polymers like styrene-butadiene rubber (SBR) and bio-based ABS for durable, eco-friendly applications.
-
Regulatory pressures encouraging adoption of greener alternatives to petrochemical-based butadiene.
-
Rapid regional growth in Europe, North America, and Asia-Pacific driven by industrial investments and renewable material initiatives.
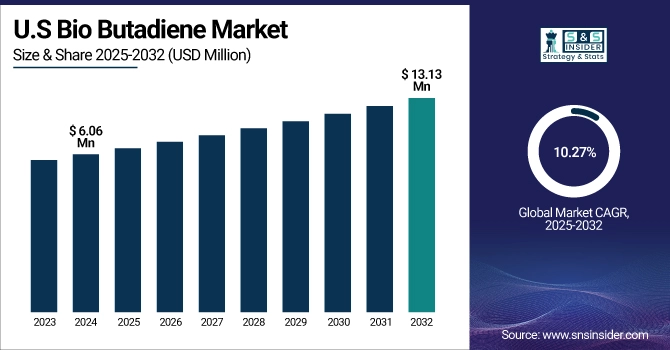
The U.S. Bio Butadiene market size was USD 6.06million in 2024 and is expected to reach USD 13.13 million by 2032 and grow at a CAGR of 10.27% over the forecast period of 2025-2032. The U.S. has also been encouraging the application of bio-butadiene through incentive policies and cooperation between the government and industry. Federal and state efforts have funded work in renewable chemical manufacturing and the creation of sustainable supply chains. Government agencies are collaborating with private companies to increase the scale of bio-butadiene production and diminish the dependency on fossil fuels. Such attempts are anticipated to add competitiveness to U.S. bio-butadiene in the international market.
The U.S. Department of Energy’s Bioenergy Technologies Office (BETO) recently announced that it will be funding up to USD 23 million in grants to support the development of biofuel and biomaterials from renewable resources. The effort will help to strengthen the domestic supply chain, create jobs, and position the American biotechnology and biomanufacturing industries to be more competitive on the global stage.
Bio Butadiene Market Growth Drivers:
-
Expansion of the Automotive and Tire Industry Drives the Market Growth
Rising automotive and tire industry is a key driver for bio-butadiene market as bio-butadiene based synthetic rubber is now used more for tire production. Amid the global momentum around sustainable vehicles and green materials, car manufacturers are exploring substitutes to petrochemical-based materials in a bid to lower their carbon emissions. For instance, some of the largest U.S. tire makers are putting bio-butadiene into high-performance tires, in response to both regulations and consumer desires for more environmentally friendly products. The increasing demand for electric and hybrid vehicles continues to drive this trend as bio-based synthetic rubber is in line with the sustainability objectives of vehicle manufacturers and contributes to the transition to greener manufacturing.
Bio Butadiene Market Restraints:
-
High Production Costs May Hamper the Market Growth
The bio-butadiene is still more expensive than the traditional petrochemical butadiene, which is due to the cost of feedstock and the more advanced bioprocessing technologies. The requirement for tailored catalysts and fermentation processes increases operational costs and prevents large-scale exploitation, in particular in the case of commodity chemicals. For instance, smaller manufacturers may find it hard to scale up, which limits expansion in the industry even as demand for sustainable alternatives grows.
Bio Butadiene Market Opportunities:
-
Government Incentives and Funding Programs Create an Opportunity for the Market
Government subsidies are a colossal opportunity offered by the bio-butadiene market. The U.S. Department of Energy’s Bioenergy Technologies Office (BETO) has offered up to USD 23 million in funding to produce domestic biofuels and chemicals from biomass and waste using new efficiency-driven industrial processes. This scheme is not only another shot in the arm to R&D toward bio-butadiene, but also incentivises companies to scale up plants and choose eco-friendly process technology. These initiatives offer an enabling environment for market stakeholders to expand their operations and tap the potential opportunities in bio-based synthetic rubber and polymer applications, which drive the bio butadiene market trends.
Bio Butadiene Market Segmentation Analysis
By Product Type
Styrene-Butadiene Rubber (SBR) is the major type with a share of about 40% due to the good performance of SBR in abrasion resistance, hardness, and workability, among other things, and it is widely used in the tire field and other rubber products. Field SBR is widely used in tire tread, conveyor belts, and other industrial rubber sheets. The demand is supported by the trend of the automotive industry toward high-performance tires. Biobased ABS is experiencing high demand as bio-based ABS provides eco-friendly, lightweight, and impact-resistant materials, which are used in automotive, electronics, and consumer goods, among others.
By Production Process
The Ethanol-Based Catalytic Process accounts for 56.4% of the market share for its scalability and mature supply chains of ethanol, as well as cost advantages, dumb it the desirable approach for industrial production. Experimental bio-routes, such as yeast fermentation are developing quickly as they cut down on environmental burden, provide higher efficiency, and require certain investment rates in new sustainability production technologies.
By Source
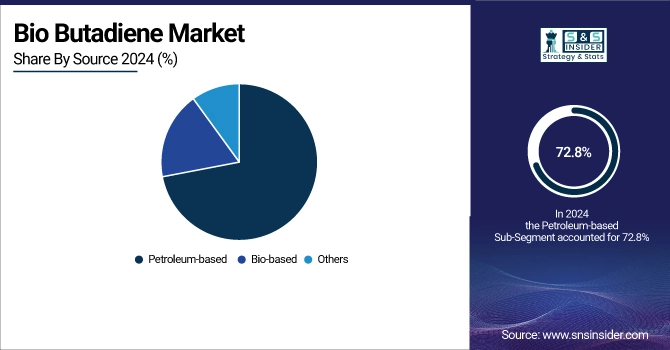
The petro-based butadiene still dominates with a 72.8% share due to its mature infrastructure, predictability, and lower short-term costs of production. Bio-based butadiene is the fastest-growing type owing to the increasingly stringent environmental regulations, corporate targets for sustainability, and consumer preference for bio-based materials from fossil to bio-based methods.
By Application
Tires & Auto Parts is the leading segment, fueled by the rising eco-friendly tire and synthetic rubber demand from high-end vehicles, leading to long-term consumption. Adhesives & Sealants is the fastest growing application as there is a growing demand in the construction and industrial sectors for sustainable, bio-based materials to comply with environmental regulations while improving performance in coatings and adhesives.
Bio Butadiene Market Regional Analysis:
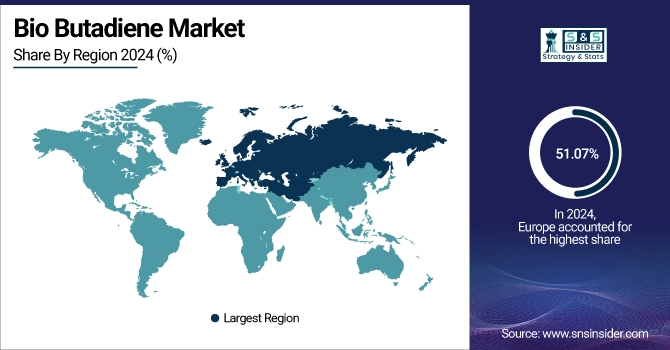
Europe held the largest Bio Butadiene Market Share in 2024, around 51.07% 2024 owing to strict environmental rules, combined with the large production of automobiles. Germany and France are among the countries at the vanguard, rolling out policies to encourage the use of materials that can be grown and replaced in the manufacturing process. The European Union’s Green Deal and Circular Economy Action Plan are among the policies that have prompted businesses to consider greener options, such as bio-based chemicals. This regulatory backing and environmentally safe consumer profile have placed Europe at the helm of the bio-butadiene market.
Get Customized Report as per Your Business Requirement - Enquiry Now
The North America region is the fastest-growing market. It is driven by technological developments and robust chemical production infrastructure, and is witnessing significant gains. Recent advances also illustrated potential research and development investments to improve the performance of bio-butadiene processes. The search for alternate feedstocks and more efficient catalytic methods has been pursued by companies to lower the overall cost and increase the yield. These developments should push the growth of bio-butadiene in the region and provide a viable alternative to conventional petrochemical products.
The bio-butadiene market in the Asia Pacific region is growing at a fast pace, mainly driven by industrialization and the rising need for eco-friendly products. Countries, such as China and India are taking the lead, investing heavily in the production of bio-based chemicals. Growing use of bio-butadiene to comply with the increasingly strict environmental regulations for the sector domestically and internationally is expected for the automotive and manufacturing sectors. Government support and a rising middle-class population are also driving demand for eco-friendly products, paving the road for the Asia Pacific to gain the majority of the share in the global bio-butadiene market.
Bio Butadiene Market Key Players:
Major bio butadienes companies are SABIC, Michelin, Zeon Corporation, Biokemik, ETB Catalytic Technologies, Trinseo, Genomatica, Braskem, Versalis, Synthos, Lummus Technology, INVISTA, LanzaTech, IFPEN, Global Bioenergies, Evonik Industries, Axens, Reliance Industries, Borealis AG, and TotalEnergies.
Recent Development in the Bio Butadiene Market
-
In January 2024, Michelin, in collaboration with IFP Energies Nouvelles (IFPEN) and Axens, inaugurated the first industrial-scale demonstration plant for producing bio-based butadiene at Michelin’s site in Bassens, near Bordeaux, France.
-
In July 2025, Zeon Corporation commenced the construction of a demonstration plant in Japan to produce bio-based butadiene. This initiative is part of Zeon's strategy to diversify its product portfolio and meet the increasing demand for sustainable materials in the automotive and rubber industries.
| Report Attributes | Details |
|---|---|
| Market Size in 2024 | USD35.06 Million |
| Market Size by 2032 | USD 75.54 Million |
| CAGR | CAGR of 10.07% From 2025 to 2032 |
| Base Year | 2024 |
| Forecast Period | 2025-2032 |
| Historical Data | 2021-2023 |
| Report Scope & Coverage | Market Size, Segments Analysis, Competitive Landscape, Regional Analysis, DROC & SWOT Analysis, Forecast Outlook |
| Key Segments | • By Product Type: Styrene-Butadiene Rubber, Polybutadiene Rubber, Acrylonitrile-Butadiene Styrene, Others (NBR, latex, specialty derivatives) • By Production Process: Steam Cracking, Ethanol-based Catalytic Process, Others (extractive distillation, experimental bio-routes, hybrid pathways) • By Source: Petroleum-based, Bio-based, Others (partially bio-based blends, recycled chemical feedstocks) • By Application: Tires & Automotive Components, Plastics & Polymers, Adhesives & Sealants, Others (industrial rubber goods, coatings, specialty resins) |
| Regional Analysis/Coverage | North America (US, Canada), Europe (Germany, France, UK, Italy, Spain, Poland, Russsia, Rest of Europe), Asia Pacific (China, India, Japan, South Korea, Australia,ASEAN Countries, Rest of Asia Pacific), Middle East & Africa (UAE, Saudi Arabia, Qatar, Egypt, South Africa, Rest of Middle East & Africa), Latin America (Brazil, Argentina, Mexico, Colombia Rest of Latin America) |
| Company Profiles | SABIC, Michelin, Zeon Corporation, Biokemik, ETB Catalytic Technologies, Trinseo, Genomatica, Braskem, Versalis, Synthos, Lummus Technology, INVISTA, LanzaTech, IFPEN, Global Bioenergies, Evonik Industries, Axens, Reliance Industries, Borealis AG, TotalEnergies |
Frequently Asked Questions
Ans It serves as a key raw material for producing synthetic rubber like SBR, ABS, and polybutadiene, supporting eco-friendly tire and polymer production.
Ans Ethanol-based catalytic processes, yeast fermentation, and other bio-based production methods.
Ans Michelin, Genomatica, Zeon Corporation, SABIC, LyondellBasell, and Clariant.
Ans Europe, North America, and the Asia Pacific lead the global bio-butadiene market.
Ans Rising demand for sustainable and eco-friendly materials in the automotive, tire, and polymer industries.
Get in Touch
