Antistatic Agents Market Report Scope & Overview:
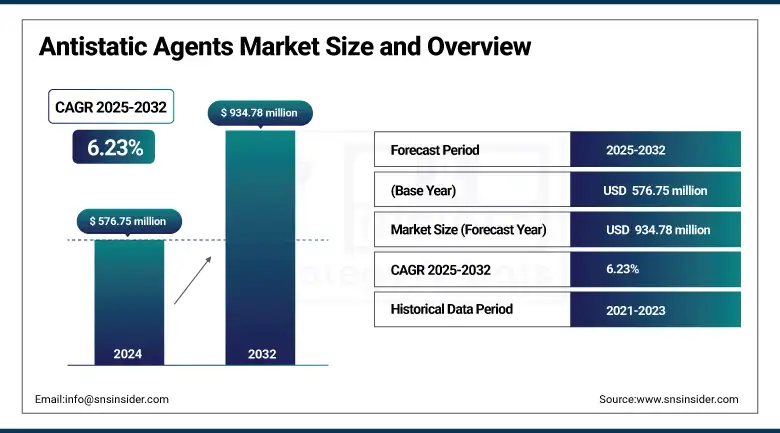
The Antistatic Agents market size was valued at USD 576.75 million in 2024 and is expected to reach USD 934.78 million by 2032, growing at a CAGR of 6.23% over the forecast period of 2025-2032.
The antistatic agents market is likely to be growing at a steady pace on the back of growing utilization of antistatic agents in packaging, electronics, and automotive industries. Rise in demand for eco-friendly alternatives has widened the permanent antistatic agent market whereas multifunctional additives have widened the market scope of antistatic agent. UV and antibacterial antistatic coatings are at the heart of today's antistatic agents market trends. Key players are investing in bio-degradable, silane based chemistries to grow their antistatic agents market share & antistatic agents market size.
To Get more information On Antistatic Agents Market - Request Free Sample Report
Evonik reports that its AEROXIDE fumed alumina, which at a concentration of 0.1% decreases powder static, for a safer work process. In a 2023 tie-up with Nanotech Energy, BASF is calculating its recycled content cathode materials will reduce CO₂ emissions per battery by 25% versus lithium-ion batteries today. Smart Effects are Evonik’s first integrated launch under the Evonik brand name, combining 3,500 employees working to promote specialty surface technologies, supported by the latest antistatic agents market analysis and innovation.
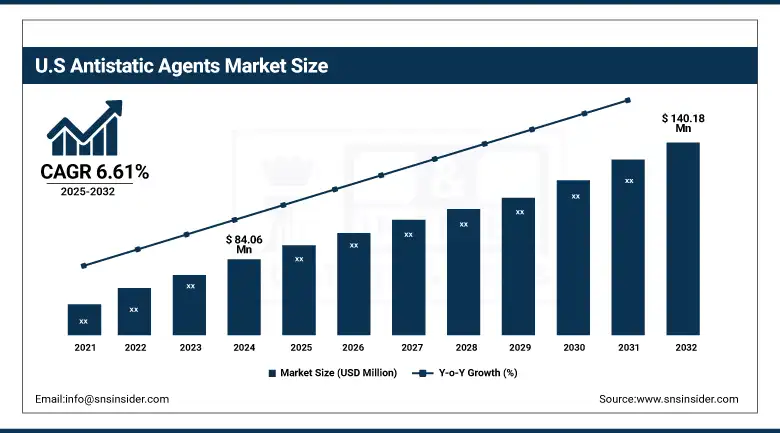
The U.S. leads the market with USD 84.06 million in 2024 and USD 140.18 million in 2032 with a market share of 58.3% and CAGR of 6.61% during the forecast period of 2025 to 2032. The region’s growth is propelled by strong demand in electronics manufacturing, packaging, and the automotive sectors. The Federal Communications Commission (FCC) reports rapid expansion of broadband infrastructure, fueling antistatic coatings in telecom equipment. Leading Antistatic Agents Companies are investing heavily to meet FDA regulations on static control in food packaging. The region benefits from robust R&D activities and increasing adoption of permanent antistatic agent market solutions, driving sustained antistatic agent market growth.
Market Dynamics:
Drivers:
-
Surge in advanced technology product exports increases antistatic agent demand worldwide
The world trade of advanced technology products is propelling the market for antistatic agents, as electronic companies, medical systems developers, and precision equipment manufacturers look for dependable ESD protection.
-
In May 2024, U.S. exports of advanced technology products were $37.4 billion, a 7.1% year-over-year increase, according to the U.S. Census Bureau. This uptick in turn promotes the growth of the antistatic agents market by expanding the antistatic agents market reach in new regions and applications.
Leading antistatic agents companies are shifting towards high end permanent antistatic agent industry solutions in the form of silane-based solutions providing durable protection. These developments are consistent with changing antistatic agents market trends which focus on integrated capabilities of functionality and resilience in manufacturing the high-end product.
-
Expansion of high-speed broadband connections fuels demand for antistatic coatings
Rising expenditure on 5G infrastructure and fiber optic networks is fueling growth in the market for antistatic agents.
-
As of June 2024, 55.8% of U.S. fixed broadband connections provide speeds of 100 Mbps or over, according to the Federal Communications Commission. This expansion is driving up the demand for antistatic coatings that safeguard delicate electronic parts employed in data centers, routers, and telecommunication centers.
The antistatic agents market analysis now offers potential for conductive materials, which is latest in the world, and responsive to the consumer and industry demands. These advances are pegged as major facilitators in driving growth of the antistatic agents market in the near future, thereby extending the permanent antistatic agent market on the basis of applications including electronics and data communication.
Restraints:
-
Low plastic recycling rates impede circular usage of antistatic-treated polymer materials
Despite increasing interest for sustainable measures, the closed-loop utilization of antistatic-treated polymers is still low.
-
The U.S. Environmental Protection Agency reported that in 2018, only 8.7% of plastic municipal solid waste which does not include industrial, hazardous or construction waste was recycled, with most of the rest being incinerated or landfilled.
It makes the recycling process difficult because of anti-static coatings that needs to be further separated or treated. This burden limits the space for the antistatic agents market as these may not be used in packaging applications where recyclability is in focus. Contrastingly, most permanent antistatic agent market is underdeveloped in regions with stringent sustainability policies which will curtail antistatic agents market growth through closed-loop systems trends.
Segmentation Analysis:
By Product
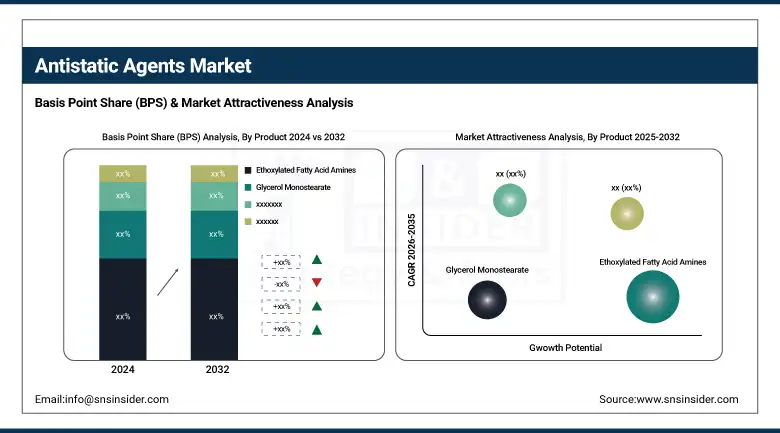
Ethoxylated fatty acid amines dominated the antistatic agents market in 2024 with a market share of 41.2%. Due to their highly compatible nature with polyolefins and stable dispersion characteristics, they are extensively used in the packaging and electronics industries. In a product bulletin from Separol 140M, as well as from Clariant, it is stated that their success in controlling the static build-up has been vital for the high-speed production speeds, allowing high speeds running that saved on down-time and defects in the moldings.
Glycerol monostearate is the fastest-growing product in the forecast period of 2025 to 2032, with a CAGR of 6.58%. It is in demand due to its food-grade and biodegradable advantages, more notably in flexible packaging. The USDA’s BioPreferred Program has designated several glycerol monostearate formulations, providing an additional catalyst for their use in sustainable packaging initiatives. This product’s dual-role as an internal and external antistatic agent means it can be used in more applications, increasing demand across polypropylene production applications and also in consumer goods injection moulding.
By Form
Liquid antistatic agents dominated and held the largest market share in 2024 at approximately 47.6%. These agents are preferred because they are readily dispersible, highly effective and have low viscosities, which makes they suitable for spray coatings and film applications. The U.S. Environmental Protection Agency (EPA) approves the liquid-type low-VOC antistatic coating technology in accordance with green chemistry principles and encourages this application in cleanroom and ESD-sensitive manufacturing settings, and especially in semiconductor assembly plants and precision electronics products.
Powder-based antistatic agents are the fastest growing in the forecast period of 2025 to 2032 with a CAGR of 6.5%. Their burgeoning use for polymer compounding and production of master batches, have made them imperative for dry blending technology. The powder agents offer precise dosing, long shelf stability, and compatibility with thermoplastic materials. According to the United States OSHA (Occupational Safety and Health Administration), powders and dusts have handling guidelines for safe use in the workplace which has resulted in manufacturers working to provide cleaner, dust-free powdered antistatic blends to meet safety and performance requirements for manufacturing.
By Polymer
Polypropylene led the antistatic agents market in 2024 with a market share of 34.7%. Its dominance is derived from its wide range of use in injection molding, automotive parts and flexible packaging. Polypropylene is still the most processed thermoplastic in the country, according to the US Census Bureau’s industry data for 2023. Antistatic additives in polypropylene contribute to anti-dust build up and reduced surface friction, key considerations for both packaging lines and medical device casings, hence being the polymer of choice.
Polyvinyl chloride (PVC) is the fastest-growing polymer segment in the forecast period of 2025 to 2032, recording a CAGR of 7.04%. This trend is being led by higher usage in cables, flooring, and consumer electronics, where static dissipation is vital. As outlined in U.S. Consumer Product Safety Commission (CPSC), safer antistatic PVC applications are recommended in child safe and flame-retardant materials. Such regulatory pressures are likely to popularize high-performance antistatic coatings in PVC compositions, specifically in data centers and smart homes.
By End-use
The packaging industry dominated the antistatic agents market in 2024 with a market share of 29.4%. Rigorous global packaging regulations particularly by the U.S. Food and Drug Administration (FDA) necessitates the application of antistatic coatings on food and pharmaceutical packaging to maintain the products` integrity. Static accumulation can also attract dust leading to a sealed pack which is not completely clean; as a result, producers are turning to permanent antistatic agent market options, particularly for BOPP and PE films. The need for cleaner packing lines also feeds this trend.
Electronics is the fastest growing end-use segment in the forecast period of 2025 to 2032, with a CAGR of 6.75%. In the U.S, more than 60% of households had gigabit broadband in mid-2024, driving production of static-sensitive components such as semiconductors and connectors. This rise demands higher performance antistatic for circuit board packaging and display panel films. Antistatic coatings are a must-have in the manufacturing atmosphere against Electrostatic discharge (ESD), and this technology is more important now than ever before for both OEMs and component manufacturers serving the electronics market.
Regional Analysis:
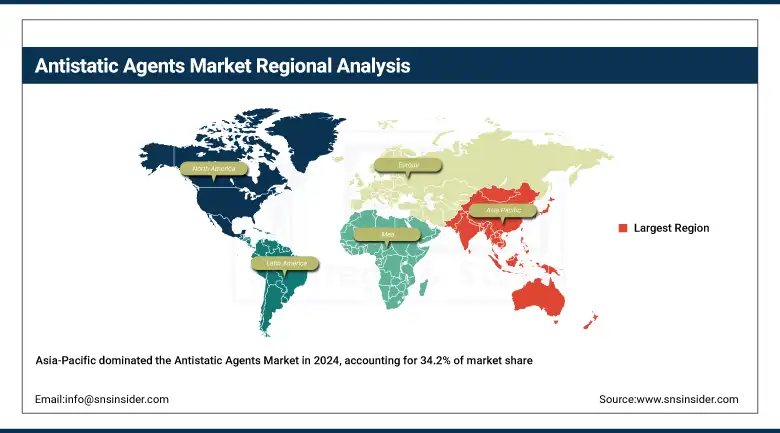
Asia Pacific is the dominating region with a 34.2% antistatic agents market share, fueled by rapid industrialization and electronics manufacturing. China’s “Made in China 2025” initiative prioritizes antistatic film use in semiconductors and solar panels. India’s growing consumer electronics sector drives demand for antistatic coatings, supported by government incentives for clean energy. South Korea leads innovation in conductive textiles integrated with antistatic agents. This region’s expanding antistatic agents market scope and increasing export activities position it as a global leader in both production and consumption of antistatic solutions.
Get Customized Report as per Your Business Requirement - Enquiry Now
North America is the second dominating region with a 25.00% market share and is the fastest growing region with a CAGR of 6.70%.
Europe holds the third-largest antistatic agents market share at 20.1%, supported by stringent regulations and sustainability trends. The European Chemicals Agency (ECHA) mandates antistatic properties in polymers used for food and pharmaceutical packaging, enhancing demand. Germany’s automotive industry increasingly employs antistatic coatings for electric vehicle batteries to improve safety and durability. French and Italian companies lead in developing eco-friendly antistatic coatings. This regulatory environment, combined with technological innovation, promotes steady antistatic agents market growth and expansion in permanent antistatic agent market applications across the continent.
Key Players:
The major antistatic agents market competitors include BASF SE, Evonik Industries AG, Clariant AG, Croda International Plc, Arkema S.A., 3M, Kao Corporation, Ampacet Corporation, ADEKA Corporation, and Solvay S.A.
Recent Developments:
-
In September 2024, Evonik launched biodegradable biosurfactants Tego® Wet 570 Terra and 580 Terra, enhancing sustainable surface treatments for industrial use, aligning with the rising demand for eco-friendly chemical additives.
-
In April 2024, BASF unveiled an innovative, lightweight solid-state battery pack at Chinaplas 2024, focusing on thermal management and recyclability, advancing sustainable materials for electric mobility and next-gen energy storage solutions.
| Report Attributes | Details |
|---|---|
| Market Size in 2024 | USD 576.75 million |
| Market Size by 2032 | USD 934.78 million |
| CAGR | CAGR of 6.23% From 2025 to 2032 |
| Base Year | 2024 |
| Forecast Period | 2025-2032 |
| Historical Data | 2021-2023 |
| Report Scope & Coverage | Market Size, Segments Analysis, Competitive Landscape, Regional Analysis, DROC & SWOT Analysis, Forecast Outlook |
| Key Segments | •By Product (Glycerol Monostearate, Ethoxylated Fatty Acid Amines, Diethanolamides, Others) •By Form (Liquid, Powder, Others) •By Polymer (Polypropylene (PP), Polyethylene (PE), Polyvinyl Chloride (PVC), Acrylonitrile Butadiene Styrene (ABS), Others) •By End-use (Packaging, Automotive, Electronics, Textile, Others) |
| Regional Analysis/Coverage | North America (US, Canada, Mexico), Europe (Germany, France, UK, Italy, Spain, Poland, Turkey, Rest of Europe), Asia Pacific (China, India, Japan, South Korea, Singapore, Australia, Rest of Asia Pacific), Middle East & Africa (UAE, Saudi Arabia, Qatar, South Africa, Rest of Middle East & Africa), Latin America (Brazil, Argentina, Rest of Latin America) |
| Company Profiles | BASF SE, Evonik Industries AG, Clariant AG, Croda International Plc, Arkema S.A., 3M, Kao Corporation, Ampacet Corporation, ADEKA Corporation, and Solvay S.A. |
Frequently Asked Questions
The Antistatic Agents Market growth is driven by rising demand in packaging, electronics, and automotive sectors, with increasing adoption of eco-friendly permanent antistatic solutions and multifunctional additives.
Glycerol monostearate is the fastest-growing product segment in the Antistatic Agents Market, preferred for its biodegradable nature and use in sustainable flexible packaging.
Asia Pacific leads the Antistatic Agents Market, followed by North America and Europe, driven by rapid industrialization, technological innovation, and stringent regulatory environments.
Leading Antistatic Agents Companies include BASF SE, Evonik Industries AG, Clariant AG, Croda International Plc, and Arkema S.A., investing in R&D and market expansion.
Antistatic coatings protect sensitive electronic components from electrostatic discharge, essential in data centers and semiconductor production, boosting the Antistatic Agents Market growth.
Get in Touch
