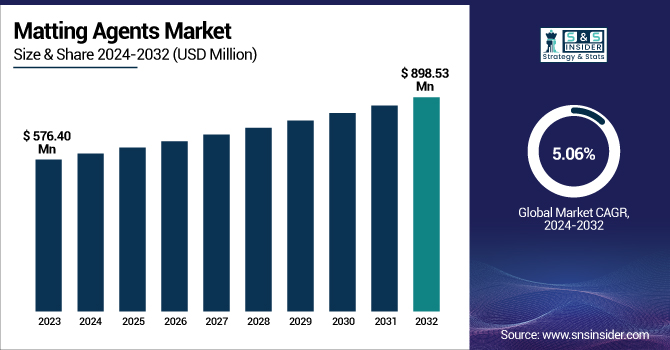
The Matting Agents Market Size was valued at USD 576.40 Million in 2023 and is expected to reach USD 898.53 Million by 2032, growing at a CAGR of 5.06% over the forecast period of 2024-2032.
The Matting Agents Market has transformed because of some major factors propelling its growth. Consumer behavior is trending more towards green and sustainable formulations, a point we emphasize in our report. Raw material price volatility, especially that of silica, plays a critical role in shaping pricing strategy and market dynamics. Environmental policies have emerged as a major driver, pushing manufacturers to respond to tougher regulations, which in turn impact product innovation and market trends. Supply chain disruptions, like material availability and delivery lead times, have also impacted market growth, as emphasized in our analysis. Finally, our report explores how these drivers impact consumer purchasing behavior, gaining insights into preferences and purchasing behavior driving demand for Matting Agents in different industries.
The US Matting Agents Market Size was valued at USD 63.96 Million in 2023 with a market share of around 73% and growing at a significant CAGR over the forecast period of 2024-2032.
The U.S. Matting Agents Market is currently witnessing robust growth, fueled by the increasing demand for low-VOC and environmentally friendly coatings across industries like automotive, construction, and industrial manufacturing. The U.S. matting agents market is also fueled by the increasing emphasis on sustainability, as exemplified by U.S. manufacturers such as PPG Industries and Axalta Coating Systems, who are at the forefront of developing low-impact products to comply with stringent environmental regulations. The increasing awareness among consumers about environmental impact, along with regulatory changes and the support of organizations such as the American Coatings Association (ACA), also contribute to propelling market growth. The increasing application of waterborne coatings also contributes to propelling the demand for effective matting agents in the U.S. market.
Drivers
Surging Demand for Customizable Aesthetic Finishes in High-End Consumer Goods and Luxury Packaging
Consumer preferences are rapidly evolving towards bespoke and luxurious aesthetics in products ranging from electronics to personal care packaging. Matting agents play a crucial role in enabling customized matte finishes that convey a premium, tactile feel. High-end cosmetic brands, tech companies, and luxury packaging designers are increasingly seeking matte finishes that resonate with minimalism, elegance, and sophistication. For instance, Apple’s use of matte coatings in product lines like the iPhone and MacBook exemplifies this demand. Similarly, luxury skincare and fragrance brands are incorporating matte-coated containers to differentiate on shelves. The versatility of matting agents allows for tailored gloss levels, texture control, and visual depth, which align with current trends in luxury branding. As consumer spending on premium goods grows, especially in developed economies, manufacturers are leveraging high-performance matting agents to deliver not just functionality but also brand-driven aesthetics, thereby driving sustained demand in this niche but lucrative market segment.
Restraints
Complex Compatibility Issues with Emerging Resin Systems in Advanced Coatings Applications
As coatings technology evolves with the introduction of novel resin chemistries and curing systems, compatibility between matting agents and these advanced materials has emerged as a challenge. Matting agents that are highly effective in conventional solventborne or waterborne coatings may not function optimally in radiation-curable or bio-based resin systems. These mismatches can lead to problems such as poor dispersion, reduced matting efficiency, or undesirable surface defects like haze or sedimentation. The increasing push toward sustainable and high-performance coatings driven by environmental mandates and consumer demand means formulators must constantly adapt. However, developing matting agents with broad compatibility requires intensive R&D and customization, which slows down innovation and increases development costs. This restraint is particularly significant in industries such as automotive refinish or industrial OEM, where surface quality and consistency are critical. Manufacturers are thus challenged to bridge the compatibility gap without compromising on performance or regulatory compliance.
Opportunities
Growing Investment in Bio-Based and Biodegradable Matting Agent Development to Address Sustainability Demands
With global sustainability goals gaining momentum, chemical manufacturers are increasingly investing in the development of bio-based and biodegradable matting agents. These green alternatives, derived from renewable sources like plant-based waxes or natural silica, offer a lower environmental footprint while maintaining functional properties such as gloss control, surface smoothness, and anti-reflective characteristics. Regulatory pressure from agencies like the United States Environmental Protection Agency and consumer-driven demand for eco-label certifications are encouraging companies to explore biodegradable solutions. For example, in the U.S., companies engaged in green chemistry innovations are receiving grants and tax incentives for sustainable product development. This trend opens up lucrative opportunities for matting agent producers to diversify their offerings and penetrate eco-conscious markets. Bio-based matting agents are gaining favor in sectors like food packaging, baby care products, and green building materials, where safety and biodegradability are essential attributes. As these sectors grow, the demand for sustainable matting solutions will accelerate significantly.
Challenge
Evolving Industry Requirements Outpacing Standardization of Matting Agent Performance Across Diverse Applications
The rapid diversification of end-use applications ranging from smart coatings to 3D printing materials has significantly outpaced the establishment of standardized performance benchmarks for matting agents. This lack of harmonized standards creates variability in how matting agents perform under different conditions, formulations, and substrates. For instance, a matting agent optimized for waterborne automotive coatings may not yield consistent results in UV-curable electronic coatings or in architectural powder coatings. This inconsistency complicates quality assurance and increases the burden on manufacturers to customize solutions for every client and industry. Moreover, small and mid-sized manufacturers often lack the R&D infrastructure to support such tailored development. The challenge is further exacerbated by varying regional standards and environmental compliance requirements, which demand constant product reformulation. This dynamic slows product development cycles, increases cost, and risks client dissatisfaction if expectations aren’t met making standardization and scalability a persistent challenge in the global matting agents market.
By Nature
In 2023, inorganic nature dominated the matting agents market with a 69.5% market share, primarily due to their superior performance in terms of thermal stability, chemical resistance, and cost-effectiveness. Inorganic types like silica and talc are extensively used in high-performance coatings such as automotive OEMs, wood finishes, and industrial applications. Major players like Evonik and PPG Industries continue to invest in inorganic matting agent R&D, particularly silica-based products, to meet the stringent demands of gloss control and mechanical durability. Moreover, industry standards issued by associations such as ASTM International often recommend inorganic additives for consistent and stable results. Additionally, government-backed building infrastructure initiatives in countries like China and Germany, which use high-performance protective coatings, have further strengthened the inorganic segment's dominance. Their adaptability across solvent borne, waterborne, and powder-based systems reinforces their widespread applicability and enduring market leadership.
Organic matting agents is the fastest growing segment, driven by escalating demand for eco-friendly and biodegradable coating solutions. These agents, often derived from renewable resources such as natural waxes or polymers, are favored in regions with strict environmental regulations, such as Europe and parts of North America. Companies like Michelman and BYK-Chemie are developing water-dispersible organic matting agents to align with green chemistry principles. Furthermore, the European Chemicals Agency (ECHA) has promoted bio-based alternatives, pushing manufacturers to innovate in the organic matting space. Organic variants are increasingly used in packaging, furniture, and cosmetics due to their non-toxic and low-VOC characteristics. Consumer preference for sustainability and regulatory bodies encouraging non-petrochemical additives are accelerating adoption. The compatibility of organic matting agents with emerging resin technologies in waterborne and radiation-curable coatings ensures strong future potential, especially in premium and sustainable product segments.
By Material
In 2023, silica-based matting agents dominated the material segment with a commanding 58% market share, owing to their consistent matting efficiency, ease of dispersion, and compatibility across various coating technologies. Silica’s microporous structure allows it to scatter light effectively, making it ideal for use in industrial coatings, architectural applications, and wood finishes. Industry leaders like W.R. Grace, Evonik, and Deuteron GmbH dominate this space by supplying highly engineered silica matting agents suited for both solvent and waterborne coatings. Regulatory support for low-VOC coatings like initiatives from the U.S. EPA’s Safer Choice program has further propelled silica use, particularly in water-based systems. Moreover, silica matting agents are increasingly used in automotive interiors and high-end electronics for their anti-glare and anti-scratch benefits. Their availability in customized particle sizes and surface treatments ensures continued preference over alternatives like waxes or thermoplastics.
Thermoplastic matting agents is the fastest growing material segment, as industries seek versatile materials that offer superior scratch resistance and surface uniformity. Thermoplastics, such as polyethylene and polypropylene-based agents, are particularly favored in plastic coatings and 3D printing materials due to their compatibility with synthetic substrates and ability to provide fine, uniform finishes. Recent innovations by players like Lubrizol and Arkema in thermoplastic dispersion systems have unlocked new applications in flexible packaging and additive manufacturing. Additionally, the surge in consumer electronics and wearable devices has intensified demand for matte finishes that are both durable and aesthetically pleasing, where thermoplastics deliver excellent results. With growing investments in 3D printing by governments, including Japan’s METI-funded programs for industrial innovation, the segment is experiencing rapid expansion. Their increasing use in advanced material processing, especially in Asia and North America, ensures this segment’s acceleration.
By Technology
Waterborne coatings dominated the technology segment in 2023, capturing a 54.5% market share, as environmental regulations worldwide are stringent around VOC emissions. Matting agents tailored for waterborne systems are widely preferred in architectural, automotive, and general industrial coatings for their low toxicity, quick drying, and superior dispersion capabilities. Organizations such as the U.S. Environmental Protection Agency and the European Chemicals Agency have promoted waterborne technologies, influencing major formulators to shift from solvent borne to more sustainable alternatives. Major coatings manufacturers like AkzoNobel, Sherwin-Williams, and Axalta have invested heavily in waterborne product lines, increasing the demand for compatible matting agents. Additionally, rapid urbanization in China and India where government mandates increasingly favor eco-friendly construction materials has bolstered adoption. As waterborne systems continue to replace traditional technologies, especially in developing economies, the demand for high-performance matting agents designed for these formulations remains robust.
Powder coating technologies is the fastest growing technology segment, driven by their environmental friendliness and superior film properties. Powder coatings, being solvent-free and low in waste, align perfectly with global sustainability targets set by organizations like the United Nations Environment Programme. Matting agents used in powder coatings are in high demand for applications requiring UV resistance, impact durability, and even gloss reduction in automotive parts, furniture, and appliances. Innovations by companies like DSM and Allnex in developing matting agents compatible with hybrid and polyester-based powder coatings have accelerated adoption. Additionally, government-funded initiatives, such as India’s “Make in India” campaign encouraging localized, low-emission manufacturing, have stimulated the shift toward powder coating. The ease of automation and recyclability of powder systems, combined with lower operational costs, support their growing appeal in both developed and emerging markets.
By Application
In 2023, architectural coatings dominated the application segment with a 30.8% market share, driven by surging residential and commercial construction activities globally. Matting agents are extensively utilized to produce low-sheen, scuff-resistant wall finishes and trims in interior and exterior architectural applications. In countries like China and the U.S., building codes now encourage low-VOC, durable coatings, boosting demand for high-performance matting agents. Manufacturers like Nippon Paint and Asian Paints offer matte interior paints enhanced with silica or wax-based matting agents that provide both aesthetic appeal and functional benefits. Government programs like the U.S. Green Building Council’s LEED certification have further incentivized low-gloss, sustainable coatings. Additionally, urban revitalization and housing schemes in countries such as India and Brazil continue to promote the use of decorative matte coatings, reinforcing the architectural segment’s leadership.
Industrial coatings is the fastest growing application segment, fueled by rising demand in machinery, transportation, and heavy-duty infrastructure applications. Matting agents in this segment help improve wear resistance, reduce glare, and maintain aesthetic consistency under harsh conditions. Rapid industrialization across Asia-Pacific and North America, including manufacturing incentives under the U.S. CHIPS and Science Act, has spurred coatings demand in machinery and electronics sectors. Companies like Jotun and Hempel have launched matte industrial coatings compatible with powder and waterborne technologies, supporting both environmental goals and surface performance. The expanding use of robotics and automation in factories also requires matte finishes to minimize optical interference, enhancing the relevance of matting agents in industrial environments. With global logistics and production hubs seeking resilient yet visually refined coatings, the industrial application segment is set to lead in growth.
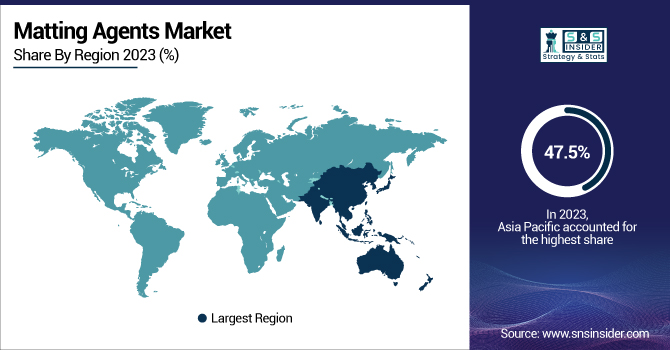
Asia Pacific dominated the matting agents market in 2023 with a 47.5% market share, owing to rapid industrialization, infrastructure expansion, and booming consumer goods sectors. China emerged as the leading contributor due to its massive construction projects, extensive electronics production, and high consumption of decorative and industrial coatings. According to China’s Ministry of Industry and Information Technology, the country led the world in coatings consumption, significantly driving matting agent demand. Additionally, government-led schemes like “New Urbanization” and the Belt and Road Initiative have amplified architectural coatings usage. India, meanwhile, was the fastest-growing country in the region, with surging demand in wood coatings, packaging, and smart devices. The Indian government's push for sustainable housing through the PMAY (Pradhan Mantri Awas Yojana) and Smart Cities Mission has catalyzed matte-finish coatings adoption. Regional demand is further supported by local production of matting agents and regulatory frameworks promoting eco-friendly products, positioning Asia Pacific as the market stronghold.
North America emerged as the fastest-growing region for matting agents, driven by rising demand for smart coatings, luxury packaging, and regulatory push toward sustainability. The United States leads this trend, supported by the Environmental Protection Agency’s ongoing initiatives to reduce VOC emissions and promote safer chemical alternatives. As per the U.S. Census Bureau, increased residential and commercial renovation activity has spurred demand for architectural and industrial coatings incorporating matting agents. Canada also contributes significantly, particularly in automotive and aerospace coatings that require matte finishes for anti-glare and aesthetic performance. Major North American manufacturers like Sherwin-Williams and PPG Industries are heavily investing in waterborne and powder coating technologies tailored for high-end matte finishes. Furthermore, rapid growth in 3D printing and consumer electronics industries enhances regional appetite for advanced matting solutions, positioning North America as the most dynamic and innovation-driven market during the forecast period.
Akzo Nobel N.V. (Interpon D, Sikkens Cetol, Resicoat)
Allnex (Additol XW 330, Additol VXW 6208, Additol VXL 4950)
Arkema S.A. (Orgasol 2002 EXD NAT 1, Orgasol 3502 D NAT 1, Coapur XS 12)
Axalta Coating Systems (Alesta, Nap-Gard, Plascoat)
BASF SE (Joncryl 8052, Joncryl 678, Efka 3777)
BYK-Chemie GmbH (ALTANA Group) (BYK-330, BYK-333, BYK-9076)
Deuteron GmbH (Deuteron MM 110, Deuteron SO 100, Deuteron SO 300)
Evonik Industries AG (Acematt TS 100, Acematt OK 412, Acematt 3300)
Huber Engineered Materials (J.M. Huber Corporation) (Pergopak M4, Pergopak M5, Pergopak M6)
Huntsman International LLC (Tioxide TR28, Tioxide TR92, Tioxide TR93)
Imerys S.A. (ImerSilk, ImerCare, ImerMat)
Lubrizol Corporation (Lanco LiquiMatt 5730, Lanco Matt 1100, Lanco LiquiMatt 6375)
Michelman, Inc. (Michem Guard 200, Michem Guard 1350, Michem Guard 7140)
PPG Industries, Inc. (Envirocron, Sigmaglide, Amercoat)
PQ Corporation (Silcron G-130, Silcron G-300, Silcron G-500)
Thomas Swan & Co. Ltd. (SwanMat 100, SwanMat 200, SwanMat 300)
Toyobo Co., Ltd. (Vylon, Esmilon, Toyoboat)
W. R. Grace & Co.-Conn. (Syloid ED3, Syloid ED5, Syloid ED7)
CHASM Advanced Materials (Nanotube Hybrid Matting Agent, CNT Matting Agent, CHASM Matting Agent)
Keim Additec Surface GmbH (Silmat 100, Silmat 200, Silmat 300)
Report Attributes | Details |
---|---|
Market Size in 2023 | USD 576.40 Million |
Market Size by 2032 | USD 898.53 Million |
CAGR | CAGR of 5.06% From 2024 to 2032 |
Base Year | 2023 |
Forecast Period | 2024-2032 |
Historical Data | 2020-2022 |
Report Scope & Coverage | Market Size, Segments Analysis, Competitive Landscape, Regional Analysis, DROC & SWOT Analysis, Forecast Outlook |
Key Segments | •By Nature (Organic, Inorganic) •By Material (Silica, Waxes, Thermoplastics, Others) •By Technology (Waterborne, Solventborne, Powder, Others) •By Application (Industrial Coatings, Wood Coatings, Leather Coatings, Architectural Coatings, Printing Inks, Others) |
Regional Analysis/Coverage | North America (US, Canada, Mexico), Europe (Eastern Europe [Poland, Romania, Hungary, Turkey, Rest of Eastern Europe] Western Europe] Germany, France, UK, Italy, Spain, Netherlands, Switzerland, Austria, Rest of Western Europe]), Asia Pacific (China, India, Japan, South Korea, Vietnam, Singapore, Australia, Rest of Asia Pacific), Middle East & Africa (Middle East [UAE, Egypt, Saudi Arabia, Qatar, Rest of Middle East], Africa [Nigeria, South Africa, Rest of Africa], Latin America (Brazil, Argentina, Colombia, Rest of Latin America) |
Company Profiles | Evonik Industries AG, BYK-Chemie GmbH (ALTANA Group), PPG Industries, Inc., Huntsman International LLC, Akzo Nobel N.V., Arkema S.A., BASF SE, The Lubrizol Corporation, Imerys S.A., J.M. Huber Corporation (Huber Engineered Materials) and other key players |
Ans: The Matting Agents Market was valued at USD 576.40 million in 2023 and is projected to grow steadily through 2032.
Ans: The Matting Agents Market is driven by increasing demand for customizable matte finishes in luxury goods, electronics, and personal care packaging.
Ans: Silica-based agents dominate the Matting Agents Market due to excellent matting efficiency, dispersion, and broad coating compatibility.
Ans: Organic matting agents are the fastest growing in the Matting Agents Market due to rising demand for biodegradable and bio-based solutions.
Ans: The U.S. Matting Agents Market held a 73% share in 2023, driven by demand for sustainable coatings in major industries.
Table of Contents
1. Introduction
1.1 Market Definition
1.2 Scope (Inclusion and Exclusions)
1.3 Research Assumptions
2. Executive Summary
2.1 Market Overview
2.2 Regional Synopsis
2.3 Competitive Summary
3. Research Methodology
3.1 Top-Down Approach
3.2 Bottom-up Approach
3.3. Data Validation
3.4 Primary Interviews
4. Market Dynamics Impact Analysis
4.1 Market Driving Factors Analysis
4.1.1 Drivers
4.1.2 Restraints
4.1.3 Opportunities
4.1.4 Challenges
4.2 PESTLE Analysis
4.3 Porter’s Five Forces Model
5. Statistical Insights and Trends Reporting
5.1 Consumer Preferences for Specific Matting Agents
5.2 Cost Trends in Raw Applications and Their Impact
5.3 Impact of Environmental Regulations on Market Trends
5.4 Supply Chain Disruptions and Their Effects on Market Growth
5.5 Consumer Buying Behavior and Preferences in Matting Agents
6. Competitive Landscape
6.1 List of Major Companies, By Region
6.2 Market Share Analysis, By Region
6.3 Product Benchmarking
6.3.1 Product specifications and features
6.3.2 Pricing
6.4 Strategic Initiatives
6.4.1 Marketing and promotional activities
6.4.2 Distribution and supply chain strategies
6.4.3 Expansion plans and new product launches
6.4.4 Strategic partnerships and collaborations
6.5 Technological Advancements
6.6 Market Positioning and Branding
7. Matting Agents Market Segmentation, by Nature
7.1 Chapter Overview
7.2 Organic
7.2.1 Organic Market Trends Analysis (2020-2032)
7.2.2 Organic Market Size Estimates and Forecasts to 2032 (USD Million)
7.3 Inorganic
7.3.1 Inorganic Market Trends Analysis (2020-2032)
7.3.2 Inorganic Market Size Estimates and Forecasts to 2032 (USD Million)
8. Matting Agents Market Segmentation, by Material
8.1 Chapter Overview
8.2 Silica
8.2.1 Silica Market Trends Analysis (2020-2032)
8.2.2 Silica Market Size Estimates and Forecasts to 2032 (USD Million)
8.3 Waxes
8.3.1 Waxes Market Trends Analysis (2020-2032)
8.3.2 Waxes Market Size Estimates and Forecasts to 2032 (USD Million)
8.4 Thermoplastics
8.4.1 Thermoplastics Market Trends Analysis (2020-2032)
8.4.2 Thermoplastics Market Size Estimates and Forecasts to 2032 (USD Million)
8.5 Others
8.5.1 Others Market Trends Analysis (2020-2032)
8.5.2 Others Market Size Estimates and Forecasts to 2032 (USD Million)
9. Matting Agents Market Segmentation, by Technology
9.1 Chapter Overview
9.2 Waterborne
9.2.1 Waterborne Market Trends Analysis (2020-2032)
9.2.2 Waterborne Market Size Estimates and Forecasts to 2032 (USD Million)
9.3 Solventborne
9.3.1 Solventborne Market Trends Analysis (2020-2032)
9.3.2 Solventborne Market Size Estimates and Forecasts to 2032 (USD Million)
9.4 Powder
9.4.1 Powder Market Trends Analysis (2020-2032)
9.4.2 Powder Market Size Estimates and Forecasts to 2032 (USD Million)
9.5 Others
9.5.1 Others Market Trends Analysis (2020-2032)
9.5.2 Others Market Size Estimates and Forecasts to 2032 (USD Million)
10. Matting Agents Market Segmentation, by Application
10.1 Chapter Overview
10.2 Industrial Coatings
10.2.1 Industrial Coatings Market Trends Analysis (2020-2032)
10.2.2 Industrial Coatings Market Size Estimates and Forecasts to 2032 (USD Million)
10.3 Wood Coatings
10.3.1 Wood Coatings Market Trends Analysis (2020-2032)
10.3.2 Wood Coatings Market Size Estimates and Forecasts to 2032 (USD Million)
10.4 Leather Coatings
10.4.1 Leather Coatings Market Trends Analysis (2020-2032)
10.4.2 Leather Coatings Market Size Estimates and Forecasts to 2032 (USD Million)
10.5 Architectural Coatings
10.5.1 Architectural Coatings Market Trends Analysis (2020-2032)
10.5.2 Architectural Coatings Market Size Estimates and Forecasts to 2032 (USD Million)
10.6 Printing Inks
10.6.1 Printing Inks Market Trends Analysis (2020-2032)
10.6.2 Printing Inks Market Size Estimates and Forecasts to 2032 (USD Million)
10.7 Others
10.7.1 Others Market Trends Analysis (2020-2032)
10.7.2 Others Market Size Estimates and Forecasts to 2032 (USD Million)
11. Regional Analysis
11.1 Chapter Overview
11.2 North America
11.2.1 Trends Analysis
11.2.2 North America Matting Agents Market Estimates and Forecasts, by Country (2020-2032) (USD Million)
11.2.3 North America Matting Agents Market Estimates and Forecasts, by Nature (2020-2032) (USD Million)
11.2.4 North America Matting Agents Market Estimates and Forecasts, by Material (2020-2032) (USD Million)
11.2.5 North America Matting Agents Market Estimates and Forecasts, by Technology (2020-2032) (USD Million)
11.2.6 North America Matting Agents Market Estimates and Forecasts, by Application (2020-2032) (USD Million)
11.2.7 USA
11.2.7.1 USA Matting Agents Market Estimates and Forecasts, by Nature (2020-2032) (USD Million)
11.2.7.2 USA Matting Agents Market Estimates and Forecasts, by Material (2020-2032) (USD Million)
11.2.7.3 USA Matting Agents Market Estimates and Forecasts, by Technology (2020-2032) (USD Million)
11.2.7.4 USA Matting Agents Market Estimates and Forecasts, by Application (2020-2032) (USD Million)
11.2.8 Canada
11.2.8.1 Canada Matting Agents Market Estimates and Forecasts, by Nature (2020-2032) (USD Million)
11.2.8.2 Canada Matting Agents Market Estimates and Forecasts, by Material (2020-2032) (USD Million)
11.2.8.3 Canada Matting Agents Market Estimates and Forecasts, by Technology (2020-2032) (USD Million)
11.2.8.4 Canada Matting Agents Market Estimates and Forecasts, by Application (2020-2032) (USD Million)
11.2.9 Mexico
11.2.9.1 Mexico Matting Agents Market Estimates and Forecasts, by Nature (2020-2032) (USD Million)
11.2.9.2 Mexico Matting Agents Market Estimates and Forecasts, by Material (2020-2032) (USD Million)
11.2.9.3 Mexico Matting Agents Market Estimates and Forecasts, by Technology (2020-2032) (USD Million)
11.2.9.4 Mexico Matting Agents Market Estimates and Forecasts, by Application (2020-2032) (USD Million)
11.3 Europe
11.3.1 Eastern Europe
11.3.1.1 Trends Analysis
11.3.1.2 Eastern Europe Matting Agents Market Estimates and Forecasts, by Country (2020-2032) (USD Million)
11.3.1.3 Eastern Europe Matting Agents Market Estimates and Forecasts, by Nature (2020-2032) (USD Million)
11.3.1.4 Eastern Europe Matting Agents Market Estimates and Forecasts, by Material (2020-2032) (USD Million)
11.3.1.5 Eastern Europe Matting Agents Market Estimates and Forecasts, by Technology (2020-2032) (USD Million)
11.3.1.6 Eastern Europe Matting Agents Market Estimates and Forecasts, by Application (2020-2032) (USD Million)
11.3.1.7 Poland
11.3.1.7.1 Poland Matting Agents Market Estimates and Forecasts, by Nature (2020-2032) (USD Million)
11.3.1.7.2 Poland Matting Agents Market Estimates and Forecasts, by Material (2020-2032) (USD Million)
11.3.1.7.3 Poland Matting Agents Market Estimates and Forecasts, by Technology (2020-2032) (USD Million)
11.3.1.7.4 Poland Matting Agents Market Estimates and Forecasts, by Application (2020-2032) (USD Million)
11.3.1.8 Romania
11.3.1.8.1 Romania Matting Agents Market Estimates and Forecasts, by Nature (2020-2032) (USD Million)
11.3.1.8.2 Romania Matting Agents Market Estimates and Forecasts, by Material (2020-2032) (USD Million)
11.3.1.8.3 Romania Matting Agents Market Estimates and Forecasts, by Technology (2020-2032) (USD Million)
11.3.1.8.4 Romania Matting Agents Market Estimates and Forecasts, by Application (2020-2032) (USD Million)
11.3.1.9 Hungary
11.3.1.9.1 Hungary Matting Agents Market Estimates and Forecasts, by Nature (2020-2032) (USD Million)
11.3.1.9.2 Hungary Matting Agents Market Estimates and Forecasts, by Material (2020-2032) (USD Million)
11.3.1.9.3 Hungary Matting Agents Market Estimates and Forecasts, by Technology (2020-2032) (USD Million)
11.3.1.9.4 Hungary Matting Agents Market Estimates and Forecasts, by Application (2020-2032) (USD Million)
11.3.1.10 Turkey
11.3.1.10.1 Turkey Matting Agents Market Estimates and Forecasts, by Nature (2020-2032) (USD Million)
11.3.1.10.2 Turkey Matting Agents Market Estimates and Forecasts, by Material (2020-2032) (USD Million)
11.3.1.10.3 Turkey Matting Agents Market Estimates and Forecasts, by Technology (2020-2032) (USD Million)
11.3.1.10.4 Turkey Matting Agents Market Estimates and Forecasts, by Application (2020-2032) (USD Million)
11.3.1.11 Rest of Eastern Europe
11.3.1.11.1 Rest of Eastern Europe Matting Agents Market Estimates and Forecasts, by Nature (2020-2032) (USD Million)
11.3.1.11.2 Rest of Eastern Europe Matting Agents Market Estimates and Forecasts, by Material (2020-2032) (USD Million)
11.3.1.11.3 Rest of Eastern Europe Matting Agents Market Estimates and Forecasts, by Technology (2020-2032) (USD Million)
11.3.1.11.4 Rest of Eastern Europe Matting Agents Market Estimates and Forecasts, by Application (2020-2032) (USD Million)
11.3.2 Western Europe
11.3.2.1 Trends Analysis
11.3.2.2 Western Europe Matting Agents Market Estimates and Forecasts, by Country (2020-2032) (USD Million)
11.3.2.3 Western Europe Matting Agents Market Estimates and Forecasts, by Nature (2020-2032) (USD Million)
11.3.2.4 Western Europe Matting Agents Market Estimates and Forecasts, by Material (2020-2032) (USD Million)
11.3.2.5 Western Europe Matting Agents Market Estimates and Forecasts, by Technology (2020-2032) (USD Million)
11.3.2.6 Western Europe Matting Agents Market Estimates and Forecasts, by Application (2020-2032) (USD Million)
11.3.2.7 Germany
11.3.2.7.1 Germany Matting Agents Market Estimates and Forecasts, by Nature (2020-2032) (USD Million)
11.3.2.7.2 Germany Matting Agents Market Estimates and Forecasts, by Material (2020-2032) (USD Million)
11.3.2.7.3 Germany Matting Agents Market Estimates and Forecasts, by Technology (2020-2032) (USD Million)
11.3.2.7.4 Germany Matting Agents Market Estimates and Forecasts, by Application (2020-2032) (USD Million)
11.3.2.8 France
11.3.2.8.1 France Matting Agents Market Estimates and Forecasts, by Nature (2020-2032) (USD Million)
11.3.2.8.2 France Matting Agents Market Estimates and Forecasts, by Material (2020-2032) (USD Million)
11.3.2.8.3 France Matting Agents Market Estimates and Forecasts, by Technology (2020-2032) (USD Million)
11.3.2.8.4 France Matting Agents Market Estimates and Forecasts, by Application (2020-2032) (USD Million)
11.3.2.9 UK
11.3.2.9.1 UK Matting Agents Market Estimates and Forecasts, by Nature (2020-2032) (USD Million)
11.3.2.9.2 UK Matting Agents Market Estimates and Forecasts, by Material (2020-2032) (USD Million)
11.3.2.9.3 UK Matting Agents Market Estimates and Forecasts, by Technology (2020-2032) (USD Million)
11.3.2.9.4 UK Matting Agents Market Estimates and Forecasts, by Application (2020-2032) (USD Million)
11.3.2.10 Italy
11.3.2.10.1 Italy Matting Agents Market Estimates and Forecasts, by Nature (2020-2032) (USD Million)
11.3.2.10.2 Italy Matting Agents Market Estimates and Forecasts, by Material (2020-2032) (USD Million)
11.3.2.10.3 Italy Matting Agents Market Estimates and Forecasts, by Technology (2020-2032) (USD Million)
11.3.2.10.4 Italy Matting Agents Market Estimates and Forecasts, by Application (2020-2032) (USD Million)
11.3.2.11 Spain
11.3.2.11.1 Spain Matting Agents Market Estimates and Forecasts, by Nature (2020-2032) (USD Million)
11.3.2.11.2 Spain Matting Agents Market Estimates and Forecasts, by Material (2020-2032) (USD Million)
11.3.2.11.3 Spain Matting Agents Market Estimates and Forecasts, by Technology (2020-2032) (USD Million)
11.3.2.11.4 Spain Matting Agents Market Estimates and Forecasts, by Application (2020-2032) (USD Million)
11.3.2.12 Netherlands
11.3.2.12.1 Netherlands Matting Agents Market Estimates and Forecasts, by Nature (2020-2032) (USD Million)
11.3.2.12.2 Netherlands Matting Agents Market Estimates and Forecasts, by Material (2020-2032) (USD Million)
11.3.2.12.3 Netherlands Matting Agents Market Estimates and Forecasts, by Technology (2020-2032) (USD Million)
11.3.2.12.4 Netherlands Matting Agents Market Estimates and Forecasts, by Application (2020-2032) (USD Million)
11.3.2.13 Switzerland
11.3.2.13.1 Switzerland Matting Agents Market Estimates and Forecasts, by Nature (2020-2032) (USD Million)
11.3.2.13.2 Switzerland Matting Agents Market Estimates and Forecasts, by Material (2020-2032) (USD Million)
11.3.2.13.3 Switzerland Matting Agents Market Estimates and Forecasts, by Technology (2020-2032) (USD Million)
11.3.2.13.4 Switzerland Matting Agents Market Estimates and Forecasts, by Application (2020-2032) (USD Million)
11.3.2.14 Austria
11.3.2.14.1 Austria Matting Agents Market Estimates and Forecasts, by Nature (2020-2032) (USD Million)
11.3.2.14.2 Austria Matting Agents Market Estimates and Forecasts, by Material (2020-2032) (USD Million)
11.3.2.14.3 Austria Matting Agents Market Estimates and Forecasts, by Technology (2020-2032) (USD Million)
11.3.2.14.4 Austria Matting Agents Market Estimates and Forecasts, by Application (2020-2032) (USD Million)
11.3.2.15 Rest of Western Europe
11.3.2.15.1 Rest of Western Europe Matting Agents Market Estimates and Forecasts, by Nature (2020-2032) (USD Million)
11.3.2.15.2 Rest of Western Europe Matting Agents Market Estimates and Forecasts, by Material (2020-2032) (USD Million)
11.3.2.15.3 Rest of Western Europe Matting Agents Market Estimates and Forecasts, by Technology (2020-2032) (USD Million)
11.3.2.15.4 Rest of Western Europe Matting Agents Market Estimates and Forecasts, by Application (2020-2032) (USD Million)
11.4 Asia Pacific
11.4.1 Trends Analysis
11.4.2 Asia Pacific Matting Agents Market Estimates and Forecasts, by Country (2020-2032) (USD Million)
11.4.3 Asia Pacific Matting Agents Market Estimates and Forecasts, by Nature (2020-2032) (USD Million)
11.4.4 Asia Pacific Matting Agents Market Estimates and Forecasts, by Material (2020-2032) (USD Million)
11.4.5 Asia Pacific Matting Agents Market Estimates and Forecasts, by Technology (2020-2032) (USD Million)
11.4.6 Asia Pacific Matting Agents Market Estimates and Forecasts, by Application (2020-2032) (USD Million)
11.4.7 China
11.4.7.1 China Matting Agents Market Estimates and Forecasts, by Nature (2020-2032) (USD Million)
11.4.7.2 China Matting Agents Market Estimates and Forecasts, by Material (2020-2032) (USD Million)
11.4.7.3 China Matting Agents Market Estimates and Forecasts, by Technology (2020-2032) (USD Million)
11.4.7.4 China Matting Agents Market Estimates and Forecasts, by Application (2020-2032) (USD Million)
11.4.8 India
11.4.8.1 India Matting Agents Market Estimates and Forecasts, by Nature (2020-2032) (USD Million)
11.4.8.2 India Matting Agents Market Estimates and Forecasts, by Material (2020-2032) (USD Million)
11.4.8.3 India Matting Agents Market Estimates and Forecasts, by Technology (2020-2032) (USD Million)
11.4.8.4 India Matting Agents Market Estimates and Forecasts, by Application (2020-2032) (USD Million)
11.4.9 Japan
11.4.9.1 Japan Matting Agents Market Estimates and Forecasts, by Nature (2020-2032) (USD Million)
11.4.9.2 Japan Matting Agents Market Estimates and Forecasts, by Material (2020-2032) (USD Million)
11.4.9.3 Japan Matting Agents Market Estimates and Forecasts, by Technology (2020-2032) (USD Million)
11.4.9.4 Japan Matting Agents Market Estimates and Forecasts, by Application (2020-2032) (USD Million)
11.4.10 South Korea
11.4.10.1 South Korea Matting Agents Market Estimates and Forecasts, by Nature (2020-2032) (USD Million)
11.4.10.2 South Korea Matting Agents Market Estimates and Forecasts, by Material (2020-2032) (USD Million)
11.4.10.3 South Korea Matting Agents Market Estimates and Forecasts, by Technology (2020-2032) (USD Million)
11.4.10.4 South Korea Matting Agents Market Estimates and Forecasts, by Application (2020-2032) (USD Million)
11.4.11 Vietnam
11.4.11.1 Vietnam Matting Agents Market Estimates and Forecasts, by Nature (2020-2032) (USD Million)
11.4.11.2 Vietnam Matting Agents Market Estimates and Forecasts, by Material (2020-2032) (USD Million)
11.4.11.3 Vietnam Matting Agents Market Estimates and Forecasts, by Technology (2020-2032) (USD Million)
11.4.11.4 Vietnam Matting Agents Market Estimates and Forecasts, by Application (2020-2032) (USD Million)
11.4.12 Singapore
11.4.12.1 Singapore Matting Agents Market Estimates and Forecasts, by Nature (2020-2032) (USD Million)
11.4.12.2 Singapore Matting Agents Market Estimates and Forecasts, by Material (2020-2032) (USD Million)
11.4.12.3 Singapore Matting Agents Market Estimates and Forecasts, by Technology (2020-2032) (USD Million)
11.4.12.4 Singapore Matting Agents Market Estimates and Forecasts, by Application (2020-2032) (USD Million)
11.4.13 Australia
11.4.13.1 Australia Matting Agents Market Estimates and Forecasts, by Nature (2020-2032) (USD Million)
11.4.13.2 Australia Matting Agents Market Estimates and Forecasts, by Material (2020-2032) (USD Million)
11.4.13.3 Australia Matting Agents Market Estimates and Forecasts, by Technology (2020-2032) (USD Million)
11.4.13.4 Australia Matting Agents Market Estimates and Forecasts, by Application (2020-2032) (USD Million)
11.4.14 Rest of Asia Pacific
11.4.14.1 Rest of Asia Pacific Matting Agents Market Estimates and Forecasts, by Nature (2020-2032) (USD Million)
11.4.14.2 Rest of Asia Pacific Matting Agents Market Estimates and Forecasts, by Material (2020-2032) (USD Million)
11.4.14.3 Rest of Asia Pacific Matting Agents Market Estimates and Forecasts, by Technology (2020-2032) (USD Million)
11.4.14.4 Rest of Asia Pacific Matting Agents Market Estimates and Forecasts, by Application (2020-2032) (USD Million)
11.5 Middle East and Africa
11.5.1 Middle East
11.5.1.1 Trends Analysis
11.5.1.2 Middle East Matting Agents Market Estimates and Forecasts, by Country (2020-2032) (USD Million)
11.5.1.3 Middle East Matting Agents Market Estimates and Forecasts, by Nature (2020-2032) (USD Million)
11.5.1.4 Middle East Matting Agents Market Estimates and Forecasts, by Material (2020-2032) (USD Million)
11.5.1.5 Middle East Matting Agents Market Estimates and Forecasts, by Technology (2020-2032) (USD Million)
11.5.1.6 Middle East Matting Agents Market Estimates and Forecasts, by Application (2020-2032) (USD Million)
11.5.1.7 UAE
11.5.1.7.1 UAE Matting Agents Market Estimates and Forecasts, by Nature (2020-2032) (USD Million)
11.5.1.7.2 UAE Matting Agents Market Estimates and Forecasts, by Material (2020-2032) (USD Million)
11.5.1.7.3 UAE Matting Agents Market Estimates and Forecasts, by Technology (2020-2032) (USD Million)
11.5.1.7.4 UAE Matting Agents Market Estimates and Forecasts, by Application (2020-2032) (USD Million)
11.5.1.8 Egypt
11.5.1.8.1 Egypt Matting Agents Market Estimates and Forecasts, by Nature (2020-2032) (USD Million)
11.5.1.8.2 Egypt Matting Agents Market Estimates and Forecasts, by Material (2020-2032) (USD Million)
11.5.1.8.3 Egypt Matting Agents Market Estimates and Forecasts, by Technology (2020-2032) (USD Million)
11.5.1.8.4 Egypt Matting Agents Market Estimates and Forecasts, by Application (2020-2032) (USD Million)
11.5.1.9 Saudi Arabia
11.5.1.9.1 Saudi Arabia Matting Agents Market Estimates and Forecasts, by Nature (2020-2032) (USD Million)
11.5.1.9.2 Saudi Arabia Matting Agents Market Estimates and Forecasts, by Material (2020-2032) (USD Million)
11.5.1.9.3 Saudi Arabia Matting Agents Market Estimates and Forecasts, by Technology (2020-2032) (USD Million)
11.5.1.9.4 Saudi Arabia Matting Agents Market Estimates and Forecasts, by Application (2020-2032) (USD Million)
11.5.1.10 Qatar
11.5.1.10.1 Qatar Matting Agents Market Estimates and Forecasts, by Nature (2020-2032) (USD Million)
11.5.1.10.2 Qatar Matting Agents Market Estimates and Forecasts, by Material (2020-2032) (USD Million)
11.5.1.10.3 Qatar Matting Agents Market Estimates and Forecasts, by Technology (2020-2032) (USD Million)
11.5.1.10.4 Qatar Matting Agents Market Estimates and Forecasts, by Application (2020-2032) (USD Million)
11.5.1.11 Rest of Middle East
11.5.1.11.1 Rest of Middle East Matting Agents Market Estimates and Forecasts, by Nature (2020-2032) (USD Million)
11.5.1.11.2 Rest of Middle East Matting Agents Market Estimates and Forecasts, by Material (2020-2032) (USD Million)
11.5.1.11.3 Rest of Middle East Matting Agents Market Estimates and Forecasts, by Technology (2020-2032) (USD Million)
11.5.1.11.4 Rest of Middle East Matting Agents Market Estimates and Forecasts, by Application (2020-2032) (USD Million)
11.5.2 Africa
11.5.2.1 Trends Analysis
11.5.2.2 Africa Matting Agents Market Estimates and Forecasts, by Country (2020-2032) (USD Million)
11.5.2.3 Africa Matting Agents Market Estimates and Forecasts, by Nature (2020-2032) (USD Million)
11.5.2.4 Africa Matting Agents Market Estimates and Forecasts, by Material (2020-2032) (USD Million)
11.5.2.5 Africa Matting Agents Market Estimates and Forecasts, by Technology (2020-2032) (USD Million)
11.5.2.6 Africa Matting Agents Market Estimates and Forecasts, by Application (2020-2032) (USD Million)
11.5.2.7 South Africa
11.5.2.7.1 South Africa Matting Agents Market Estimates and Forecasts, by Nature (2020-2032) (USD Million)
11.5.2.7.2 South Africa Matting Agents Market Estimates and Forecasts, by Material (2020-2032) (USD Million)
11.5.2.7.3 South Africa Matting Agents Market Estimates and Forecasts, by Technology (2020-2032) (USD Million)
11.5.2.7.4 South Africa Matting Agents Market Estimates and Forecasts, by Application (2020-2032) (USD Million)
11.5.2.8 Nigeria
11.5.2.8.1 Nigeria Matting Agents Market Estimates and Forecasts, by Nature (2020-2032) (USD Million)
11.5.2.8.2 Nigeria Matting Agents Market Estimates and Forecasts, by Material (2020-2032) (USD Million)
11.5.2.8.3 Nigeria Matting Agents Market Estimates and Forecasts, by Technology (2020-2032) (USD Million)
11.5.2.8.4 Nigeria Matting Agents Market Estimates and Forecasts, by Application (2020-2032) (USD Million)
11.5.2.9 Rest of Africa
11.5.2.9.1 Rest of Africa Matting Agents Market Estimates and Forecasts, by Nature (2020-2032) (USD Million)
11.5.2.9.2 Rest of Africa Matting Agents Market Estimates and Forecasts, by Material (2020-2032) (USD Million)
11.5.2.9.3 Rest of Africa Matting Agents Market Estimates and Forecasts, by Technology (2020-2032) (USD Million)
11.5.2.9.4 Rest of Africa Matting Agents Market Estimates and Forecasts, by Application (2020-2032) (USD Million)
11.6 Latin America
11.6.1 Trends Analysis
11.6.2 Latin America Matting Agents Market Estimates and Forecasts, by Country (2020-2032) (USD Million)
11.6.3 Latin America Matting Agents Market Estimates and Forecasts, by Nature (2020-2032) (USD Million)
11.6.4 Latin America Matting Agents Market Estimates and Forecasts, by Material (2020-2032) (USD Million)
11.6.5 Latin America Matting Agents Market Estimates and Forecasts, by Technology (2020-2032) (USD Million)
11.6.6 Latin America Matting Agents Market Estimates and Forecasts, by Application (2020-2032) (USD Million)
11.6.7 Brazil
11.6.7.1 Brazil Matting Agents Market Estimates and Forecasts, by Nature (2020-2032) (USD Million)
11.6.7.2 Brazil Matting Agents Market Estimates and Forecasts, by Material (2020-2032) (USD Million)
11.6.7.3 Brazil Matting Agents Market Estimates and Forecasts, by Technology (2020-2032) (USD Million)
11.6.7.4 Brazil Matting Agents Market Estimates and Forecasts, by Application (2020-2032) (USD Million)
11.6.8 Argentina
11.6.8.1 Argentina Matting Agents Market Estimates and Forecasts, by Nature (2020-2032) (USD Million)
11.6.8.2 Argentina Matting Agents Market Estimates and Forecasts, by Material (2020-2032) (USD Million)
11.6.8.3 Argentina Matting Agents Market Estimates and Forecasts, by Technology (2020-2032) (USD Million)
11.6.8.4 Argentina Matting Agents Market Estimates and Forecasts, by Application (2020-2032) (USD Million)
11.6.9 Colombia
11.6.9.1 Colombia Matting Agents Market Estimates and Forecasts, by Nature (2020-2032) (USD Million)
11.6.9.2 Colombia Matting Agents Market Estimates and Forecasts, by Material (2020-2032) (USD Million)
11.6.9.3 Colombia Matting Agents Market Estimates and Forecasts, by Technology (2020-2032) (USD Million)
11.6.9.4 Colombia Matting Agents Market Estimates and Forecasts, by Application (2020-2032) (USD Million)
11.6.10 Rest of Latin America
11.6.10.1 Rest of Latin America Matting Agents Market Estimates and Forecasts, by Nature (2020-2032) (USD Million)
11.6.10.2 Rest of Latin America Matting Agents Market Estimates and Forecasts, by Material (2020-2032) (USD Million)
11.6.10.3 Rest of Latin America Matting Agents Market Estimates and Forecasts, by Technology (2020-2032) (USD Million)
11.6.10.4 Rest of Latin America Matting Agents Market Estimates and Forecasts, by Application (2020-2032) (USD Million)
12. Company Profiles
12.1 Evonik Industries AG
12.1.1 Company Overview
12.1.2 Financial
12.1.3 Products/ Services Offered
12.1.4 SWOT Analysis
12.2 BYK-Chemie GmbH (ALTANA Group)
12.2.1 Company Overview
12.2.2 Financial
12.2.3 Products/ Services Offered
12.2.4 SWOT Analysis
12.3 PPG Industries, Inc.
12.3.1 Company Overview
12.3.2 Financial
12.3.3 Products/ Services Offered
12.3.4 SWOT Analysis
12.4 Huntsman International LLC
12.4.1 Company Overview
12.4.2 Financial
12.4.3 Products/ Services Offered
12.4.4 SWOT Analysis
12.5 Akzo Nobel N.V.
12.5.1 Company Overview
12.5.2 Financial
12.5.3 Products/ Services Offered
12.5.4 SWOT Analysis
12.6 Arkema S.A.
12.6.1 Company Overview
12.6.2 Financial
12.6.3 Products/ Services Offered
12.6.4 SWOT Analysis
12.7 BASF SE
12.7.1 Company Overview
12.7.2 Financial
12.7.3 Products/ Services Offered
12.7.4 SWOT Analysis
12.8 The Lubrizol Corporation
12.8.1 Company Overview
12.8.2 Financial
12.8.3 Products/ Services Offered
12.8.4 SWOT Analysis
12.9 Imerys S.A.
12.9.1 Company Overview
12.9.2 Financial
12.9.3 Products/ Services Offered
12.9.4 SWOT Analysis
12.10 J.M. Huber Corporation (Huber Engineered Materials)
12.10.1 Company Overview
12.10.2 Financial
12.10.3 Products/ Services Offered
12.10.4 SWOT Analysis
13. Use Cases and Best Practices
14. Conclusion
An accurate research report requires proper strategizing as well as implementation. There are multiple factors involved in the completion of good and accurate research report and selecting the best methodology to compete the research is the toughest part. Since the research reports we provide play a crucial role in any company’s decision-making process, therefore we at SNS Insider always believe that we should choose the best method which gives us results closer to reality. This allows us to reach at a stage wherein we can provide our clients best and accurate investment to output ratio.
Each report that we prepare takes a timeframe of 350-400 business hours for production. Starting from the selection of titles through a couple of in-depth brain storming session to the final QC process before uploading our titles on our website we dedicate around 350 working hours. The titles are selected based on their current market cap and the foreseen CAGR and growth.
The 5 steps process:
Step 1: Secondary Research:
Secondary Research or Desk Research is as the name suggests is a research process wherein, we collect data through the readily available information. In this process we use various paid and unpaid databases which our team has access to and gather data through the same. This includes examining of listed companies’ annual reports, Journals, SEC filling etc. Apart from this our team has access to various associations across the globe across different industries. Lastly, we have exchange relationships with various university as well as individual libraries.
Step 2: Primary Research
When we talk about primary research, it is a type of study in which the researchers collect relevant data samples directly, rather than relying on previously collected data. This type of research is focused on gaining content specific facts that can be sued to solve specific problems. Since the collected data is fresh and first hand therefore it makes the study more accurate and genuine.
We at SNS Insider have divided Primary Research into 2 parts.
Part 1 wherein we interview the KOLs of major players as well as the upcoming ones across various geographic regions. This allows us to have their view over the market scenario and acts as an important tool to come closer to the accurate market numbers. As many as 45 paid and unpaid primary interviews are taken from both the demand and supply side of the industry to make sure we land at an accurate judgement and analysis of the market.
This step involves the triangulation of data wherein our team analyses the interview transcripts, online survey responses and observation of on filed participants. The below mentioned chart should give a better understanding of the part 1 of the primary interview.
Part 2: In this part of primary research the data collected via secondary research and the part 1 of the primary research is validated with the interviews from individual consultants and subject matter experts.
Consultants are those set of people who have at least 12 years of experience and expertise within the industry whereas Subject Matter Experts are those with at least 15 years of experience behind their back within the same space. The data with the help of two main processes i.e., FGDs (Focused Group Discussions) and IDs (Individual Discussions). This gives us a 3rd party nonbiased primary view of the market scenario making it a more dependable one while collation of the data pointers.
Step 3: Data Bank Validation
Once all the information is collected via primary and secondary sources, we run that information for data validation. At our intelligence centre our research heads track a lot of information related to the market which includes the quarterly reports, the daily stock prices, and other relevant information. Our data bank server gets updated every fortnight and that is how the information which we collected using our primary and secondary information is revalidated in real time.
Step 4: QA/QC Process
After all the data collection and validation our team does a final level of quality check and quality assurance to get rid of any unwanted or undesired mistakes. This might include but not limited to getting rid of the any typos, duplication of numbers or missing of any important information. The people involved in this process include technical content writers, research heads and graphics people. Once this process is completed the title gets uploader on our platform for our clients to read it.
Step 5: Final QC/QA Process:
This is the last process and comes when the client has ordered the study. In this process a final QA/QC is done before the study is emailed to the client. Since we believe in giving our clients a good experience of our research studies, therefore, to make sure that we do not lack at our end in any way humanly possible we do a final round of quality check and then dispatch the study to the client.
Key Segments:
By Nature
Organic
Inorganic
By Material
Silica
Waxes
Thermoplastics
Others
By Technology
Waterborne
Solventborne
Powder
Others
By Application
Industrial Coatings
Wood Coatings
Leather Coatings
Architectural Coatings
Printing Inks
Others
Request for Segment Customization as per your Business Requirement: Segment Customization Request
Regional Coverage:
North America
US
Canada
Mexico
Europe
Eastern Europe
Poland
Romania
Hungary
Turkey
Rest of Eastern Europe
Western Europe
Germany
France
UK
Italy
Spain
Netherlands
Switzerland
Austria
Rest of Western Europe
Asia Pacific
China
India
Japan
South Korea
Vietnam
Singapore
Australia
Rest of Asia Pacific
Middle East & Africa
Middle East
UAE
Egypt
Saudi Arabia
Qatar
Rest of Middle East
Africa
Nigeria
South Africa
Rest of Africa
Latin America
Brazil
Argentina
Colombia
Rest of Latin America
Request for Country Level Research Report: Country Level Customization Request
Available Customization
With the given market data, SNS Insider offers customization as per the company’s specific needs. The following customization options are available for the report:
Detailed Volume Analysis
Criss-Cross segment analysis (e.g. Product X Application)
Competitive Product Benchmarking
Geographic Analysis
Additional countries in any of the regions
Customized Data Representation
Detailed analysis and profiling of additional market players
The Latex Binders Market size was USD 7.6 billion in 2023 and is expected to reach USD 13.3 billion by 2032 and grow at a CAGR of 6.5% over the forecast period of 2024-2032.
The Ortho Phthalaldehyde Market size was valued at USD 5.83 billion in 2023. It is expected to grow to USD 9.25 billion by 2032 and grow at a CAGR of 5.26% over the forecast period of 2024-2032.
The sulfur pastilles market size was worth USD 1.30 billion in 2024 and is expected to reach USD 1.82 billion by 2032 growing at a CAGR of 4.26% over the forecast period of 2025-2032.
Chelating Agents Market size was USD 6.36 billion in 2023 and is expected to reach USD 9.19 billion by 2032, at a CAGR of 4.16% from 2024 to 2032.
Aramid Fiber Market was USD 4.4 billion in 2023 and is expected to reach USD 9.6 billion by 2032, growing at a CAGR of 9.1% from 2024 to 2032.
The Biocomposites Market was valued at USD 32.59 billion in 2023 and is supposed to reach USD 122.22 billion by 2032. It is expected to grow at a CAGR of 15.8% over the forecast period 2024-2032.
Hi! Click one of our member below to chat on Phone