Carbon-negative Plastics Market Report Scope & Overview:
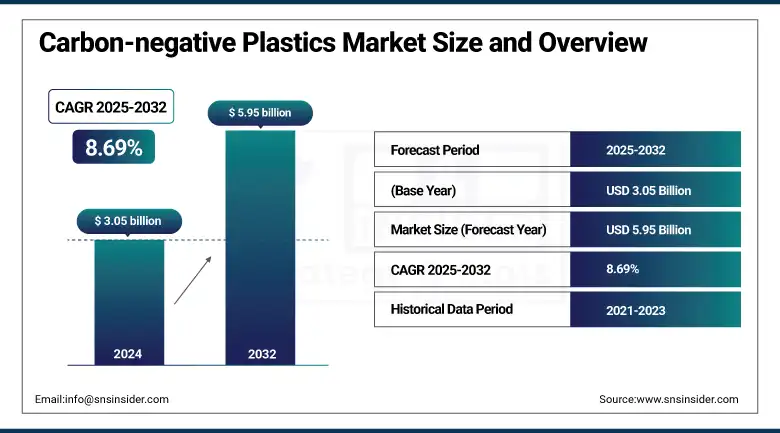
The Carbon-negative Plastics Market Size was valued at USD 3.05 billion in 2024 and is expected to reach USD 5.95 billion by 2032 and grow at a CAGR of 8.69% over the forecast period of 2025-2032.
Carbon-negative Plastics market analysis shows that the increasing regulatory pressure to limit carbon emissions associated with traditional manufacture of plastic is driving the market growth. Increasingly stringent environmental legislation, such as carbon pricing, bans on single-use plastic items, and mandatory reporting on emissions, is driving industries toward more sustainable options. Carbon-negative plastics, either sequestering more carbon during their lifetime than they release or manufactured via carbon-neutral means, are becoming an attractive option to satisfy these mandates. Accordingly, manufacturers are making investments in new technologies and more sustainable feedstocks to keep pace with ever-tightening compliance requirements and environmental objectives. This action, which aligns with a wide set of actions to mitigate climate change, would place carbon-negative plastics as a strategic material for low-carbon futures, which drive the carbon-negative plastics market growth.
To Get more information On Carbon-negative Plastics Market - Request Free Sample Report
In July 2024, the U.S. administration announced, it will phase out single‑use plastics for federal operations by 2035, including a procurement ban by 2027, a planned USD 275 million federal investment in recycling infrastructure, and rules to address plastic chemical emissions from the EPA.
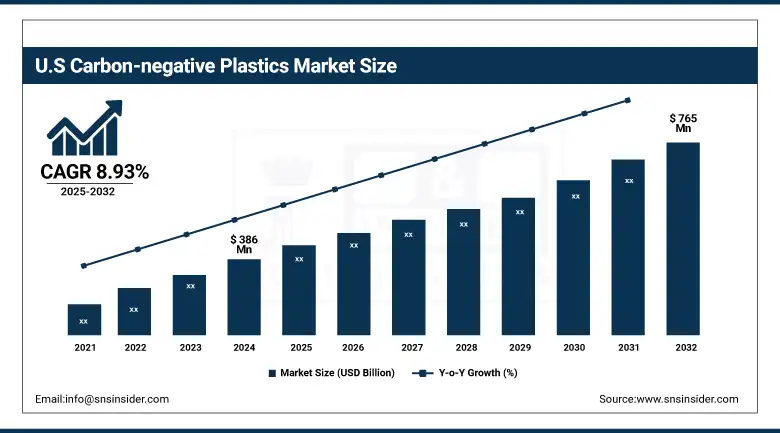
The U.S Carbon-negative Plastics market size was USD 386 million in 2024 and is expected to reach USD 765 million by 2032 and grow at a CAGR of 8.93% over the forecast period of 2025-2032. The growth is driven by its technological advances in carbon-negative plastics, spurred by federal investment and partnerships between startups and research institutions. Instead of simply outlawing plastics, the U.S. is setting its sights on remaking how they are made, converting emissions and renewable feedstock into the building blocks of packaging and consumer goods.
Market Dynamics:
Key Drivers:
-
Stringent Regulations and Emission Reduction Targets Drives the Market Growth
The tightening environmental legislations within the plastic industry are major factors driving the growth of the carbon-negative plastics market. Governments are implementing policies aimed at net-zero emissions, banning single-use plastics, and applying carbon taxes on materials derived from fossil fuels globally. These steps are driving industries, from packaging and automotive to consumer goods, to look for sustainable, carbon-negative replacements. Regulatory momentum has been further catalysed as the focus on climate commitments as per the Paris Agreement and national net-zero targets gets intensified. They are now companies are pressured to incorporate climate-friendly plastics into their supply chain to remain in compliance and maintain brand sustainability.
In 2024, the U.S. Environmental Protection Agency (EPA) unveiled the National Strategy to Combat Plastic Pollution, with a USD 275 million federal grant to enhance circular use of plastic and reduce GHG emissions produced by plastic making.
Restraints:
-
High Production Costs and Technology Immaturity may Hamper the Market Growth
The industrial application of carbon-negative plastics faces pernicious challenges, such as high production cost and the low commercialization levels of related technologies. However, processes, such as microbial fermentation, catalytic CO₂ conversion, or electrochemical reduction, require sophisticated infrastructure and specific know-how, and their costs are too high for many producers. Scalable deployment is also a concern, as only a few plants produce at the industrial level. Raw material supply for bio-based/CO 2 -2-based polymers is also relatively unstable and costly. These factors result in a cost difference with respect to traditional plastics and reduce the competitiveness in price-driven segments such as fast-moving consumer goods. Even with low-carbon polymer solutions in technology and the availability of heavy subsidies, cost has always been a sticking point.
Opportunities:
-
Growing Investment in Carbon Capture and Utilization (CCU) Technologies Create an Opportunity for the Market
Carbon-negative Plastics market research demonstrates that Carbon Capture and Utilization (CCU) is a disruptive opportunity as it can facilitate CO₂ emissions to be directly converted into polymer feedstocks. As CCU technology gets better, companies will be able to close the carbon loop. This means they will not only produce less carbon, but they will also take hazardous emissions out of the air and turn them into useful products. It fits well with the goals of climate tech and the economy of circularity. A number of lauded participants and governments are investing in CCU-integrated polymer production facilities. Increasing emphasis on sustainable infrastructure and investments from international climate-related programs is also driving the commercialization of these technologies, which drive the carbon-negative plastics market trends.
In 2024, LanzaTech teamed with Danone to produce PET with captured carbon using microbial gas fermentation. The initiative was funded by the U.S. Department of Energy, which contributed to the scaling up of bioplastic bottle production made using captured industrial CO₂.
Segmentation Analysis:
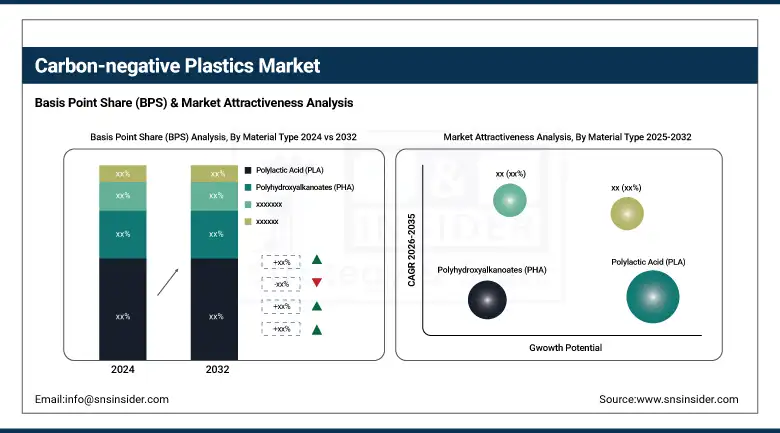
By Material Type
Polylactic Acid (PLA) held the largest Carbon-negative Plastics Market Share around 34.20% in 2024. It is due to its wide availability, proven biodegradability, and compatibility with existing composting infrastructure. It is cost-competitive compared to other bio-based alternatives and is already adopted by major food and beverage brands for packaging. PLA’s stable supply chain and ability to be processed using conventional plastic manufacturing equipment reinforce its leading position in the market.
Carbon-negative polyethylene (PE) is growing the fastest, with the highest CAGR due to it enables manufacturers to utilize captured CO₂ as a feedstock, turning emissions into valuable polymer. This aligns with corporate ESG goals and government decarbonization policies. Major producers including LyondellBasell and Twelve are scaling up CC-PE production, particularly for packaging and durable consumer goods, fueling its expansion.
By Graphene Type
Graphene Nanoplatelets (GNPs) accounted for the dominant share in the market with a share of 38% in 2024, due to their cost-effective and the excellent balance between cost and performance and the ability to be incorporated into a range of polymer matrices through conventional mixing techniques. Their scalability and commercial availability inevitably render them as the first candidate for the vast applications.
Laminates are experiencing the highest growth on account of increasing demand in the electrical, construction, and aerospace industries. High-pressure Carbon-negative Plastics laminates demonstrate excellent fire and chemical resistance and mechanical performance for demanding insulation boards, wall linings, and high-performance industrial panels.
By Production Technology
Microbial fermentation accounts for the highest share as it can be used at a scale to produce both PLA and PHA. These fermentative products are backed by mature biorefineries and have potential access to a variety of agricultural feedstocks, such as corn, sugarcane, and food waste. This approach is also advantageous for its low energy demand and circular bioeconomy-friendly targets in stable demand for packaging and consumer end use.
CCU is the most rapidly proliferating method, in part due to a massive amount is being invested in carbon capture infrastructure in the U.S. and Europe. CCU makes it possible for industrial CO₂ emissions to be transformed into polymers, opening up the potential for a carbon-negative footprint. Since the U.S. Department of Energy has invested more than USD 1.2 billion in carbon capture demonstration projects (2023), it is also facilitating the scale-up of plastics production based on CCU for applications in automotive, construction, and packaging.
By Application
Packaging leads the application segment as global regulations and corporate sustainability goals shift away from fossil-based plastics. Brands are adopting carbon-negative alternatives including PLA and starch blends in single-use containers, retail bags, and wrappers. With consumer pressure for low-waste products, carbon-negative packaging materials are increasingly being certified compostable or recyclable, supporting widespread adoption.
The automotive industry is expected to be the most lucrative and exhibit the highest CAGR, owing of the attention of electric vehicle manufacturers toward sustainable, lightweight materials. Weight reduced, and decreased carbon footprint boosts fuel efficiency and supports OEMs’ life-cycle emissions targets. Automakers, including BMW and Ford, are road testing carbon-negative bioplastics for items, such as interior panels and under-the-hood parts, helping the segment expand.
By End-Use Industry
The food and beverage sector continues to be the largest application area for carbon negative plastics, with its large requirements for packaging and growing demand by consumers. More and more leading brands (Nestle and Coca-Cola) transition away from traditional plastics to compostable and carbon-negative plastics to meet their packaging promises. Containers, cutlery, and films keep this sector the most dominant one using materials such as PLA and, to a lesser extent, PHA, both of which are food safe.
Healthcare is the fastest-growing end-use industry due to the growing usage of Sustainable plastic materials in medical disposables, diagnostic products, and packaging. Produced using medical-grade carbon-negative plastics, have low toxicity, are sterilizable, and come with low-carbon credentials, an important requirement for hospitals and pharma companies keen to reduce their environmental impact. There are many bio-based polymer start-ups working with healthcare manufacturers to find out how to meet these demands while providing carbon savings.
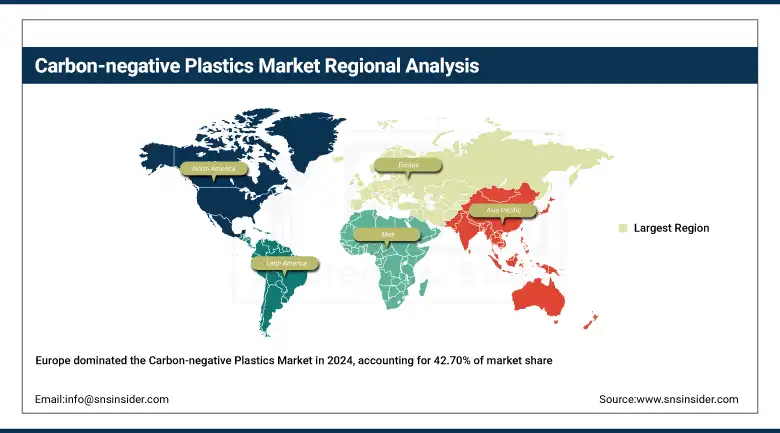
Regional Analysis:
Europe held the largest Carbon-negative Plastics market share, around 42.70%, in 2024 due to the forward-thinking policies in its circular economy, EU’s binding mandates, and innovation ecosystem that works closely with innovative companies and start-ups to build technologies and tweak policies. Regulations, including the European Green Deal, drive the use of recycled and non-fossil carbon materials in packaging and consumer goods. CCU-based polymers are already being developed by local R&D hubs and companies.
Get Customized Report as per Your Business Requirement - Enquiry Now
In October 2024, Fortum in Finland launched INGA the world's 1st biodegradable plastic from CO₂ emissions from waste incineration to the Climate Change Utilisation Programme (CCU). The milestone represents a significant advancement toward commercial carbon-negative plastics in Europe, opening up a new generation of fossil-free and compostable products.
North America is the fastest-growing market. It is due to its developed industrial infrastructure and private sector investment. Rather than simply mandates, major companies here are voluntarily aiming for net-zero supply chains and shopping for alternatives to traditional plastics. In the U.S. and Canada, hundreds of carbon capture projects are in the works, and some of the CO₂-derived plastics now being captured is being diverted for use in making polymers, rather than being sequestered.
In 2024, ExxonMobil launched a USD 200 million expansion into Texas to scale advanced plastic recycling, a key enabler to drive the transition to carbon-negative compounds. The mix of corporate ambition and technical capacity in the region is fueling advancements.
Asia Pacific maintains a significant share of the Carbon-negative Plastics market, due to its high manufacturing facilities, an increasing consumer demand for sustainable products, and global partnerships. Many countries have yet to impose strict carbon regulations, but companies are acting early to position themselves competitively. Germany’s carbonauten join forces with ARBURG to establish new production facilities in Germany and China for CO₂-negative thermoplastics in 2024. It is one of a growing number of workarounds global companies are using to establish manufacturing in Asia, particularly as demand for green electronics, packaging, and parts for electric cars soars. Its greatest strengths are the scale and speed of the region.
Key Players:
Major Carbon-negative plastics companies are Novomer, LanzaTech, Newlight Technologies, Origin Materials, Avantium, Bluepha, Mango Materials, NatureWorks, Danimer Scientific, RWDC Industries, Bio-on, Genomatica, Full Cycle Bioplastics, Borealis, PTT MCC Biochem, BASF, Total Corbion PLA, Solvay, Yield10 Bioscience, and Braskem.
Recent Developments:
-
In 2024, ExxonMobil invested USD 200 million to expand its Exxtend advanced recycling operations in Texas (Baytown and Beaumont) with the objective of processing up to 1 billion pounds of plastic waste per year by 2027.
-
In 2024, LG Chem unveiled Polyethylene Carbonate (PEC), a plastic made from captured emissions, for use as consumer packaging and cosmetic media.
| Report Attributes | Details |
| Market Size in 2024 | USD 3.05 Billion |
| Market Size by 2032 | USD 5.95 Billion |
| CAGR | CAGR of8.69% From 2025 to 2032 |
| Base Year | 2024 |
| Forecast Period | 2025-2032 |
| Historical Data | 2021-2023 |
| Report Scope & Coverage | Market Size, Segments Analysis, Competitive Landscape, Regional Analysis, DROC & SWOT Analysis, Forecast Outlook |
| Key Segments | • By Material Type (Polylactic Acid (PLA), Polyhydroxyalkanoates (PHA), Starch Blends, Carbon-Captured Polyethylene (CC-PE), Others (e.g., CO₂-derived polyurethanes, lignin-based plastics) • By Production Technology (Carbon Capture and Utilization (CCU), Microbial Fermentation, Chemical Synthesis (Catalytic/Enzymatic Conversion), Bio-based Polymerization, Others (e.g., Electrochemical Reduction) • By Application (Packaging, Automotive Components, Consumer Goods, Construction Materials, Textiles & Fibers, Electronics & Electrical, Others (e.g., Agricultural Films, Medical Devices) • By End-Use Industry (Food & Beverage, Retail & E-commerce, Automotive & Transportation, Healthcare, Construction, Electronics, Others (e.g., Fashion, Industrial Use) |
| Regional Analysis/Coverage | North America (US, Canada), Europe (Germany, France, UK, Italy, Spain, Poland, Russsia, Rest of Europe), Asia Pacific (China, India, Japan, South Korea, Australia,ASEAN Countries, Rest of Asia Pacific), Middle East & Africa (UAE, Saudi Arabia, Qatar, Egypt, South Africa, Rest of Middle East & Africa), Latin America (Brazil, Argentina, Mexico, Colombia Rest of Latin America) |
| Company Profiles | Novomer, LanzaTech, Newlight Technologies, Origin Materials, Avantium, Bluepha, Mango Materials, NatureWorks, Danimer Scientific, RWDC Industries, Bio-on, Genomatica, Full Cycle Bioplastics, Borealis, PTT MCC Biochem, BASF, Total Corbion PLA, Solvay, Yield10 Bioscience, Braskem |
Frequently Asked Questions
High production costs, limited scalability, and a lack of end-of-life recycling infrastructure remain significant barriers.
Key players are leveraging R&D partnerships, licensing agreements, and product innovation to strengthen their market positions.
Stringent emission regulations, circular economy initiatives, and rising demand for sustainable packaging are propelling growth.
Stringent emission regulations, circular economy initiatives, and rising demand for sustainable packaging are propelling growth.
Europe dominates the market, while Asia-Pacific is witnessing rapid growth driven by supportive policies and green manufacturing.
Get in Touch
