Aquaculture Market Report Scope & Overview:
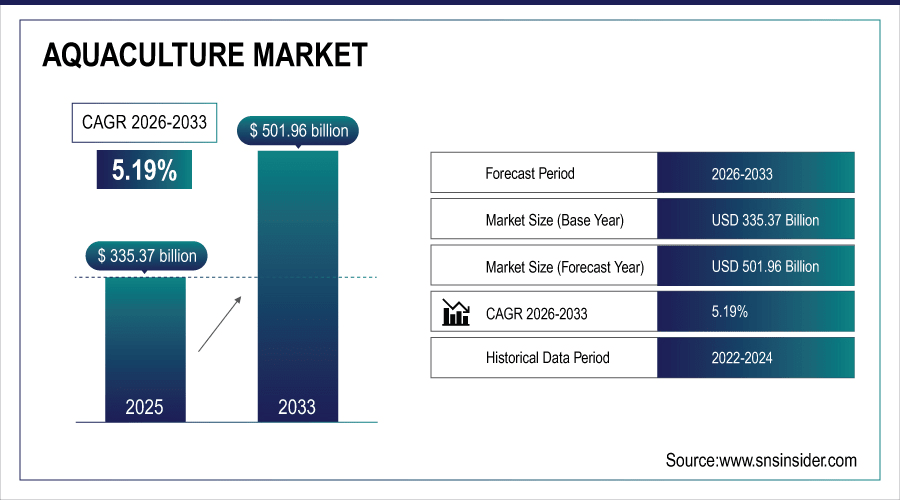
The Global Aquaculture Market size was valued at USD 335.37 billion in 2025E and is projected to reach USD 501.96 billion by 2033, growing at a CAGR of 5.19% during the forecast period 2026–2033.
Aquaculture involves breeding, rearing, and harvesting aquatic species for food, ornamental, and industrial purposes. In 2025, over 110 million tons of aquaculture products were produced globally, with 42% sourced from recirculating and cage culture systems. Asia accounted for nearly 62% of production. Rising seafood demand, depletion of wild fish stocks, technological adoption in sustainable farming, and growth in high-value species like shrimp and salmon are driving market expansion.
Finfish accounted for 48% of total aquaculture production in 2025, highlighting their dominance in global aquaculture output.
To Get More Information On Aquaculture Market - Request Free Sample Report
Market Size and Forecast:
-
Market Size in 2025: USD 335.37 Billion
-
Market Size by 2033: USD 501.96 Billion
-
CAGR: 5.19% from 2026 to 2033
-
Base Year: 2025
-
Forecast Period: 2026–2033
-
Historical Data: 2022–2024
Aquaculture Market Trends:
-
Global aquaculture production is projected to reach 118 million tons in 2025, with shellfish contributing nearly 25% of the total output.
-
North America is expected to produce around 8.5 million tons, driven by increasing demand for sustainable seafood and high-value species like salmon and trout.
-
Europe (Norway, Spain, and France) will generate about 10.2 million tons, with advanced recirculating aquaculture systems gaining momentum.
-
Approximately 38% of aquaculture farms are adopting modern tank and recirculating systems, indicating a shift toward sustainable, high-efficiency farming.
-
Over 60% of production is targeted for commercial food and seafood supply chains, emphasizing the market’s strong commercial focus.
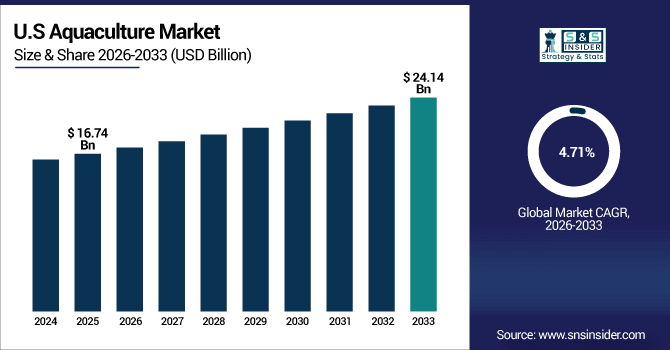
U.S. Aquaculture Insights:
The U.S. Aquaculture Market was USD 16.74 billion in 2025E, projected to reach USD 24.14 billion by 2033 at a CAGR of 4.71%. Finfish and shrimp dominate production, with recirculating and cage systems growing rapidly. Rising seafood demand, sustainable practices, and technological innovations are driving market expansion throughout the forecast period.
Aquaculture Market Growth Drivers:
-
Declining Wild Fish Stocks Accelerate Investment in Commercial Aquaculture Production.
The Aquaculture Market is witnessing strong growth, driven by declining wild fish stocks. In 2025, over 22 million tons of farmed seafood were produced globally to compensate for wild stock shortages, representing nearly 19% of total seafood consumption. Advanced recirculating and cage systems were utilized in 41% of this production, improving efficiency and sustainability. Asia accounted for 65% of farmed output, highlighting regional dominance and investment in aquaculture expansion.
Farmed finfish production represented nearly 48% of global aquaculture output in 2025, underscoring its strong contribution to market growth.
Aquaculture Market Restraints:
-
High Operational Costs and Technical Expertise Requirements Limit Small-Scale Aquaculture Expansion.
High operational costs and technical expertise requirements remain significant barriers to aquaculture expansion. In 2025, nearly 33% of small-scale farms in developing regions could not adopt modern recirculating or cage systems, compared with only 9% in developed countries. Limited access to capital, skilled labor shortages, and inadequate infrastructure constrain production efficiency. Environmental regulations and disease management challenges further slow technology adoption, restricting overall market growth despite rising seafood demand and global depletion of wild fish stocks.
Aquaculture Market Opportunities:
-
Expansion of High-Value Species Farming and Sustainable Technologies Offers Significant Growth Opportunities in Aquaculture.
The expansion of high-value species farming and sustainable technologies is driving significant growth opportunities. By 2025, over 15 million tons of shrimp and salmon were farmed globally, representing nearly 13% of total aquaculture production. This output is projected to surpass 25 million tons by 2033, fueled by advanced farming systems and improved feed efficiency. Leading farms in Asia and North America already contribute around 62% of high-value species production, indicating strong market potential.
High-value species farming is projected to grow at over 6.2% annually, enhancing sustainable production and expanding global market reach.
Aquaculture Market Segmentation Analysis:
-
By Species, Finfish held the largest market share of 66.84% in 2025, while Crustaceans are expected to grow at the highest CAGR of 6.72%.
-
By Culture System, Pond Culture contributed the highest market share of 52.61% in 2025, while Recirculating Aquaculture Systems (RAS) are forecasted to expand at the fastest CAGR of 9.18%.
-
By Application, Food & Seafood Production accounted for the largest share of 71.42% in 2025, while Pharmaceuticals & Nutraceuticals are expected to grow at the fastest CAGR of 7.29%.
-
By End User, Seafood Processing Companies held the largest share of 38.69% in 2025, while Research Institutes are anticipated to grow at the fastest CAGR of 6.57%.
-
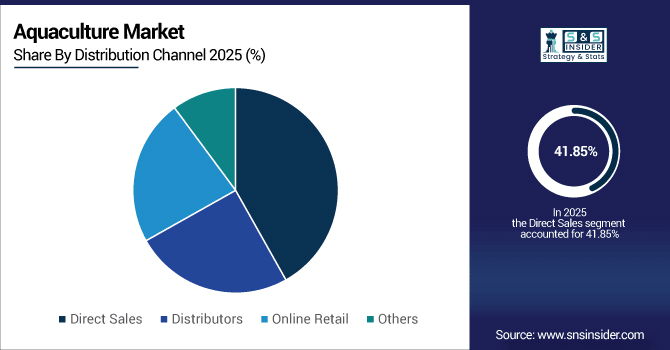
By Distribution Channel, Direct Sales contributed the highest market share of 41.85% in 2025, while Online Retail is expected to grow at the fastest CAGR of 8.24%.
By Distribution Channel, Direct Sales Dominate While Online Retail Expands Rapidly:
Direct sales accounted for the majority of aquaculture distribution in 2025, with 36.7 million tons sold directly to wholesalers and retailers. Online retail is expanding quickly, projected to increase from 13.5 million tons in 2025 to 24.8 million tons by 2033, supported by e-commerce growth, consumer preference for doorstep delivery, and the rise of premium seafood subscription services.
By Species, Finfish Lead While Crustaceans Expand Rapidly:
Finfish dominated global aquaculture production in 2025, with over 55.2 million tons farmed worldwide, primarily for human consumption and export markets. Crustaceans, particularly shrimp and prawns, are expanding rapidly, with production expected to increase from 12.1 million tons in 2025 to 21.3 million tons by 2033, driven by high demand in North America and Europe and adoption of advanced farming technologies.
By Culture System, Pond Culture Dominates While RAS Grows Fastest:
Pond culture accounted for the majority of production in 2025, yielding around 42.5 million tons globally due to low-cost setup and wide adaptability. Recirculating Aquaculture Systems (RAS) are expanding quickly, expected to increase from 6.8 million tons in 2025 to 13.2 million tons by 2033, owing to water efficiency, disease control, and sustainable farming practices.
By Application, Food & Seafood Production Remains Largest While Pharmaceuticals Expand:
Food and seafood production led aquaculture usage in 2025, producing over 61.3 million tons for commercial consumption. Pharmaceuticals and nutraceuticals applications are growing fast, with marine-derived compounds and bioactive ingredients increasing from 3.9 million tons in 2025 to 7.6 million tons by 2033, driven by rising interest in health supplements and marine-based therapeutics.
By End User, Seafood Processing Companies Lead While Research Institutes Grow Quickly:
Seafood processing companies managed the largest portion of aquaculture output in 2025, handling 33.2 million tons of farmed seafood. Research institutes are rapidly increasing involvement, with production for experimental and breeding purposes growing from 5.4 million tons in 2025 to 9.8 million tons by 2033, fueled by technological adoption, disease research, and development of high-value species.
Aquaculture Market Regional Analysis:
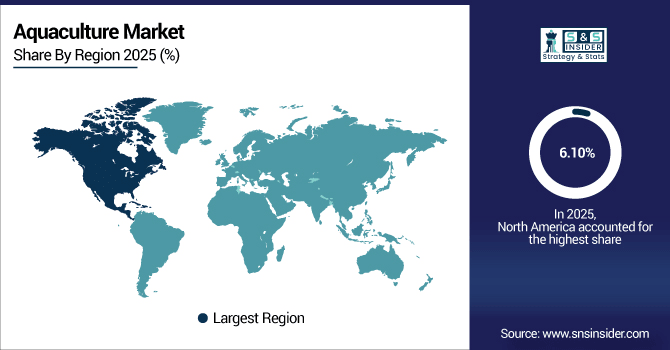
North America Aquaculture Market Insights:
North America accounted for approximately 6.10% of the global aquaculture market in 2025, with the U.S. contributing over 86% of regional production. Finfish and shrimp farming dominate; while recirculating and cage systems are rapidly gaining adoption. Rising seafood demand, technological innovations, and sustainable aquaculture practices are driving growth. The market is projected to expand steadily through 2033, supported by increased production efficiency and government initiatives promoting aquaculture development.
Get Customized Report as Per Your Business Requirement - Enquiry Now
U.S. Aquaculture Market Insights:
In 2025, over 1,200 commercial aquaculture farms across the U.S. produced finfish, shrimp, and shellfish using recirculating and cage systems. Rising seafood demand, adoption of sustainable practices, and technological innovations in farming methods are expected to drive increased production efficiency, supporting steady market growth and expansion through 2033.
Asia-Pacific Aquaculture Market Insights:
The Asia-Pacific Aquaculture market holds a 75.60% share of the global market and is projected to grow at a CAGR of 5.31% during 2026–2033. In 2025, millions of tons of finfish, shrimp, and shellfish were produced across commercial farms in China, India, Vietnam, and Indonesia. Rapid growth is fueled by increasing seafood demand, adoption of recirculating and cage systems, technological innovations, and government initiatives promoting sustainable aquaculture practices, supporting higher production efficiency and regional market expansion.
China Aquaculture Market Insights:
China is the dominant Asia-Pacific Aquaculture market, producing over 36 million tons of seafood in 2025. Increasing demand for finfish and shrimp, widespread adoption of recirculating and cage culture systems, and government support for sustainable aquaculture practices are driving growth. Rising domestic consumption, export demand, and technological innovations are anticipated to further stimulate market expansion through 2033.
Europe Aquaculture Market Insights:
In 2025, Europe accounted for over 12.5 million tons of aquaculture production, led by Norway, Spain, and the UK. Growth is driven by rising demand for finfish and shellfish, adoption of recirculating and cage culture systems, and government support for sustainable aquaculture. Technological innovations, increased seafood exports, and regulatory frameworks promoting environmentally friendly practices are expected to fuel market expansion and strengthen Europe’s position in the global aquaculture market through 2033.
Germany Aquaculture Market Insights:
Germany is a key aquaculture market in Europe, producing over 3.2 million tons of finfish and shellfish in 2025. Advanced recirculating and cage culture systems, strong government support for sustainable aquaculture, rising domestic seafood demand, technological innovations, and export-oriented production contribute to Germany’s leading position in the European aquaculture market.
Latin America Aquaculture Market Insights:
The Latin America Aquaculture market produced over 4.5 million tons of finfish, shrimp, and shellfish in 2025, with Brazil, Mexico, and Argentina leading production. Growth is driven by adoption of pond and cage culture systems, government initiatives promoting sustainable aquaculture, rising domestic seafood demand, technological advancements, and increased export opportunities across the region, supporting steady market expansion through 2033.
Middle East and Africa Aquaculture Market Insights:
The Middle East & Africa Aquaculture market produced over 1.2 million tons of finfish, shrimp, and shellfish in 2025. Growth is driven by rising domestic seafood demand, adoption of cage and recirculating systems, government initiatives supporting sustainable aquaculture, technological innovations, and increased investment in commercial farms, fueling steady market expansion across the region.
Aquaculture Market Competitive Landscape:
Thai Union Group PCL is a global leader in aquaculture, producing over 1.5 million tons of seafood annually. The company offers a broad portfolio, including frozen and ready-to-eat seafood products. Strong R&D, sustainable sourcing practices, and partnerships with retailers and foodservice providers enable Thai Union to maintain market leadership and expand its global presence in key regions, including Asia, Europe, and North America.
-
In July 2025, Thai Union promoted sustainable shrimp farming at the UN Global Compact Expo. The initiative also aims to protect marine biodiversity by 2030.
MOWI ASA is the world’s largest Atlantic salmon producer, harvesting over 464,000 tons annually. The company operates a fully integrated value chain, from roe to plate, and produces its own environmentally certified feed. Strong presence in Europe and North America, sustainable farming practices, and innovation in production systems help MOWI retain market dominance and lead global aquaculture growth.
-
In May 2025, MOWI secured a €2.6B sustainability-linked credit facility. This supports green aquaculture and responsible production practices.
Maruha Nichiro Corporation is a vertically integrated seafood company engaged in aquaculture, fishing, processing, and distribution. In 2025, the company produced over 1.2 million tons of seafood globally. Its extensive network, diversified product portfolio, and focus on sustainable aquaculture practices strengthen its market position and support leadership in key markets across Asia and internationally.
-
In May 2025, Maruha Nichiro partnered with Umami Bioworks for lab-grown bluefin tuna. The collaboration provides a sustainable alternative to traditional fishing.
Aquaculture Market Key Players:
Some of the Aquaculture Market Companies are:
-
Thai Union Group PCL
-
MOWI ASA
-
Maruha Nichiro Corporation
-
Cooke Aquaculture Inc.
-
SalMar ASA
-
Cermaq Group AS
-
Lerøy Seafood Group ASA
-
Nippon Suisan Kaisha, Ltd.
-
P/F Bakkafrost
-
Kyokuyo Co., Ltd.
-
Stolt-Nielsen Limited
-
Huon Aquaculture Group Pty Ltd
-
Nireus Aquaculture SA
-
Selonda Aquaculture SA
-
Promarisco
-
Stoly Sea Farm SA
-
International Fish Farming Holding Co. - Asmak
-
Aquaculture of Texas Inc.
-
Aquaculture Systems Technologies, L.L.C.
-
Aquafarm Equipment AS
| Report Attributes | Details |
|---|---|
| Market Size in 2025 | USD 335.37 Billion |
| Market Size by 2033 | USD 501.96 Billion |
| CAGR | CAGR of 5.19% From 2026 to 2033 |
| Base Year | 2025 |
| Forecast Period | 2026-2033 |
| Historical Data | 2022-2024 |
| Report Scope & Coverage | Market Size, Segments Analysis, Competitive Landscape, Regional Analysis, DROC & SWOT Analysis, Forecast Outlook |
| Key Segments | • By Species (Finfish, Shellfish, Crustaceans, Mollusks, Others) • By Culture System (Recirculating Aquaculture Systems, Cage Culture, Pond Culture, Tank Systems, Integrated Multi-Trophic Aquaculture) • By Application (Food & Seafood Production, Ornamental Aquaculture, Aquatic Feed Production, Pharmaceuticals & Nutraceuticals, Others) • By End User (Seafood Processing Companies, Retailers, Restaurants, Research Institutes, Others) • By Distribution Channel (Direct Sales, Distributors, Online Retail, Others) |
| Regional Analysis/Coverage | North America (US, Canada), Europe (Germany, UK, France, Italy, Spain, Russia, Poland, Rest of Europe), Asia Pacific (China, India, Japan, South Korea, Australia, ASEAN Countries, Rest of Asia Pacific), Middle East & Africa (UAE, Saudi Arabia, Qatar, South Africa, Rest of Middle East & Africa), Latin America (Brazil, Argentina, Mexico, Colombia, Rest of Latin America). |
| Company Profiles | Thai Union Group PCL, MOWI ASA, Maruha Nichiro Corporation, Cooke Aquaculture Inc., SalMar ASA, Cermaq Group AS, Lerøy Seafood Group ASA, Nippon Suisan Kaisha, Ltd., P/F Bakkafrost, Kyokuyo Co., Ltd., Stolt-Nielsen Limited, Huon Aquaculture Group Pty Ltd, Nireus Aquaculture SA, Selonda Aquaculture SA, Promarisco, Stoly Sea Farm SA, International Fish Farming Holding Co. - Asmak, Aquaculture of Texas Inc., Aquaculture Systems Technologies, L.L.C., Aquafarm Equipment AS |
Frequently Asked Questions
The global Aquaculture market is projected to grow at a CAGR of 5.19% from 2026 to 2033.
The market was valued at USD 335.37 billion in 2025E and is expected to reach USD 501.96 billion by 2033.
Declining wild fish stocks, rising seafood demand, adoption of sustainable farming technologies, and expansion of high-value species like shrimp and salmon.
Asia-Pacific, with a CAGR of 5.31%, driven by technological adoption, high seafood demand, and government initiatives promoting sustainable aquaculture.
Asia-Pacific, holding 75.60% share, supported by large-scale production in China, India, Vietnam, and Indonesia, and rapid adoption of recirculating and cage culture systems.
Get in Touch
