Armored Vehicle Market Report Scope & Overview:
Get More Information on Armored Vehicle Market - Request Sample Report
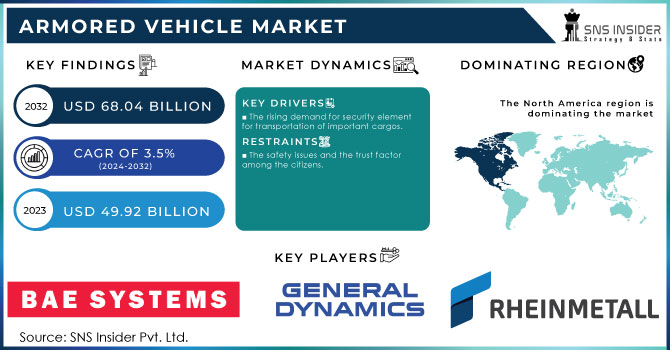
The Armored Vehicle Market Size is expected to reach USD 68.04 Bn by 2032, the market was valued at USD 49.92 Bn in 2023 and will grow at a CAGR of 3.5% over the forecast period of 2024-2032.
Steel or composite Platforms are used as armor in armored vehicles to protect against bullets and shrapnel. They have varying degrees of ballistic protection, with greater degrees being able to withstand more potent weapons. Many armored vehicles have blast and explosive hazard protection features for the occupants. This involves defense against landmines and improvised explosive devices (IEDs). Explosion impacts are lessened by blast-resistant floors, strengthened structural elements, and specially made seats. To combat threats from within the vehicle, some armored vehicles are fitted with armaments like machine guns or small-caliber cannons. These cars are frequently employed for military purposes.
Armoured vehicles may be necessary for private citizens, commercial enterprises, and governmental organizations to secure their assets in areas or nations with high rates of crime, violence, or civil upheaval. These automobiles offer safety and comfort of mind. Armoured vehicles are crucial for the safety of military personnel, aid workers, journalists, and diplomats in regions impacted by armed conflict or insurgency. The risks involved with operating in dangerous situations are reduced to some extent by armored vehicles. Important documents, cash, jewels, and precious metals are all frequently transported in armored vehicles together with other valuable cargo. For instance, cash-in-transit vehicles guard against theft and robbery while moving.
One of the dominant trends includes the increased demand for modular armored vehicles; close to 38% of the armed forces in the world prefer the modular designs because these can be highly upgradeable and flexible regarding combat situations. Advanced communication and situational awareness have been given much priority, with some 45% of newly ordered armored vehicles featuring advanced communication technology allowing the real-time transfer of data and improving efficiency in operational activities. The same time, hybrid and electric power for armored vehicles investments are growing as nations move towards a sustainable operation. Already, 25% of defense budgeted procurement of new armored vehicles, earmarked for hybrid or electric variants, to reduce carbon footprints without sacrificing effectiveness in combat. The trend for unmanned armored vehicles is also gaining pace as 30% of the new prototypes under development are coming up with autonomous features to reduce personnel risks during high-risk missions.
Armored Vehicle Market Dynamics:
Drivers:
- The rising demand for security element for transportation of important cargos.
There are increasingly more involved truckers in the management of loading and off-loading, where 35% of armored vehicle deployment include enhanced duties of truckers responsible for safe handling of values at every stage of transportation. There is also a growing trend of implementing digital documentation and tracking systems; nearly 30% of the armored vehicle fleets have implemented electronic manifests and real-time tracking technologies, which had improved records of goods transported so that there would be no paper mistakes involved in paperwork. The trend toward optimizing the operational role of drivers is also evident, as more companies come to realize the worth of having drivers maintain thorough records, such as invoices, manifests, and delivery confirmations, which increases accountability. This emphasis on security, transparency, and driver engagement reflects a broader industry shift to upgrade the operations benchmark and reduce risk associated with the transportation of high-value cargo.
Restrains:
- The safety issues and the trust factor among the citizens.
Clearly, armored vehicles are gaining importance with a great focus on their safety. At present, around 40% of manufacturers give priority to highly advanced safety systems such as reinforced armor and anti-ballistic measures for the respective threats and well-being of personnel and cargo. This emphasis is largely due to the rising public consciousness of inadequate protection measures, hence making a company invest more in cutting-edge safety technologies to boost public confidence. Trust among citizens is a key determinant in understanding market trends, especially regarding the use of armored vehicles in both defense and civilian contexts. Studies indicate that about 35 percent of the public view armored vehicles in terms of the openness of their activities and the public visibility of the security apparatus employed. In order to gain confidence, there has been a trend toward greater public visibility in terms of security measures or usage of tracking systems and periodic public demonstration of safety features. Moreover, trust is developed through rigorous driver training programs- about 30% of armored vehicle service providers now emphasize driver certification and adherence to strict safety standards.
Armored Vehicle Market Segmentation Overview:
By Platform:
The battle vehicle market, by platform, is found to comprise combat vehicles, support combat vehicles, and unmanned armed ground vehicles; all of these have a crucial role in military operations. Combat vehicles still hold an important market share since approximately 45% of defense expenditure has been put aside for these platforms because they are considered critical to direct engagement and frontline capabilities. Progresses in the aspects of firepower, armor, and mobility are driving investments; however, the main development focus has remained on versatility in all types of combat situations like combat support vehicles.
Combat support vehicles account for 30% of the procurement request and are quite critical for logistical functionality like supplying ammunition or evacuating medical patients. As integrated battlefield support gains importance, such vehicles along with high-degree communication and coordination facilities have been researched and developed in order to ensure seamless support during missions. Meanwhile, UAGVs are a major growth area, with about 25 percent of new ventures focusing on unmanned solutions for high-risk tasks such as reconnaissance and explosive ordnance disposal. The reason is the development in robotics and AI, which is supposed to reduce the risks in undertaking such activities more effectively than humans.
By Propulsion Type:
The conventional-armoured vehicles that are dominant in the market make their advantage lie in established support infrastructure and proven reliability, which have been preferred in practice. Being normally equipped with diesel or gasoline engines, they provide such high outputs in capability for long-range missions without frequent refueling. Approximately 70% of the existing armoured vehicles use conventional propulsion because these have so far been cost-effective and operationally possible on diverse terrains and under extreme conditions. In contrast, however, with the sustainability drive and the pressing need to lessen carbon footprints in military operations, there is a new trend on electric propulsion in armored vehicles. Now, 30% of new development projects are armored vehicles electric-powered, and the nations are banking on these for quieter operations and low thermal signatures conducive for stealth and reconnaissance missions.
By Mobility Type:
Wheeled armored vehicles have become more accepted due to their greater speed, cost-effective, and their utility in all kinds of terrain. 60% of the procure programs of new armored vehicles, which are based on wheeled platforms, will be rapid reaction, urban operations, and peacekeeping missions due to the fact that they are prepared for both on-road and off-road maneuvers, and they require less maintenance as well. So, most of the defense forces choose wheeled vehicles in order to achieve flexibility and mobility. The tracked armored vehicles make around 40% of the market and are in demand, mostly for better off-road capabilities and stability in trying terrain. Such vehicles become highly essential in frontline combat operations, wherein mobility across rough, uneven terrain is very critical. Tracked platforms are highly crucial for delivering firepower that comes with improved armor and the requirement to withstand intense combat conditions. They are more valuable in situations involving heavy combat, as they require superior traction and durability.
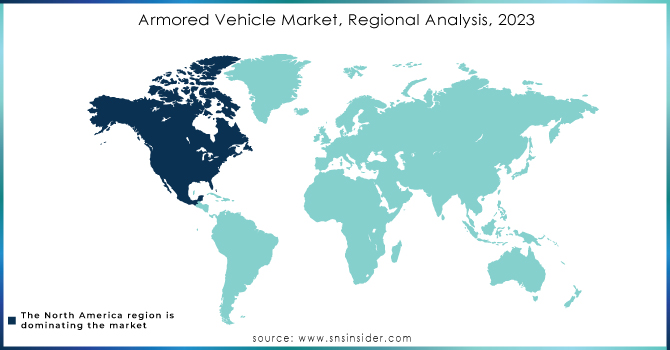
Armored Vehicle Market Regional Analysis
North America will be the region with the highest share because, the U.S. is a significant producer and consumer of armored vehicles. Tanks, infantry combat vehicles, and armored personnel carriers are just a few of the many armored vehicles that the U.S. military keeps on the road. Additionally, the nation is home to a few defense companies with a focus on the creation of armored vehicles. The country's armored vehicle projects are largely intended to serve the requirements of its military services. In the international market for armored vehicles, Canadian businesses also compete.
APAC will be the region with highest CAGR growth rate because China's armored vehicle industry is strong and produces a variety of vehicles for both domestic and international markets. Chinese armored vehicles are well-known for being inexpensive and are becoming more well-liked worldwide. The country both develops its own armored vehicle programs and imports armored vehicles from other nations. Armoured vehicles are used by the Indian military for a variety of purposes, including transport, combat, and reconnaissance. With a concentration on cutting-edge technology, South Korea is a notable producer of armored vehicles. Companies from South Korea compete internationally and export armored vehicles to numerous nations.
Get Customized Report as per your Business Requirement - Request For Customized Report
Key Players
The major key players are BAE Systems, General Dynamcis Corporation, Rheinmetall AG, Denel SOC ltd, IVECO Defence Vehicles, Otokar, Textron Systems, NORINCOGROUP and others.
| Report Attributes | Details |
| Market Size in 2023 | USD 49.92 Billion |
| Market Size by 2032 | USD 68.04 Billion |
| CAGR | CAGR of 3.5% From 2024 to 2032 |
| Base Year | 2023 |
| Forecast Period | 2024-2032 |
| Historical Data | 2020-2022 |
| Report Scope & Coverage | Market Size, Segments Analysis, Competitive Landscape, Regional Analysis, DROC & SWOT Analysis, Forecast Outlook |
| Key Segments | • By Platform: (Combat Vehicles, Combat Support Vehicles, Unmanned Armored Ground Vehicles) • By Propulsion Type: (Conventional, Electric) • By Mobility Type: (Wheeled, Tracked) • By Solution: (Line Fit, Retrofit) • By System: (Drive Systems, Structures & Mechanisms, Navigation, Others) |
| Regional Analysis/Coverage | North America (US, Canada, Mexico), Europe (Eastern Europe [Poland, Romania, Hungary, Turkey, Rest of Eastern Europe] Western Europe] Germany, France, UK, Italy, Spain, Netherlands, Switzerland, Austria, Rest of Western Europe]), Asia Pacific (China, India, Japan, South Korea, Vietnam, Singapore, Australia, Rest of Asia Pacific), Middle East & Africa (Middle East [UAE, Egypt, Saudi Arabia, Qatar, Rest of Middle East], Africa [Nigeria, South Africa, Rest of Africa], Latin America (Brazil, Argentina, Colombia, Rest of Latin America) |
| Company Profiles | BAE Systems, General Dynamcis Corporation, Rheinmetall AG, Denel SOC ltd, IVECO Defence Vehicles, Otokar, Textron Systems, NORINCOGROUP |
| Key Drivers | • The rising demand for security element for transportation of important cargos. |
| RESTRAINTS | • The safety issues and the trust factor among the citizens. |
Get in Touch
