image

Asset Tokenization Market Size, Share & Segmentation By Asset Type (Real Estate, Debt, Investment Funds, Private Equity, Public Equity, and Other Types), By End-user Vertical (Institutional Investors and Retail Investors), and Region | Global Forecast 2025-2032

Date: June 2025 Report Code: SNS/ICT/7430 Page 300

Asset Tokenization Market Report Scope & Overview:

Asset Tokenization Market size was valued at USD 2.06 trillion in 2024 and is expected to reach USD 41.94 trillion by 2032, growing at a CAGR of 45.83% over 2025-2032. 
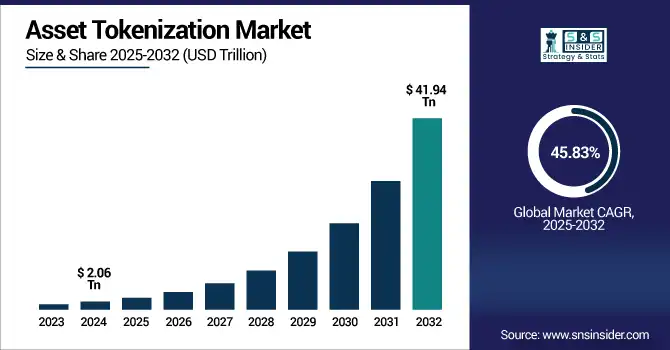
The Asset Tokenization Market growth is due to higher demand for liquidity, fractional ownership and transparent transactions. This can help secure and efficient trading of real-world assets, building interest among institutional and retail investors. These will continue to expand and go mainstream but will be fueled by regulatory advances and adoption out of real estate, private equity, and debt markets.

In March 2024, BlackRock launched the first-ever tokenized fund on the Ethereum network with its BUIDL fund. The fund, which will be accessed via the blockchain, seeks to afford liquidity and ease of access.

DAMAC Group has signed a USD 1 billion deal with blockchain platform MANTRA to cater to real world assets tokenization in the Middle East as the latter focuses on maximizing liquidity and institutional interest.

Additionally, widespread tokenization could lead to annual savings of USD 20 billion in global clearing and settlement costs, highlighting the significant economic impact of this technological shift.

U.S. Asset Tokenization Market size was valued at USD 0.57 trillion in 2024 and is expected to reach USD 11.55 trillion by 2032, growing at a CAGR of 45.80% over 2025-2032. 

The U.S. Asset Tokenization Market grows due to strong blockchain adoption, supportive regulations, and increasing investor interest in fractional ownership. Enhanced transparency, liquidity, and efficiency in trading diverse assets drive market expansion across real estate, finance, and alternative investments.

In March 2025, when the U.S. government created two national crypto reserves the Strategic Bitcoin Reserve and the U.S. Digital Asset Stockpile with USD 21B worth of digital assets confiscated from criminal and civil cases. This makes the U.S. the first-mover in declaring cryptocurrency a strategic asset.

Additionally, the Financial Innovation and Technology for the 21st Century Act (FIT21) which passed U.S. House of Representatives in May 2024, introduces a framework for digital assets that separates the roles for the Commodity Futures Trading Commission (CFTC) and Securities and Exchange Commission (SEC), further solidifying the regulatory clarity and progress behind asset tokenization within the U.S.

Market Dynamics:

Drivers:

  • Growing Adoption of Blockchain for Security, Transparency, and Compliance is Accelerating Institutional Interest in Asset Tokenization Platforms

Blockchain has unique advantages, such as being immutable, transparent and continuously auditable, premising trust in transactions of digital assets and that is why its adoption has accelerated among institutions. Such platforms make it easier to report to regulators, conduct real-time audits, and cut intermediaries, thus delivering lower costs and better efficiency. The ability to programmability of tokenized assets as a result of smart, compliant contracts are attractive for regulated entities that are price–sensitive when it comes to complying with KYC/AML. It accelerates institutional adoption, reinforcing the position of blockchain technology as

In August 2024, State Street partnered with Swiss crypto firm Taurus to further develop its digital asset services to tokenize real-world assets against which tokens can be traded. ATS aims to meet the growing institutional interest to hedge inflation and diversify portfolios.

As of May 2025, Securitize has issued over USD 4 billion in assets on-chain, including the USD 2.8 billion BlackRock BUIDL Fund, the largest tokenized treasury fund. The company also manages the largest tokenized equity, Exodus, valued at approximately USD 400 million.

Canton Network is a public blockchain network launched in 2023, designed specifically for financial institutions, to facilitate secure, interoperable, and privacy-preserving transactions. Goldman Sachs, Microsoft, Deutsche, and more than 30 high-profile institutions were involved in the launch of the network.Top of Form

Restraints:

  • Lack of Regulatory Clarity Across Jurisdictions is Delaying Institutional Deployment and Stalling Innovation in Asset Tokenization Initiatives

Vague and heterogeneous legal frameworks between countries generate great uncertainty for platforms tokenizing assets, in particular on the classification of the security, the protection of investors, and cross-border compliance. Such regulatory fragmentation limits the large-scale adoption of the technology as financial institutions are concerned about compliance risks and legal consequences. In some territories tokenization is still in an experimentation stage, resulting in siloed projects which do not lend themselves to scalability. The lack of globally harmonized guidelines makes it impossible to scale asset tokenization outside of niche markets preventing institutional investors from deploying capital as they require unambiguous legal certainty.

Opportunities:

  • Integration of DeFi Protocols with Tokenized Assets is Enabling Automated Trading, Lending, and Liquidity Pooling at Unprecedented Efficiency

Tokenizing the ownership of real-life assets in DeFi protocols allows owners to lend, stake, or yield via smart contracts without losing the full ownership of their assets. Automated market making, and decentralized exchanges increase liquidity to those illiquid assets. Programmable tokens enable real-time risk management on-chain followed by voting and implementation of transparent governance. With better interoperability, tokenized assets are eventually made composable between DeFi protocols, transforming idle holdings into capital. These innovations bring a level of institutional intensity and usability that firmly secure asset tokenization as a foundational layer of tomorrow's financial infrastructure.

Securitize has collaborated with a number of DeFi platforms (Agora, Elixir, and Frax) to incorporate tokenized real-world assets into decentralized ecosystems to facilitate lending, staking and yield generation, all whilst bringing more institutional capital to DeFi markets.

Uniswap is a popular DEX that uses automated smart contracts to generate liquidity pools for trades. It is essential to have this kind of model in order to facilitate more liquid trading of tokenized assets in a more efficient manner without depending on centralized authorities.

Liquidity pools, fundamental to DeFi platforms, allow users to contribute tokenized assets to smart contracts, facilitating decentralized trading and earning a share of transaction fees. This mechanism increases the utility and productivity of tokenized assets within the DeFi ecosystem.

Challenges:

  • Low Awareness and Technical Literacy Among Investors and Institutions are Slowing Market Traction for Asset Tokenization Platforms

Adoption is reluctant among institutional and traditional investors and smaller institutions because too many stakeholders do not understand asset tokenization, blockchain, or both, and their legal and financial implications. This gap is exacerbated by a lack of educational outreach, accessible tools, and industry training. Entry is also stifled by complicated onboarding and technical jargon. Absent better education, demonstrations, and leadership will continue to dishonestly defend against the tokenization of assets leading to a needless deceleration of its entry into the market and into the public eye as an accepted norm.

The report by the U.S. Government Accountability Office (GAO) outlines the challenges that federal agencies will face in adopting blockchain technology, stating that they will require specialized training in areas including smart contracts, data science, and cryptography.

According to a survey by Ernst & Young, 80% of high-net-worth (HNW) investors and 77% of institutional investors would like to access tokenized assets via traditional financial institutions. And that preference highlights the role of proven intermediaries to support investors with integrating tokenized assets into investment strategies.

Segmentation Analysis:

By Asset Type

Real estate dominated the asset tokenization market in 2024 with the highest revenue share of approximately 34% due to the high-value nature of the underlying asset, their illiquid state and their appeal for fractional ownership. Tokenization makes real world assets more accessible to global investors, while providing greater liquidity and lower transaction costs. While these benefits have lured institutional participants and asset managers looking for efficient means to unbridle value trapped in real world assets in a compliant manner, they have also opened the door for digital asset funds and companies to enter the market.

Private equity is projected to grow at the fastest CAGR of around 49.62% over 2025-2032, driven by the growing demand for liquidity and transparency from traditionally opaque investment structures. With tokenization, fractional ownership, lower barriers to entry, accessibility, and instant settlement are possible and provide higher accessibility to a wider group of investors. With startups and growth-stage companies increasingly looking to alternative fundraising mechanisms, tokenized private equity offers an adaptable capital-raising approach able to meet scaling requirements.

By End-user Vertical

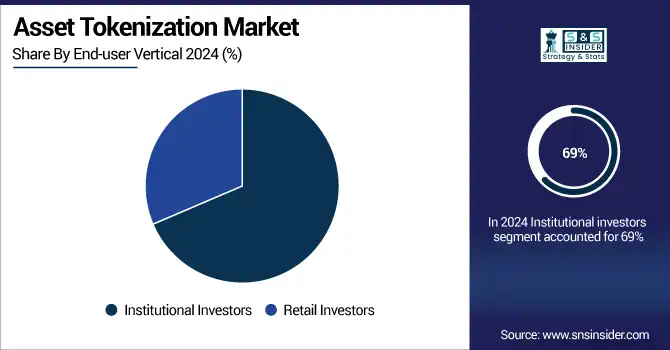
Institutional investors led the asset tokenization market share in 2024, contributing about 69%, primarily by large amounts of capital, sound risk management capabilities, and a trend of early adoption of blockchain technologies. Transparency, compliance, and operational efficiency are important to these entities and tokenized infrastructures support these goals well. They have also set the trend for accelerations in wider markets and liquidity development in real estate, debt and private equity tokenization.

Retail investors are expected to witness the fastest CAGR of nearly 47.04% over 2025-2032 as tokenization becomes broadly applicable and opens the doors to high-value assets. Fractional ownership allows small-to-mid-scale investors to enter areas that have typically been inaccessible, such as real estate or private equity, with lower upfront capital. The growing popularity of blockchain wallets, streamlined investment platforms, and regulatory clarity around digital securities are continuing the acceleration of retail participation in the tokenized investment ecosystem.
Regional Analysis:

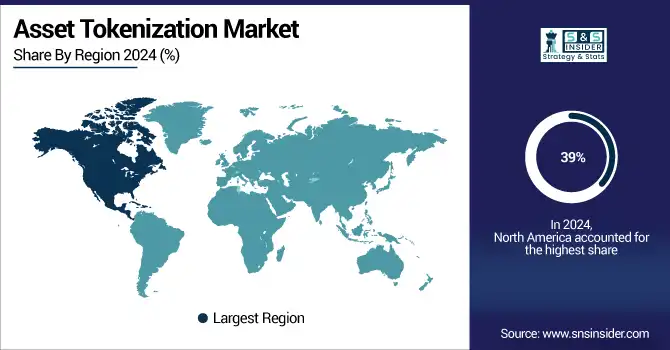
North America accounted for the highest revenue share of approximately 39% in the asset tokenization market in 2024 due to its developed financial complex, regulatory initiatives and early blockchain adoption. Strong market activity with participation from institutional investors and supportive legal frameworks for the and major tokenization platforms present in the region makes it a leader. Furthermore, collaborations between fintechs with traditional asset managers have fast-tracked real estate and capital markets to tokenize across an entire industry.

The U.S. dominated the asset tokenization market trends due to robust regulatory frameworks, strong institutional investment, and early adoption of blockchain in financial services.

Asia Pacific is anticipated to register the fastest CAGR of around 48.19% over 2025-2032, due to the rise of digital adoption, regulatory initiatives, and investor demand for alternative assets. Singapore, Japan, and South Korea have been some of the few countries to be in the forefront of this innovation. The reload of asset tokenization, which is supported by the government infrastructure, is rapidly spreading across the region, with the growing involvement of retail and institutional investors.

The rapid adoption of blockchain, large tokenization projects led by the government and strong institutional interest in digital asset infrastructure in China are pushing the country into the lead of a burgeoning asset tokenization market in the Asia Pacific region.

Europe is advancing in the asset tokenization market due to progressive regulatory frameworks including MiCA, strong financial institutions, and active support for blockchain innovation. Countries, such as the U.K., Germany, and France are leading in institutional adoption and pilot projects.

The U.K. is dominating the asset tokenization market in Europe due to strong fintech ecosystems, regulatory clarity, and high institutional and investor engagement.

In the Middle East & Africa, asset tokenization is gaining traction due to rising interest in digital finance, government-led blockchain initiatives, and diversification of investment portfolios. In Latin America, growing fintech ecosystems and inflation-driven demand for alternative assets are key drivers.
Key Players:

Asset Tokenization Market Companies in Recent Developments:clude Securitize, LLC, tZERO Technologies, SoluLab Inc., Blocktunix Inc., Block Gemini Inc., Polymath Research Inc., Chainlink Foundation, Tokensoft Inc., Brickken Solutions SL, and Harbor Platform Inc and others.

  • March 2025: Securitize launched its innovative sToken Vault functionality, enhancing liquidity and composability of real-world assets (RWAs) in collaboration with Elixir's “deUSD RWA Institutional Program.

  • May 2025: Polymath launched a Gasless Transactions feature, removing the need for enterprises to hold or manage cryptocurrency to cover blockchain gas fees, thereby simplifying the issuance and management of security tokens.

  • May 2025: Chainlink partnered with Kinexys by J.P. Morgan and Ondo Finance to integrate bank payment rails into tokenized asset markets, facilitating real-time settlements.

Asset Tokenization Market Report Scope:
Report Attributes Details
Market Size in 2024 USD 2.06 Trillion 
Market Size by 2032 USD 41.94 Trillion 
CAGR CAGR of 45.83% From 2025 to 2032
Base Year 2024
Forecast Period 2025-2032
Historical Data 2021-2023
Report Scope & Coverage Market Size, Segments Analysis, Competitive Landscape, Regional Analysis, DROC & SWOT Analysis, Forecast Outlook
Key Segments • By Asset Type (Real Estate, Debt, Investment Funds, Private Equity, Public Equity, Other Types)
• By End-user Vertical (Institutional Investors, Retail Investors)
Regional Analysis/Coverage North America (US, Canada, Mexico), Europe (Germany, France, UK, Italy, Spain, Poland, Turkey, Rest of Europe), Asia Pacific (China, India, Japan, South Korea, Singapore, Australia, Rest of Asia Pacific), Middle East & Africa (UAE, Saudi Arabia, Qatar, South Africa, Rest of Middle East & Africa), Latin America (Brazil, Argentina, Rest of Latin America)
Company Profiles Securitize Markets, LLC, tZERO Technologies, SoluLab Inc., Blocktunix Inc., Block Gemini Inc., Polymath Research Inc., Chainlink Foundation, Tokensoft Inc., Brickken Solutions SL, Harbor Platform Inc

Frequently Asked Questions

Ans: The Asset Tokenization Market is expected to grow at a CAGR of 45.83% from 2025 to 2032, driven by rising institutional and retail adoption.

Ans: In 2024, the Asset Tokenization Market was valued at USD 2.06 trillion, highlighting early adoption and accelerating demand for digital asset infrastructure.

Ans: Blockchain’s ability to offer security, transparency, compliance, and operational efficiency is the key factor accelerating institutional interest and market expansion globally.

Ans: Real estate dominated in 2024 with a 34% revenue share, due to demand for liquidity, fractional ownership, and easier global investor access.

Ans: North America led with a 39% revenue share in 2024, driven by advanced financial systems, early blockchain adoption, and regulatory support.

Table of Contents

1. Introduction

1.1 Market Definition

1.2 Scope (Inclusion and Exclusions)

1.3 Research Assumptions

2. Executive Summary

2.1 Market Overview        

2.2 Regional Synopsis

2.3 Competitive Summary

3. Research Methodology

3.1 Top-Down Approach

3.2 Bottom-up Approach

3.3. Data Validation

3.4 Primary Interviews

4. Market Dynamics Impact Analysis

4.1 Market Driving Factors Analysis

4.1.2 Drivers

4.1.2 Restraints

4.1.3 Opportunities

4.1.4 Challenges

4.2 PESTLE Analysis

4.3 Porter’s Five Forces Model

5. Statistical Insights and Trends Reporting

5.1 Tokenized Asset Volume

5.2 Blockchain Utilization Rate

5.3 Time to Tokenization

5.4 Smart Contract Deployment Stats

5.5 Security Incidents

5.6 Cross-Border Token Transfers

6. Competitive Landscape

6.1 List of Major Companies By Region

6.2 Market Share Analysis By Region

6.3 Product Benchmarking

6.3.1 Product specifications and features

6.3.2 Pricing

6.4 Strategic Initiatives

6.4.1 Marketing and promotional activities

6.4.2 Distribution and Supply Chain Strategies

6.4.3 Expansion Plans and New Product Launches

6.4.4 Strategic partnerships and collaborations

6.5 Technological Advancements

6.6 Market Positioning and Branding

7. Asset Tokenization Market Segmentation By Asset Type

7.1 Chapter Overview

7.2 Real Estate

        7.2.1 Real Estate Trend Analysis (2021-2032)

7.2.2 Real Estate Market Size Estimates and Forecasts to 2032 (USD Trillion)

7.3 Debt

       7.3.1 Debt Market Trends Analysis (2021-2032)

       7.3.2 Debt Market Size Estimates and Forecasts to 2032 (USD Trillion)

7.4 Investment Funds

       7.4.1 Investment Funds Market Trends Analysis (2021-2032)

       7.4.2 Investment Funds Market Size Estimates and Forecasts to 2032 (USD Trillion)

7.5 Private Equity

        7.5.1 Private Equity Trend Analysis (2021-2032)

7.5.2 Private Equity Market Size Estimates and Forecasts to 2032 (USD Trillion)

7.6 Public Equity

       7.6.1 Public Equity Market Trends Analysis (2021-2032)

       7.6.2 Public Equity Market Size Estimates and Forecasts to 2032 (USD Trillion)

7.7 Other Types

       7.7.1 Other Types Funds Market Trends Analysis (2021-2032)

       7.7.2 Other Types Funds Market Size Estimates and Forecasts to 2032 (USD Trillion)

8. Asset Tokenization Market Segmentation By End-user Vertical

8.1 Chapter Overview

8.2 Institutional Investors

        8.2.1 Institutional Investors Market Trends Analysis (2021-2032)

8.2.2 Institutional Investors Market Size Estimates and Forecasts to 2032 (USD Trillion)

8.3 Retail Investors

      8.3.1 Retail Investors Market Trends Analysis (2021-2032)

      8.3.2 Retail Investors Market Size Estimates and Forecasts to 2032 (USD Trillion)

9. Regional Analysis

     9.1 Chapter Overview

     9.2 North America

9.2.1 Trends Analysis

9.2.2 North America Asset Tokenization Market Estimates and Forecasts, by Country (2021-2032) (USD Trillion)

9.2.3 North America Asset Tokenization Market Estimates and Forecasts, By Asset Type (2021-2032) (USD Trillion) 

9.2.4 North America Asset Tokenization Market Estimates and Forecasts, By End-user Vertical (2021-2032) (USD Trillion)

9.2.5 USA

9.2.5.1 USA Asset Tokenization Market Estimates and Forecasts, By Asset Type (2021-2032) (USD Trillion)

9.2.5.2 USA Asset Tokenization Market Estimates and Forecasts, By End-user Vertical (2021-2032) (USD Trillion)

9.2.6 Canada

9.2.6.1 Canada Asset Tokenization Market Estimates and Forecasts, By Asset Type (2021-2032) (USD Trillion)

9.2.6.2 Canada Asset Tokenization Market Estimates and Forecasts, By End-user Vertical (2021-2032) (USD Trillion)

9.2.7 Mexico

9.2.7.1 Mexico Asset Tokenization Market Estimates and Forecasts, By Asset Type (2021-2032) (USD Trillion)

9.2.7.2 Mexico Asset Tokenization Market Estimates and Forecasts, By End-user Vertical (2021-2032) (USD Trillion)

9.3 Europe

9.3.1 Trends Analysis

9.3.2 Europe Asset Tokenization Market Estimates and Forecasts, by Country (2021-2032) (USD Trillion)

9.3.3 Europe Asset Tokenization Market Estimates and Forecasts, By Asset Type (2021-2032) (USD Trillion) 

9.3.4 Europe Asset Tokenization Market Estimates and Forecasts, By End-user Vertical (2021-2032) (USD Trillion)

9.3.5 Germany

9.3.5.1 Germany Asset Tokenization Market Estimates and Forecasts, By Asset Type (2021-2032) (USD Trillion)

9.3.5.2 Germany Asset Tokenization Market Estimates and Forecasts, By End-user Vertical (2021-2032) (USD Trillion)

9.3.6 France

9.3.6.1 France Asset Tokenization Market Estimates and Forecasts, By Asset Type (2021-2032) (USD Trillion)

9.3.6.2 France Asset Tokenization Market Estimates and Forecasts, By End-user Vertical (2021-2032) (USD Trillion)

9.3.7 UK

9.3.7.1 UK Asset Tokenization Market Estimates and Forecasts, By Asset Type (2021-2032) (USD Trillion)

9.3.7.2 UK Asset Tokenization Market Estimates and Forecasts, By End-user Vertical (2021-2032) (USD Trillion)

9.3.8 Italy

9.3.8.1 Italy Asset Tokenization Market Estimates and Forecasts, By Asset Type (2021-2032) (USD Trillion)

9.3.8.2 Italy Asset Tokenization Market Estimates and Forecasts, By End-user Vertical (2021-2032) (USD Trillion)

9.3.9 Spain

9.3.9.1 Spain Asset Tokenization Market Estimates and Forecasts, By Asset Type (2021-2032) (USD Trillion)

9.3.9.2 Spain Asset Tokenization Market Estimates and Forecasts, By End-user Vertical (2021-2032) (USD Trillion)

9.3.10 Poland

9.3.10.1 Poland Asset Tokenization Market Estimates and Forecasts, By Asset Type (2021-2032) (USD Trillion)

9.3.10.2 Poland Asset Tokenization Market Estimates and Forecasts, By End-user Vertical (2021-2032) (USD Trillion)

9.3.11 Turkey

9.3.11.1 Turkey Asset Tokenization Market Estimates and Forecasts, By Asset Type (2021-2032) (USD Trillion)

9.3.11.2 Turkey Asset Tokenization Market Estimates and Forecasts, By End-user Vertical (2021-2032) (USD Trillion)

9.3.12 Rest of Europe

9.3.12.1 Rest of Europe Asset Tokenization Market Estimates and Forecasts, By Asset Type (2021-2032) (USD Trillion)

9.3.12.2 Rest of Europe Asset Tokenization Market Estimates and Forecasts, By End-user Vertical (2021-2032) (USD Trillion)

9.4 Asia Pacific

9.4.1 Trends Analysis

9.4.2 Asia Pacific Asset Tokenization Market Estimates and Forecasts, by Country (2021-2032) (USD Trillion)

9.4.3 Asia Pacific Asset Tokenization Market Estimates and Forecasts, By Asset Type (2021-2032) (USD Trillion) 

9.4.4 Asia Pacific Asset Tokenization Market Estimates and Forecasts, By End-user Vertical (2021-2032) (USD Trillion)

9.4.5 China

9.4.5.1 China Asset Tokenization Market Estimates and Forecasts, By Asset Type (2021-2032) (USD Trillion)

9.4.5.2 China Asset Tokenization Market Estimates and Forecasts, By End-user Vertical (2021-2032) (USD Trillion)

9.4.6 India

9.4.5.1 India Asset Tokenization Market Estimates and Forecasts, By Asset Type (2021-2032) (USD Trillion)

9.4.5.2 India Asset Tokenization Market Estimates and Forecasts, By End-user Vertical (2021-2032) (USD Trillion)

9.4.5 Japan

9.4.5.1 Japan Asset Tokenization Market Estimates and Forecasts, By Asset Type (2021-2032) (USD Trillion)

9.4.5.2 Japan Asset Tokenization Market Estimates and Forecasts, By End-user Vertical (2021-2032) (USD Trillion)

9.4.6 South Korea

9.4.6.1 South Korea Asset Tokenization Market Estimates and Forecasts, By Asset Type (2021-2032) (USD Trillion)

9.4.6.2 South Korea Asset Tokenization Market Estimates and Forecasts, By End-user Vertical (2021-2032) (USD Trillion)

9.4.7 Singapore

9.4.7.1 Singapore Asset Tokenization Market Estimates and Forecasts, By Asset Type (2021-2032) (USD Trillion)

9.4.7.2 Singapore Asset Tokenization Market Estimates and Forecasts, By End-user Vertical (2021-2032) (USD Trillion)

8.4.8 Australia

8.4.8.1 Australia Asset Tokenization Market Estimates and Forecasts, By Asset Type (2021-2032) (USD Trillion)

8.4.8.2 Australia Asset Tokenization Market Estimates and Forecasts, By End-user Vertical (2021-2032) (USD Trillion)

9.4.9 Rest of Asia Pacific

9.4.9.1 Rest of Asia Pacific Asset Tokenization Market Estimates and Forecasts, By Asset Type (2021-2032) (USD Trillion)

9.4.9.2 Rest of Asia Pacific Asset Tokenization Market Estimates and Forecasts, By End-user Vertical (2021-2032) (USD Trillion)

9.5 Middle East & Africa

9.5.1 Trends Analysis

9.5.2 Middle East & Africa Asset Tokenization Market Estimates and Forecasts, by Country (2021-2032) (USD Trillion)

9.5.3 Middle East & Africa Asset Tokenization Market Estimates and Forecasts, By Asset Type (2021-2032) (USD Trillion) 

9.5.4 Middle East & Africa Asset Tokenization Market Estimates and Forecasts, By End-user Vertical (2021-2032) (USD Trillion)

9.5.5 UAE

9.5.5.1 UAE Asset Tokenization Market Estimates and Forecasts, By Asset Type (2021-2032) (USD Trillion)

9.5.5.2 UAE Asset Tokenization Market Estimates and Forecasts, By End-user Vertical (2021-2032) (USD Trillion)

9.5.6 Saudi Arabia

9.5.6.1 Saudi Arabia Asset Tokenization Market Estimates and Forecasts, By Asset Type (2021-2032) (USD Trillion)

9.5.6.2 Saudi Arabia Asset Tokenization Market Estimates and Forecasts, By End-user Vertical (2021-2032) (USD Trillion)

9.5.7 Qatar

9.5.7.1 Qatar Asset Tokenization Market Estimates and Forecasts, By Asset Type (2021-2032) (USD Trillion)

9.5.7.2 Qatar Asset Tokenization Market Estimates and Forecasts, By End-user Vertical (2021-2032) (USD Trillion)

9.5.8 South Africa

9.5.8.1 South Africa Asset Tokenization Market Estimates and Forecasts, By Asset Type (2021-2032) (USD Trillion)

9.5.8.2 South Africa Asset Tokenization Market Estimates and Forecasts, By End-user Vertical (2021-2032) (USD Trillion)

9.5.9 Middle East & Africa

9.5.9.1 Middle East & Africa Asset Tokenization Market Estimates and Forecasts, By Asset Type (2021-2032) (USD Trillion)

9.5.9.2 Middle East & Africa Asset Tokenization Market Estimates and Forecasts, By End-user Vertical (2021-2032) (USD Trillion)

9.6 Latin America

9.6.1 Trends Analysis

9.6.2 Latin America Asset Tokenization Market Estimates and Forecasts, by Country (2021-2032) (USD Trillion)

9.6.3 Latin America Asset Tokenization Market Estimates and Forecasts, By Asset Type (2021-2032) (USD Trillion) 

9.6.4 Latin America Asset Tokenization Market Estimates and Forecasts, By End-user Vertical (2021-2032) (USD Trillion)

9.6.5 Brazil

9.6.5.1 Brazil Asset Tokenization Market Estimates and Forecasts, By Asset Type (2021-2032) (USD Trillion)

9.6.5.2 Brazil Asset Tokenization Market Estimates and Forecasts, By End-user Vertical (2021-2032) (USD Trillion)

9.6.6 Argentina

9.6.6.1 Argentina Asset Tokenization Market Estimates and Forecasts, By Asset Type (2021-2032) (USD Trillion)

9.6.6.2 Argentina Asset Tokenization Market Estimates and Forecasts, By End-user Vertical (2021-2032) (USD Trillion)

9.6.7 Rest of Latin America

9.6.7.1 Rest of Latin America Asset Tokenization Market Estimates and Forecasts, By Asset Type (2021-2032) (USD Trillion)

9.6.7.2 Rest of Latin America Asset Tokenization Market Estimates and Forecasts, By End-user Vertical (2021-2032) (USD Trillion)

10. Company Profiles

           10.1 Securitize Markets

                          10.1.1 Company Overview

10.1.2 Financial

10.1.3 Product / Services Offered

10.1.4 SWOT Analysis

           10.2 tZERO Technologies

                           10.2.1 Company Overview

10.2.2 Financial

10.2.3 Product/ Services Offered

10.2.4 SWOT Analysis

10.3 SoluLab Inc

              10.3.1 Company Overview

10.3.2 Financial

10.3.3 Product/ Services Offered

10.3.4 SWOT Analysis

10.4 Blocktunix Inc

             10.4.1 Company Overview

10.4.2 Financial

10.4.3 Product/ Services Offered

10.4.4 SWOT Analysis

10.5 Block Gemini Inc

             10.5.1 Company Overview

10.5.2 Financial

10.5.3 Product/ Services Offered

10.5.4 SWOT Analysis

10.6 Polymath Research Inc

             10.6.1 Company Overview

10.6.2 Financial

10.6.3 Product/ Services Offered

10.6.4 SWOT Analysis

10.7 Chainlink Foundation

             10.7.1 Company Overview

10.7.2 Financial

10.7.3 Product/ Services Offered

10.7.4 SWOT Analysis

10.8 Tokensoft Inc

             10.8.1 Company Overview

10.8.2 Financial

10.8.3 Product/ Services Offered

10.8.4 SWOT Analysis

10.9 Brickken Solutions SL

             10.9.1 Company Overview

10.9.2 Financial

10.9.3 Product/ Services Offered

10.9.4 SWOT Analysis

10.10 Harbor Platform Inc

             10.10.1 Company Overview

10.10.2 Financial

10.10.3 Product/ Services Offered

10.10.4 SWOT Analysis

11. Use Cases and Best Practices

12. Conclusion

An accurate research report requires proper strategizing as well as implementation. There are multiple factors involved in the completion of good and accurate research report and selecting the best methodology to compete the research is the toughest part. Since the research reports we provide play a crucial role in any company’s decision-making process, therefore we at SNS Insider always believe that we should choose the best method which gives us results closer to reality. This allows us to reach at a stage wherein we can provide our clients best and accurate investment to output ratio.

Each report that we prepare takes a timeframe of 350-400 business hours for production. Starting from the selection of titles through a couple of in-depth brain storming session to the final QC process before uploading our titles on our website we dedicate around 350 working hours. The titles are selected based on their current market cap and the foreseen CAGR and growth.


The 5 steps process:

Step 1: Secondary Research:

Secondary Research or Desk Research is as the name suggests is a research process wherein, we collect data through the readily available information. In this process we use various paid and unpaid databases which our team has access to and gather data through the same. This includes examining of listed companies’ annual reports, Journals, SEC filling etc. Apart from this our team has access to various associations across the globe across different industries. Lastly, we have exchange relationships with various university as well as individual libraries.

Secondary Research

Step 2: Primary Research

When we talk about primary research, it is a type of study in which the researchers collect relevant data samples directly, rather than relying on previously collected data.  This type of research is focused on gaining content specific facts that can be sued to solve specific problems. Since the collected data is fresh and first hand therefore it makes the study more accurate and genuine.

We at SNS Insider have divided Primary Research into 2 parts.

Part 1 wherein we interview the KOLs of major players as well as the upcoming ones across various geographic regions. This allows us to have their view over the market scenario and acts as an important tool to come closer to the accurate market numbers. As many as 45 paid and unpaid primary interviews are taken from both the demand and supply side of the industry to make sure we land at an accurate judgement and analysis of the market.

This step involves the triangulation of data wherein our team analyses the interview transcripts, online survey responses and observation of on filed participants. The below mentioned chart should give a better understanding of the part 1 of the primary interview.

Primary Research

Part 2: In this part of primary research the data collected via secondary research and the part 1 of the primary research is validated with the interviews from individual consultants and subject matter experts.

Consultants are those set of people who have at least 12 years of experience and expertise within the industry whereas Subject Matter Experts are those with at least 15 years of experience behind their back within the same space. The data with the help of two main processes i.e., FGDs (Focused Group Discussions) and IDs (Individual Discussions). This gives us a 3rd party nonbiased primary view of the market scenario making it a more dependable one while collation of the data pointers.

Step 3: Data Bank Validation

Once all the information is collected via primary and secondary sources, we run that information for data validation. At our intelligence centre our research heads track a lot of information related to the market which includes the quarterly reports, the daily stock prices, and other relevant information. Our data bank server gets updated every fortnight and that is how the information which we collected using our primary and secondary information is revalidated in real time.

Data Bank Validation

Step 4: QA/QC Process

After all the data collection and validation our team does a final level of quality check and quality assurance to get rid of any unwanted or undesired mistakes. This might include but not limited to getting rid of the any typos, duplication of numbers or missing of any important information. The people involved in this process include technical content writers, research heads and graphics people. Once this process is completed the title gets uploader on our platform for our clients to read it.

Step 5: Final QC/QA Process:

This is the last process and comes when the client has ordered the study. In this process a final QA/QC is done before the study is emailed to the client. Since we believe in giving our clients a good experience of our research studies, therefore, to make sure that we do not lack at our end in any way humanly possible we do a final round of quality check and then dispatch the study to the client.

Key Segments: 

By Asset Type

  • Real Estate

  • Debt

  • Investment Funds

  • Private Equity

  • Public Equity

  • Other Types

By End-user Vertical

  • Institutional Investors

  • Retail Investors

Request for Segment Customization as per your Business Requirement: Segment Customization Request

Regional Coverage: 

North America

  • US

  • Canada

  • Mexico

Europe

  • Germany

  • France

  • UK

  • Italy

  • Spain

  • Poland

  • Turkey

  • Rest of Europe

Asia Pacific

  • China

  • India

  • Japan

  • South Korea

  • Singapore

  • Australia

  • Rest of Asia Pacific

Middle East & Africa

  • UAE

  • Saudi Arabia

  • Qatar

  • South Africa

  • Rest of Middle East & Africa

Latin America

  • Brazil

  • Argentina

  • Rest of Latin America

Request for Country Level Research Report: Country Level Customization Request

Available Customization 

With the given market data, SNS Insider offers customization as per the company’s specific needs. The following customization options are available for the report: 

  • Detailed Volume Analysis 

  • Criss-Cross segment analysis (e.g. Product X Application) 

  • Competitive Product Benchmarking 

  • Geographic Analysis 

  • Additional countries in any of the regions 

  • Customized Data Representation 

  • Detailed analysis and profiling of additional market player

Explore Key Insights 


  • Analyzes market trends, forecasts, and regional dynamics
  • Covers core offerings, innovations, and industry use cases
  • Profiles major players, value chains, and strategic developments
  • Highlights innovation trends, regulatory impacts, and growth opportunities
Request an Analyst Call