image

Voice User Interface Market Report Scope & Overview:

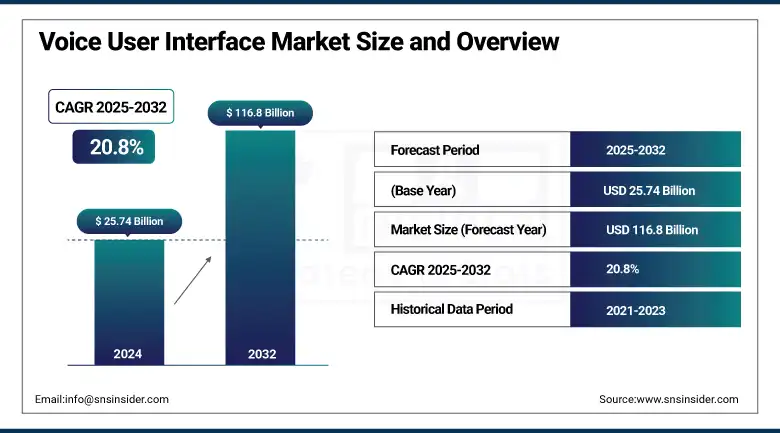
The voice user interface market size was valued at USD 25.74 billion in 2024 and is projected to reach USD 116.8 billion by 2032, growing at a CAGR of 20.8% from 2025 to 2032.

The voice user interface market growth is propelling due to the surging demand for smart devices, along with rising integration in automotive systems, and the healthcare industry’s increasing reliance on AI-powered interfaces. VUIs offer intuitive interactions via AI and speech recognition technology. World-leading tech players including Apple, Google, and Amazon are dominating in terms of innovation in this industry. However, North America is currently holding the dominant market share and Asia Pacific is projected to be the fastest-growing region. In spite of facing hurdles including language barriers and privacy concerns, the rising number of VUI applications in the automotive and healthcare industries highlights a promising growth opportunity for VUI incorporation in the market.

As per PWC, over 71% of consumers favor voice search over typing, with more than 60% of smart home users relying on voice commands, and 53% of smart speaker owners using voice assistants daily.

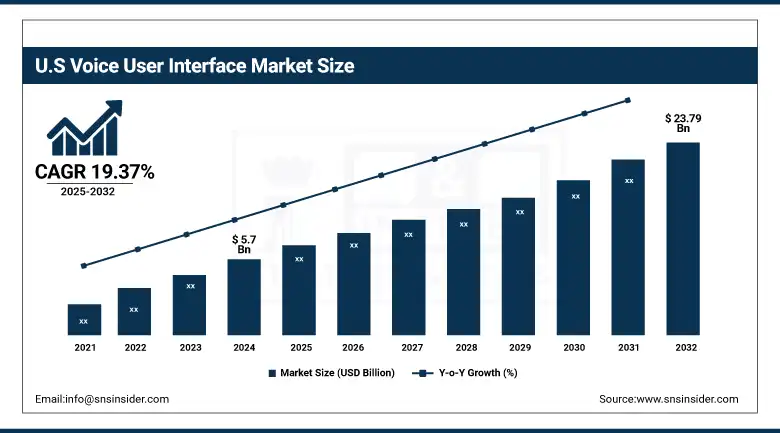
The U.S voice user interface market accounted for USD 5.7 billion in 2024 and is projected to reach USD 23.79 billion by 2032 burgeoning at a CAGR of 19.37 % during 2025-2032.
This expansion is driven by the early adoption of technology, a well-connected populace, and significant investments in artificial intelligence and voice-activated platforms. The U.S. continues to lead the market due to the presence of major technology companies, such as Google, Amazon, Apple, which are continuously promoting innovation and the VUI technology installation in enterprise solutions, automotive systems, smart homes, and healthcare industry.

Market Dynamics:

Drivers:

  • Increasing Integration of Voice Technology in Consumer Devices Fuels the Demand for Advanced Interaction Capabilities

The increasing incorporation of voice-enabled technologies into common consumer electronics, including smartphones, smart speakers, home automation systems, and wearable devices, significantly contributes to market expansion. Consumers are showing a growing preference for hands-free and intuitive interactions with their devices, leading manufacturers to focus on voice interfaces. Recent developments globally shows the introduction of generative AI-driven voice assistants and the voice AI application in new industries, such as healthcare monitoring and automotive infotainment, further showcasing the growing relevance and swift innovation that are influencing the demand for this technology. Current Voice User Interface Market Trends include the integration of generative AI, multilingual support, and use in emerging applications like healthcare documentation and automotive safety systems.

Hospitals using VUI for documentation see a 45–70% drop in physician burnout, while voice-powered EHRs cut patient documentation time by an average of 30% per interaction.

Restraints:

  • Lack of Multilingual and Contextual Understanding in Voice Interfaces Restricts Adoption Across Diverse User Bases

Despite significant progress, contemporary voice user interfaces continue to face challenges in comprehending various languages, regional dialects, and contextual nuances in speech. Misrecognition caused by background noise or accents frequently results in a subpar user experience, thereby reducing usability. The companies operating in global markets are currently witness challenges during the implementation of voice interfaces due to lack of contextual understanding. The lack of dependable multilingual support remains a restraint, particularly in areas including public services, healthcare, and education, where clear and inclusive communication is important.

Opportunities:

  • Surging Voice Interfaces' Use in Automotive and Healthcare Sectors Provide Substantial Growth Opportunities

Currently, the voice interfaces are largely adopted by the healthcare and automotive industries, which further create significant growth opportunities for stakeholders in the industries. In healthcare industry, the voice technology offer hands-free data entry, improve patient engagement, and allowing access for real-time documentation, further enhancing efficiency and decrease pressure on staff. In the automotive industry, voice control provide comfort and safety by offering media management, easy navigation, and control on vehicle functions. Several partnerships among medical technology players and voice AI developers and integration of sophisticated voice systems by many key companies for next-generation infotainment are also creating growth opportunities.

Challenges:

  • Surging Security and Privacy Concerns Regarding Voice Data can Challenge Market Expansion

One of the leading challenges affecting the market growth is the surging awareness related to data privacy and security in the voice-enabled systems. Users are becoming more cautious while using voice assistants, which might collect sensitive data without their consent. Voice data is vulnerable to breaches and misuse, industries are under regulatory and ethical scrutiny concerning the storage, processing, and sharing of such data. Notable incidents of unauthorized recordings and third-party access have heightened public anxiety. It is essential to tackle these challenges through strong encryption, clear policies, and adherence to global data protection regulations to preserve user trust and encourage sustained market adoption.

According to resources, approximately 41% of users are hesitating to adopt voice interfaces due to privacy worries, and just 28% users have trust in VUI technology providers for keeping the voice data secured.

Segmentation Analysis:

By Offering

The solutions segment leads the Voice User Interface (VUI) market, commanding a revenue share of 78.93% in 2024 owing to the surging consumer preference for voice-enabled devices that provide effortless interaction. The installation of voice recognition technology in smart home appliances, customer service automation, and infotainment systems, and customer service automation has influenced companies including Amazon with Alexa SDK and Google with Google Assistant to continuously refine their VUI offerings. Recent advancements include improvement of Siri's natural language processing capabilities by Apple and growth of Bixby by Samsung into a larger array of IoT-enabled devices.

The services segment is predicted to grow with the fastest CAGR of 21.99% during the forecast period due to rising enterprise adoption of voice AI consulting, integration, and support services. Businesses are increasingly seeking third-party service providers to implement voice capabilities into apps, websites, and customer-facing systems. Nuance Communications and IBM are the market players, which have broadened their portfolios by offering customized voice AI solutions for banking and healthcare industries.

By Application:

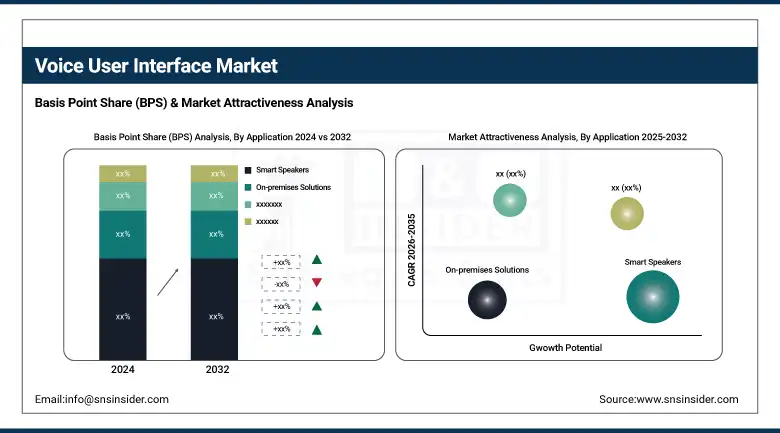
In 2024, the smart speakers segment led the market with a revenue share of 22.97%. The segment's dominance is driven by the wide usage of of devices, such as Google Nest, Amazon Echo, and Apple HomePod. There is a growing consumer preference for voice-activated interfaces to facilitate daily activities, manage smart home systems, and enjoy entertainment. Companies are consistently introducing multi-functional smart speakers that offer superior speech comprehension and integration features, demonstrating a robust demand for user-friendly, hands-free experiences that enhance consumer convenience and interaction.

The others segment is expected to grow at a CAGR of 22.66%. The segment's expansion is driven by the burgeoning demand for voice-enabled technology in non-traditional industries. In terms of education, voice user interfaces or VUIs substantially enhance learning accessibility, and in the manufacturing industry, these interfaces provide hands-free operation of equipment. Leading market players, such as SoundHound and Speechly are designing and developing modular voice platforms for specialized applications. The rising focus on inclusivity, productivity, and AI-driven automation is propelling the need for voice-enabled solutions beyond standard consumer electronics.

By Vertical

In 2024, the Consumer Electronics segment dominates the VUI market with a revenue share of 20.29%, driven by the widespread adoption of voice technology in smartphones, smart TVs, wearables, and home appliances. Major technology companies such as Apple, Samsung, and Xiaomi are incorporating sophisticated voice assistants into their latest product offerings to enhance user experience and accessibility. The rising consumer inclination towards voice-activated interfaces is further supported by advancements in edge AI, which enable quicker processing on devices. The growth of this segment is propelled by the need for intuitive control, personalization, and interconnected ecosystems, all of which contribute to improved user convenience and product value.

The healthcare and life sciences segment is projected to experience the fastest CAGR of 22.33%, primarily due to the increasing implementation of VUI technologies in clinical documentation, patient engagement, and workflow automation. Voice interfaces enable a reduction in manual data entry, along with promote hands-free operation in sterile settings, further improving patient accessibility. Companies including Nuance, a Microsoft subsidiary, and IBM Watson Health are developing HIPAA-compliant voice AI solutions designed for virtual assistant applications and electronic health records.

Regional Analysis:

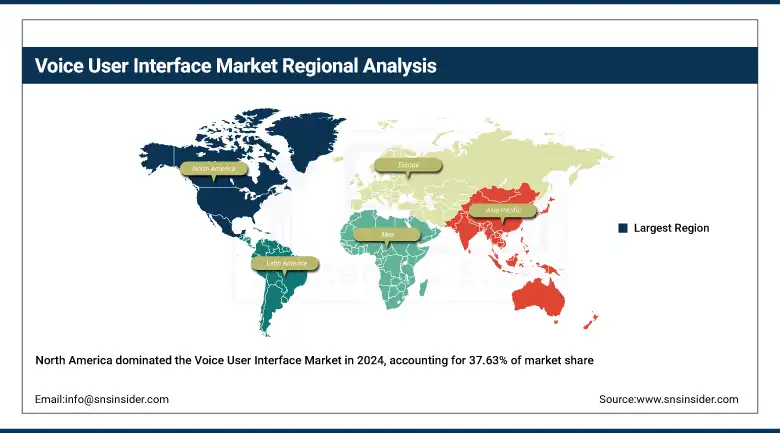
North America led the Voice User Interface Market Share in 2024 with a 37.63%. It is a well-established and technologically sophisticated market for voice user interface (VUI) technologies, propelled by the early embrace of smart devices, voice assistants, and AI-driven services. The growth of North America in the market is driven by the continuous innovation in VUI technologies, digital infrastructure, and high consumer awareness.
The U.S. is dominating the market due to its leading position in AI innovation, extensive use of smart devices, and its major influence on leading companies including Apple, Amazon, and Google in voice technologies' advancements.

The rising demand for automotive voice control systems, along with smart home technologies, and multiple-language voice support, is driving the market expansion in Europe. High concentration on sustainable innovation and support from regulatory frameworks boost the adoption of digital technologies across industries, including retail, transportation, and healthcare.

Germany is the leading country in Europe, propelled by its robust automotive industry that incorporates sophisticated voice assistants and a technologically advanced consumer demographic that is open to smart home and mobile VUI applications.

The Asia Pacific region is experiencing the most rapid growth with a CAGR of 22.05%, driven by swift urbanization, a rise in smartphone usage, and a flourishing consumer electronics sector. Nations within this region are making substantial investments in AI research and infrastructure, which is hastening the advancement and implementation of voice-enabled technologies across various industries.

China leads this trend with its quick adoption of smart technologies, robust governmental support for AI initiatives, and major companies such as Baidu and Alibaba pioneering voice-driven solutions for both consumers and businesses.

The Middle East & Africa and Latin America are witnessing a rise in VUI adoption, which was driven by the digital transformation efforts, along with enhanced internet connectivity, smart city projects, and increased investments in Internet of Things (IoT) and artificial intelligence. Voice interface technologies are frequently being utilized in the sectors, such as retail, healthcare, banking, and telecommunications for enhancing user interaction, convenience, and accessibility.

Key Players:

The major key players for the voice user interface market are Amazon, Inc., Apple, Inc., Baidu, Inc., Google LLC, IBM, Meta Platform, Inc., Nuance Communication, SAMSUNG, SoundHound AI Inc., Speechly, and others.

Recent Developments:

  • In January 2025, SoundHound AI introduced its generative AI-driven in-vehicle voice assistant at CES, demonstrating real-time voice responses that operate without cloud dependency, utilizing NVIDIA's DRIVE AGX platform.

  • In April 2025, Meta introduced its independent Meta AI application, which utilizes the Llama 4 model and includes voice interaction along with a social 'Discover' feed, thereby establishing itself as a direct rival to ChatGPT.

Voice User Interface Market Report Scope:

Report Attributes Details
Market Size in 2024 USD 25.74 Billion 
Market Size by 2032 USD 116.88 Billion 
CAGR CAGR of 20.8% From 2025 to 2032
Base Year 2024
Forecast Period 2025-2032
Historical Data 2021-2023
Report Scope & Coverage Market Size, Segments Analysis, Competitive Landscape, Regional Analysis, DROC & SWOT Analysis, Forecast Outlook
Key Segments • By Offering (Solution, Service)
• By Application (Smart Speakers, Interactive Voice Response, On-premises Solutions, Cloud Solutions, Voice-controlled Devices, Smartphones & Tablets, Others)
• By Vertical (BFSI, Retail & E-commerce, Consumer Electronic, Automotive & Transportation, Healthcare & Life Science, Travel & Hospitality, Government & Defense Sector, Others)
Regional Analysis/Coverage North America (US, Canada, Mexico), Europe (Germany, France, UK, Italy, Spain, Poland, Turkey, Rest of Europe), Asia Pacific (China, India, Japan, South Korea, Singapore, Australia, Rest of Asia Pacific), Middle East & Africa (UAE, Saudi Arabia, Qatar, South Africa, Rest of Middle East & Africa), Latin America (Brazil, Argentina, Rest of Latin America)
Company Profiles Amazon, Inc., Apple, Inc., Baidu, Inc., Google LLC, IBM, Meta Platform, Inc., Nuance Communication, SAMSUNG, SoundHound AI Inc., Speechly

Frequently Asked Questions

Ans: The Voice User Interface Market was valued at USD 25.74 billion in 2024 and is projected to reach USD 116.8 billion by 2032.

Ans: The Solutions segment led with a 78.93% revenue share in 2024, driven by demand for smart, hands-free, voice-enabled consumer devices.

Ans: Smart Speakers dominated with a 22.97% share in 2024, led by demand for devices like Amazon Echo, Google Nest, and Apple HomePod.

Ans: North America led with 37.63% market share in 2024, supported by early adoption, infrastructure, and leadership from Amazon, Google, and Apple.

Ans: Asia Pacific is growing fastest at a 22.05% CAGR, fueled by smartphone adoption, urbanization, and AI investment, especially in China.

Table of Contents

1. Introduction

1.1 Market Definition

1.2 Scope (Inclusion and Exclusions)

1.3 Research Assumptions

2. Executive Summary

2.1 Market Overview

2.2 Regional Synopsis

2.3 Competitive Summary

3. Research Methodology

3.1 Top-Down Approach

3.2 Bottom-up Approach

3.3. Data Validation

3.4 Primary Interviews

4. Market Dynamics Impact Analysis

4.1 Market Driving Factors Analysis

4.1.1 Drivers

4.1.2 Restraints

4.1.3 Opportunities

4.1.4 Challenges

4.2 PESTLE Analysis

4.3 Porter’s Five Forces Model

5. Statistical Insights and Trends Reporting

    5.1 Chipset Failure Rates and Reliability Metrics

    5.2 Energy Efficiency Metrics

   5.3 Scalability Metrics

   5.4 Supply Chain Impact Data

6. Competitive Landscape

6.1 List of Major Companies, By Region

6.2 Market Share Analysis, By Region

6.3 Product Benchmarking

6.3.1 Product specifications and features

6.3.2 Pricing

6.4 Strategic Initiatives

6.4.1 Marketing and promotional activities

6.4.2 Distribution and Supply Chain Strategies

6.4.3 Expansion plans and new Product launches

6.4.4 Strategic partnerships and collaborations

6.5 Technological Advancements

6.6 Market Positioning and Branding

7. Voice User Interface Market Segmentation By Offering

7.1 Chapter Overview

7.2 Solution

7.2.1 Solution Market Trends Analysis (2020-2032)

7.2.2 Solution Market Size Estimates and Forecasts to 2032 (USD Billion)

7.3 Service

     7.3.1 Service Market Trends Analysis (2020-2032)

           7.3.2 Service Market Size Estimates and Forecasts to 2032 (USD Billion)

8. Voice User Interface Market Segmentation By Application

8.1 Chapter Overview

8.2 Smart Speakers

     8.2.1 Smart Speakers Market Trend Analysis (2020-2032)

           8.2.2 Smart Speakers Market Size Estimates and Forecasts to 2032 (USD Billion)

8.3 Interactive Voice Response

      8.3.1 Interactive Voice Response Market Trends Analysis (2020-2032)

           8.3.2 Interactive Voice Response Market Size Estimates and Forecasts to 2032 (USD Billion)

8.4 On-premises Solutions

      8.4.1 On-premises Solutions Market Trends Analysis (2020-2032)

           8.4.2 On-premises Solutions Market Size Estimates and Forecasts to 2032 (USD Billion)

8.5 Cloud Solutions

      8.5.1 Cloud Solutions Market Trends Analysis (2020-2032)

           8.5.2 Cloud Solutions Market Size Estimates and Forecasts to 2032 (USD Billion)

8.6 Voice-controlled Devices

      8.6.1 Voice-controlled Devices Market Trends Analysis (2020-2032)

           8.6.2 Voice-controlled Devices Market Size Estimates and Forecasts to 2032 (USD Billion)

8.7 Smartphones & Tablets

      8.7.1 Smartphones & Tablets Market Trends Analysis (2020-2032)

           8.7.2 Smartphones & Tablets Market Size Estimates and Forecasts to 2032 (USD Billion)

8.8 Others

      8.8.1 Others Market Trends Analysis (2020-2032)

           8.8.2 Others Market Size Estimates and Forecasts to 2032 (USD Billion)

9. Voice User Interface Market Segmentation By Vertical

9.1 Chapter Overview

9.2 BFSI

        9.2.1 BFSI Market Trends Analysis (2020-2032)

9.2.2 BFSI Market Size Estimates and Forecasts to 2032 (USD Billion)

9.3 Retail & E-commerce

        9.3.1 Retail & E-commerce Market Trends Analysis (2020-2032)

9.3.2 Retail & E-commerce Market Size Estimates and Forecasts to 2032 (USD Billion)

9.4 Consumer Electronic

        9.4.1 Consumer Electronic Market Trends Analysis (2020-2032)

9.4.2 Consumer Electronic Market Size Estimates and Forecasts to 2032 (USD Billion)

9.5 Automotive & Transportation

        9.5.1 Automotive & Transportation Market Trends Analysis (2020-2032)

9.5.2 Automotive & Transportation Market Size Estimates and Forecasts to 2032 (USD Billion)

9.6 Healthcare & Life Science

        9.6.1 Healthcare & Life Science Market Trends Analysis (2020-2032)

9.6.2 Healthcare & Life Science Market Size Estimates and Forecasts to 2032 (USD Billion)

9.7 Travel & Hospitality

        9.7.1 Travel & Hospitality Market Trends Analysis (2020-2032)

9.7.2 Travel & Hospitality Market Size Estimates and Forecasts to 2032 (USD Billion)

9.8 Government & Defense Sector

        9.8.1 Government & Defense Sector Market Trends Analysis (2020-2032)

9.8.2 Government & Defense Sector Market Size Estimates and Forecasts to 2032 (USD Billion)

9.9 Others

        9.9.1 Others Market Trends Analysis (2020-2032)

9.9.2 Others Market Size Estimates and Forecasts to 2032 (USD Billion)

10. Regional Analysis

10.1 Chapter Overview

10.2 North America

10.2.1 Trends Analysis

10.2.2 North America Voice User Interface Market Estimates and Forecasts, by Country (2020-2032) (USD Billion)

10.2.3 North America Voice User Interface Market Estimates and Forecasts, By Offering (2020-2032) (USD Billion) 

10.2.4 North America Voice User Interface Market Estimates and Forecasts, By Application (2020-2032) (USD Billion)

10.2.5 North America Voice User Interface Market Estimates and Forecasts, By Vertical  (2020-2032) (USD Billion)

10.2.6 USA

10.2.6.1 USA Voice User Interface Market Estimates and Forecasts, By Offering (2020-2032) (USD Billion)

10.2.6.2 USA Voice User Interface Market Estimates and Forecasts, By Application (2020-2032) (USD Billion)

10.2.6.3 USA Voice User Interface Market Estimates and Forecasts, By Vertical  (2020-2032) (USD Billion)

10.2.7 Canada

10.2.7.1 Canada Voice User Interface Market Estimates and Forecasts, By Offering (2020-2032) (USD Billion)

10.2.7.2 Canada Voice User Interface Market Estimates and Forecasts, By Application (2020-2032) (USD Billion)

10.2.7.3 Canada Voice User Interface Market Estimates and Forecasts, By Vertical  (2020-2032) (USD Billion)

10.2.8 Mexico

10.2.8.1 Mexico Voice User Interface Market Estimates and Forecasts, By Offering (2020-2032) (USD Billion)

10.2.8.2 Mexico Voice User Interface Market Estimates and Forecasts, By Application (2020-2032) (USD Billion)

10.2.8.3 Mexico Voice User Interface Market Estimates and Forecasts, By Vertical  (2020-2032) (USD Billion)

10.3 Europe

10.3.1 Trends Analysis

10.3.2 Europe Voice User Interface Market Estimates and Forecasts, by Country (2020-2032) (USD Billion)

10.3.3 Europe Voice User Interface Market Estimates and Forecasts, By Offering (2020-2032) (USD Billion) 

10.3.4 Europe Voice User Interface Market Estimates and Forecasts, By Application (2020-2032) (USD Billion)

10.3.5 Europe Voice User Interface Market Estimates and Forecasts, By Vertical (2020-2032) (USD Billion)

10.3.6 Germany

10.3.1.6.1 Germany Voice User Interface Market Estimates and Forecasts, By Offering (2020-2032) (USD Billion)

10.3.1.6.2 Germany Voice User Interface Market Estimates and Forecasts, By Application (2020-2032) (USD Billion)

10.3.1.6.3 Germany Voice User Interface Market Estimates and Forecasts, By Vertical  (2020-2032) (USD Billion)

10.3.7 France

10.3.7.1 France Voice User Interface Market Estimates and Forecasts, By Offering (2020-2032) (USD Billion)

10.3.7.2 France a Voice User Interface Market Estimates and Forecasts, By Application (2020-2032) (USD Billion)

10.3.7.3 France Voice User Interface Market Estimates and Forecasts, By Vertical  (2020-2032) (USD Billion)

10.3.8 UK

10.3.8.1 UK Voice User Interface Market Estimates and Forecasts, By Offering (2020-2032) (USD Billion)

10.3.8.2 UK Voice User Interface Market Estimates and Forecasts, By Application (2020-2032) (USD Billion)

10.3.8.3 UK Voice User Interface Market Estimates and Forecasts, By Vertical  (2020-2032) (USD Billion)

10.3.9 Italy

10.3.9.1 Italy Voice User Interface Market Estimates and Forecasts, By Offering (2020-2032) (USD Billion)

10.3.9.2 Italy Voice User Interface Market Estimates and Forecasts, By Application (2020-2032) (USD Billion)

10.3.9.3 Italy Voice User Interface Market Estimates and Forecasts, By Vertical  (2020-2032) (USD Billion)

10.3.10 Spain

10.3.10.1 Spain Voice User Interface Market Estimates and Forecasts, By Offering (2020-2032) (USD Billion)

10.3.10.2 Spain Voice User Interface Market Estimates and Forecasts, By Application (2020-2032) (USD Billion)

10.3.10.3 Spain Voice User Interface Market Estimates and Forecasts, By Vertical  (2020-2032) (USD Billion)

10.3.12 Poland

10.3.12.1 Poland Voice User Interface Market Estimates and Forecasts, by Country (2020-2032) (USD Billion)

10.3.12.1 Poland Voice User Interface Market Estimates and Forecasts, By Offering (2020-2032) (USD Billion) 

10.3.12.3 Poland Voice User Interface Market Estimates and Forecasts, By Application (2020-2032) (USD Billion)

10.3.12.3 Poland Voice User Interface Market Estimates and Forecasts, By Vertical  (2020-2032) (USD Billion)

10.3.13 Turkey

10.3.13.1 Turkey Voice User Interface Market Estimates and Forecasts, By Offering (2020-2032) (USD Billion)

10.3.13.2 Turkey Voice User Interface Market Estimates and Forecasts, By Application (2020-2032) (USD Billion)

10.3.13.3 Turkey Voice User Interface Market Estimates and Forecasts, By Vertical  (2020-2032) (USD Billion)

10.3.14 Rest of Europe

10.3.14.1 Rest of Europe Voice User Interface Market Estimates and Forecasts, By Offering (2020-2032) (USD Billion)

10.3.14.2 Rest of Europe Voice User Interface Market Estimates and Forecasts, By Application (2020-2032) (USD Billion)

10.3.14.3 Rest of Europe Voice User Interface Market Estimates and Forecasts, By Vertical (2020-2032) (USD Billion)

10.4 Asia-Pacific

10.4.1 Trends Analysis

  10.4.2 Asia-Pacific Voice User Interface Market Estimates and Forecasts, by Country (2020-2032) (USD Billion)

 10.4.3 Asia-Pacific Voice User Interface Market Estimates and Forecasts, By Offering (2020-2032) (USD Billion) 

 10.4.4 Asia-Pacific Voice User Interface Market Estimates and Forecasts, By Application (2020-2032) (USD Billion)

 10.4.5 Asia-Pacific Voice User Interface Market Estimates and Forecasts, By Vertical  (2020-2032) (USD Billion)

10.4.6 China

10.4.6.1 China Voice User Interface Market Estimates and Forecasts, By Offering (2020-2032) (USD Billion)

10.4.6.2 China Voice User Interface Market Estimates and Forecasts, By Application (2020-2032) (USD Billion)

10.4.6.3 China Voice User Interface Market Estimates and Forecasts, By Vertical  (2020-2032) (USD Billion)

10.4.7 India

10.4.7.1 India Voice User Interface Market Estimates and Forecasts, By Offering (2020-2032) (USD Billion)

10.4.7.2 India Voice User Interface Market Estimates and Forecasts, By Application (2020-2032) (USD Billion)

10.4.7.3 India Voice User Interface Market Estimates and Forecasts, By Vertical  (2020-2032) (USD Billion)

10.4.8 Japan

10.4.8.1 Japan Voice User Interface Market Estimates and Forecasts, By Offering (2020-2032) (USD Billion)

10.4.8.2 Japan Voice User Interface Market Estimates and Forecasts, By Application (2020-2032) (USD Billion)

10.4.8.3 Japan Voice User Interface Market Estimates and Forecasts, By Vertical  (2020-2032) (USD Billion)

10.4.9 South Korea

10.4.9.1 South Korea Voice User Interface Market Estimates and Forecasts, By Offering (2020-2032) (USD Billion)

10.4.9.2 South Korea Voice User Interface Market Estimates and Forecasts, By Application (2020-2032) (USD Billion)

10.4.9.3 South Korea Voice User Interface Market Estimates and Forecasts, By Vertical  (2020-2032) (USD Billion)

10.4.10 Singapore

10.4.10.1 Singapore Voice User Interface Market Estimates and Forecasts, By Offering (2020-2032) (USD Billion)

10.4.10.2 Singapore Voice User Interface Market Estimates and Forecasts, By Application (2020-2032) (USD Billion)

10.4.10.3 Singapore Voice User Interface Market Estimates and Forecasts, By Vertical  (2020-2032) (USD Billion)

10.4.11 Australia

10.4.11.1 Australia Voice User Interface Market Estimates and Forecasts, By Offering (2020-2032) (USD Billion)

10.4.11.2 Australia Voice User Interface Market Estimates and Forecasts, By Application (2020-2032) (USD Billion)

10.4.11.3 Australia Voice User Interface Market Estimates and Forecasts, By Vertical  (2020-2032) (USD Billion)

10.4.12 Taiwan

10.4.12.1 Taiwan Voice User Interface Market Estimates and Forecasts, By Offering (2020-2032) (USD Billion)

10.4.12.2 Taiwan Voice User Interface Market Estimates and Forecasts, By Application (2020-2032) (USD Billion)

10.4.12.3 Taiwan Voice User Interface Market Estimates and Forecasts, By Vertical  (2020-2032) (USD Billion)

10.4.13 Rest of Asia-Pacific

10.4.13.1 Rest of Asia-Pacific Voice User Interface Market Estimates and Forecasts, By Offering (2020-2032) (USD Billion)

10.4.13.2 Rest of Asia-Pacific Voice User Interface Market Estimates and Forecasts, By Application (2020-2032) (USD Billion)

10.4.13.3 Rest of Asia-Pacific Voice User Interface Market Estimates and Forecasts, By Vertical  (2020-2032) (USD Billion)

10.5 Middle East and Africa

10.5.1 Trends Analysis

10.5.2 Middle East and Africa East Voice User Interface Market Estimates and Forecasts, by Country (2020-2032) (USD Billion)

10.5.3Middle East and Africa Voice User Interface Market Estimates and Forecasts, By Offering (2020-2032) (USD Billion) 

10.5.4 Middle East and Africa Voice User Interface Market Estimates and Forecasts, By Application (2020-2032) (USD Billion)

10.5.5 Middle East and Africa Voice User Interface Market Estimates and Forecasts, By Vertical  (2020-2032) (USD Billion)

10.5.6 UAE

10.5.6.1 UAE Voice User Interface Market Estimates and Forecasts, By Offering (2020-2032) (USD Billion)

10.5.6.2 UAE Voice User Interface Market Estimates and Forecasts, By Application (2020-2032) (USD Billion)

10.5.6.3 UAE Voice User Interface Market Estimates and Forecasts, By Vertical  (2020-2032) (USD Billion)

10.5.7 Saudi Arabia

10.5.7.1 Saudi Arabia Voice User Interface Market Estimates and Forecasts, By Offering (2020-2032) (USD Billion)

10.5.7.2 Saudi Arabia Voice User Interface Market Estimates and Forecasts, By Application (2020-2032) (USD Billion)

10.5.7.3 Saudi Arabia Voice User Interface Market Estimates and Forecasts, By Vertical  (2020-2032) (USD Billion)

10.5.8 Qatar

10.5.8.1 Qatar Voice User Interface Market Estimates and Forecasts, By Offering (2020-2032) (USD Billion)

10.5.8.2 Qatar Voice User Interface Market Estimates and Forecasts, By Application (2020-2032) (USD Billion)

10.5.8.3 Qatar Voice User Interface Market Estimates and Forecasts, By Vertical  (2020-2032) (USD Billion)

10.5.9 South Africa

10.5.9 1 South Africa Voice User Interface Market Estimates and Forecasts, By Offering (2020-2032) (USD Billion)

10.5.9 2 South Africa Voice User Interface Market Estimates and Forecasts By Application (2020-2032) (USD Billion)

10.5.9 3 South Africa Voice User Interface Market Estimates and Forecasts, By Vertical  (2020-2032) (USD Billion)

10.5.10 Rest of Middle East & Africa

10.5.10.1 Rest of Middle East & Africa Voice User Interface Market Estimates and Forecasts, By Offering (2020-2032) (USD Billion)

10.5.10.2 Rest of Middle East & Africa Voice User Interface Market Estimates and Forecasts, By Application (2020-2032) (USD Billion)

10.5.10.3 Rest of Middle East & Africa Voice User Interface Market Estimates and Forecasts, By Vertical  (2020-2032) (USD Billion)

10.6 Latin America

10.6.1 Trends Analysis

10.6.2 Latin America Voice User Interface Market Estimates and Forecasts, by Country (2020-2032) (USD Billion)

10.6.3 Latin America Voice User Interface Market Estimates and Forecasts, By Offering (2020-2032) (USD Billion) 

10.6.4 Latin America Voice User Interface Market Estimates and Forecasts, By Application (2020-2032) (USD Billion)

10.6.5 Latin America Voice User Interface Market Estimates and Forecasts, By Vertical  (2020-2032) (USD Billion)

10.6.6 Brazil

10.6.6.1 Brazil Voice User Interface Market Estimates and Forecasts, By Offering (2020-2032) (USD Billion)

10.6.6.2 Brazil Voice User Interface Market Estimates and Forecasts, By Application (2020-2032) (USD Billion)

10.6.6.3 Brazil Voice User Interface Market Estimates and Forecasts, By Vertical  (2020-2032) (USD Billion)

10.6.7 Argentina

10.6.7.1 Argentina Voice User Interface Market Estimates and Forecasts, By Offering (2020-2032) (USD Billion)

10.6.7.2 Argentina Voice User Interface Market Estimates and Forecasts, By Application (2020-2032) (USD Billion)

10.6.7.3 Argentina Voice User Interface Market Estimates and Forecasts, By Vertical  (2020-2032) (USD Billion)

10.6.8 Rest of Latin America

10.6.8.1 Rest of Latin America Voice User Interface Market Estimates and Forecasts, By Offering (2020-2032) (USD Billion)

10.6.8.2 Rest of Latin America Voice User Interface Market Estimates and Forecasts, By Application (2020-2032) (USD Billion)

10.6.8.3 Rest of Latin America Voice User Interface Market Estimates and Forecasts, By Vertical  (2020-2032) (USD Billion)

11. Company Profiles

11.1 Amazon, Inc.

11.1.1 Company Overview

11.1.2 Financial

11.1.3 Product/ Services Offered

11.1.4 SWOT Analysis

11.2 Apple, Inc.

11.2.1 Company Overview

11.2.2 Financial

11.2.3 Product/ Services Offered

11.2.4 SWOT Analysis

11.3 Baidu, Inc.

11.3.1 Company Overview

11.3.2 Financial

11.3.3 Product/ Services Offered

11.3.4 SWOT Analysis

11.4 Google LLC

11.4.1 Company Overview

11.4.2 Financial

11.4.3 Product/ Services Offered

11.4.4 SWOT Analysis

11.5 IBM

11.5.1 Company Overview

11.5.2 Financial

11.5.3 Product/ Services Offered

11.5.4 SWOT Analysis

11.6 Meta Platform, Inc.

     11.6.1 Company Overview

11.6.2 Financial

11.6.3 Product/ Services Offered

11.6.4 SWOT Analysis

11.7 Nuance Communication

11.7.1 Company Overview

11.7.2 Financial

11.7.3 Product/ Services Offered

11.7.4 SWOT Analysis

11.8 SAMSUNG

11.8.1 Company Overview

11.8.2 Financial

11.8.3 Product/ Services Offered

11.8.4 SWOT Analysis

11.9 SoundHound AI Inc.

11.9.1 Company Overview

11.9.2 Financial

11.9.3 Product/ Services Offered

11.9.4 SWOT Analysis

11.10 Speechly

11.10.1 Company Overview

11.10.2 Financial

11.10.3 Product/ Services Offered

11.10.4 SWOT Analysis

12. Use Cases and Best Practices

13. Conclusion

An accurate research report requires proper strategizing as well as implementation. There are multiple factors involved in the completion of good and accurate research report and selecting the best methodology to compete the research is the toughest part. Since the research reports we provide play a crucial role in any company’s decision-making process, therefore we at SNS Insider always believe that we should choose the best method which gives us results closer to reality. This allows us to reach at a stage wherein we can provide our clients best and accurate investment to output ratio.

Each report that we prepare takes a timeframe of 350-400 business hours for production. Starting from the selection of titles through a couple of in-depth brain storming session to the final QC process before uploading our titles on our website we dedicate around 350 working hours. The titles are selected based on their current market cap and the foreseen CAGR and growth.


The 5 steps process:

Step 1: Secondary Research:

Secondary Research or Desk Research is as the name suggests is a research process wherein, we collect data through the readily available information. In this process we use various paid and unpaid databases which our team has access to and gather data through the same. This includes examining of listed companies’ annual reports, Journals, SEC filling etc. Apart from this our team has access to various associations across the globe across different industries. Lastly, we have exchange relationships with various university as well as individual libraries.

Secondary Research

Step 2: Primary Research

When we talk about primary research, it is a type of study in which the researchers collect relevant data samples directly, rather than relying on previously collected data.  This type of research is focused on gaining content specific facts that can be sued to solve specific problems. Since the collected data is fresh and first hand therefore it makes the study more accurate and genuine.

We at SNS Insider have divided Primary Research into 2 parts.

Part 1 wherein we interview the KOLs of major players as well as the upcoming ones across various geographic regions. This allows us to have their view over the market scenario and acts as an important tool to come closer to the accurate market numbers. As many as 45 paid and unpaid primary interviews are taken from both the demand and supply side of the industry to make sure we land at an accurate judgement and analysis of the market.

This step involves the triangulation of data wherein our team analyses the interview transcripts, online survey responses and observation of on filed participants. The below mentioned chart should give a better understanding of the part 1 of the primary interview.

Primary Research

Part 2: In this part of primary research the data collected via secondary research and the part 1 of the primary research is validated with the interviews from individual consultants and subject matter experts.

Consultants are those set of people who have at least 12 years of experience and expertise within the industry whereas Subject Matter Experts are those with at least 15 years of experience behind their back within the same space. The data with the help of two main processes i.e., FGDs (Focused Group Discussions) and IDs (Individual Discussions). This gives us a 3rd party nonbiased primary view of the market scenario making it a more dependable one while collation of the data pointers.

Step 3: Data Bank Validation

Once all the information is collected via primary and secondary sources, we run that information for data validation. At our intelligence centre our research heads track a lot of information related to the market which includes the quarterly reports, the daily stock prices, and other relevant information. Our data bank server gets updated every fortnight and that is how the information which we collected using our primary and secondary information is revalidated in real time.

Data Bank Validation

Step 4: QA/QC Process

After all the data collection and validation our team does a final level of quality check and quality assurance to get rid of any unwanted or undesired mistakes. This might include but not limited to getting rid of the any typos, duplication of numbers or missing of any important information. The people involved in this process include technical content writers, research heads and graphics people. Once this process is completed the title gets uploader on our platform for our clients to read it.

Step 5: Final QC/QA Process:

This is the last process and comes when the client has ordered the study. In this process a final QA/QC is done before the study is emailed to the client. Since we believe in giving our clients a good experience of our research studies, therefore, to make sure that we do not lack at our end in any way humanly possible we do a final round of quality check and then dispatch the study to the client.

Key Segments: 

By Offering

  • Solution

  • Service

By Application

  • Smart Speakers

  • Interactive Voice Response

  • On-premises Solutions

  • Cloud Solutions

  • Voice-controlled Devices

  • Smartphones & Tablets

  • Others

By Vertical

  • BFSI

  • Retail & E-commerce

  • Consumer Electronic

  • Automotive & Transportation

  • Healthcare & Life Science

  • Travel & Hospitality

  • Government & Defense Sector

  • Others

Request for Segment Customization as per your Business Requirement: Segment Customization Request

Regional Coverage: 

North America

  • US

  • Canada

  • Mexico

Europe

  • Germany

  • France

  • UK

  • Italy

  • Spain

  • Poland

  • Turkey

  • Rest of Europe

Asia Pacific

  • China

  • India

  • Japan

  • South Korea

  • Singapore

  • Australia

  • Rest of Asia Pacific

Middle East & Africa

  • UAE

  • Saudi Arabia

  • Qatar

  • South Africa

  • Rest of Middle East & Africa

Latin America

  • Brazil

  • Argentina

  • Rest of Latin America

Request for Country Level Research Report: Country Level Customization Request

Available Customization 

With the given market data, SNS Insider offers customization as per the company’s specific needs. The following customization options are available for the report: 

  • Detailed Volume Analysis 

  • Criss-Cross segment analysis (e.g. Product X Application) 

  • Competitive Product Benchmarking 

  • Geographic Analysis 

  • Additional countries in any of the regions 

  • Customized Data Representation 

  • Detailed analysis and profiling of additional market players

Explore Key Insights 


  • Analyzes market trends, forecasts, and regional dynamics
  • Covers core offerings, innovations, and industry use cases
  • Profiles major players, value chains, and strategic developments
  • Highlights innovation trends, regulatory impacts, and growth opportunities
Request an Analyst Call