Captive Portal Market Report Scope & Overview:
The Captive Portal Market was valued at USD 0.93 billion in 2023 and is expected to reach USD 3.06 billion by 2032, growing at a CAGR of 14.14% from 2024-2032.

Get More Information on Captive Portal Market - Request Sample Report
The captive portal market is experiencing significant growth, due to the increasing need for secure and controlled internet access in both public and private networks. Over 80% of organizations now implement BYOD policies, while 14% of the US workforce about 22 million adults work from home, significantly expanding the number of devices requiring secure network connections. Additionally, 58% of white-collar workers in the US prefer working remotely at least three days a week, further fueling the demand for secure remote access. As businesses strive to manage these connections efficiently, they are turning to captive portals that offer enhanced security and user management. The integration of advanced technologies such as AI and cloud-based systems has amplified the capabilities of these portals, making them essential in modern network infrastructure.
This growing adoption of captive portals has unlocked new opportunities for businesses to enhance customer engagement and deliver personalized experiences. By utilizing captive portals, businesses can gather critical user data, enabling them to understand consumer behavior and tailor targeted promotions or advertisements. These insights are particularly valuable for industries like retail, hospitality, and transportation, where customer satisfaction and loyalty are pivotal. Additionally, the adoption of captive portals by government and healthcare sectors ensures not only secure public internet access but also compliance with stringent data privacy regulations, solidifying their role as a critical component of secure network ecosystems.
Looking ahead, the captive portal market is poised to benefit from the rapid advancements in IoT and 5G technologies. As IoT devices continue to proliferate, captive portals will play a crucial role in managing and securing the increasingly complex networks these devices create. The rollout of 5G networks will further accelerate this trend, providing faster and more reliable connections that drive the need for scalable and innovative captive portal solutions. At the same time, heightened concerns around cybersecurity and user privacy are pushing the development of advanced authentication methods, such as biometrics and multi-factor authentication, ensuring a balance between security and ease of use. Together, these developments are shaping a future of sustained growth and innovation for the captive portal market.
MARKET DYNAMICS
DRIVERS
-
Expansion of Public Wi-Fi Networks Drives Demand for Captive Portals in High-Traffic Areas
The expansion of public and private Wi-Fi networks, particularly in high-traffic areas such as airports, hotels, shopping malls, and cafes, is a major driver for the captive portal market. With increasing numbers of users accessing these networks, there is a growing need for businesses to manage and authenticate user access efficiently. Captive portals provide a secure, seamless way for organizations to ensure that only authorized users can connect to the network, often through simple sign-in or acceptance of terms and conditions. Additionally, these portals offer opportunities for user engagement, allowing businesses to capture valuable data and provide targeted services or advertisements. As the demand for public Wi-Fi continues to rise, the role of captive portals in network management and user authentication becomes even more crucial.
-
Increasing Focus on Customer Engagement through Captive Portals
Businesses in sectors such as hospitality, retail, and transportation are increasingly using captive portals to enhance customer engagement. These portals enable companies to offer personalized services, tailored promotions, and targeted advertisements to users when they log into Wi-Fi networks. This not only improves customer satisfaction but also allows businesses to gather valuable data about customer preferences and behaviors. By leveraging captive portals, businesses can foster customer loyalty, encourage repeat visits, and increase revenue through customized offers. As companies seek more effective ways to connect with their customers, the demand for solutions like captive portals that streamline engagement and facilitate personalized interactions continues to grow.
RESTRAINTS
-
Growing Privacy Concerns and Data Protection Regulations Impacting Captive Portal Adoption
Captive portals often require users to provide personal data for authentication, which raises concerns about privacy and data security. As regulations like GDPR and other data protection laws become more stringent, businesses face increasing pressure to ensure that user information is handled responsibly and securely. Failure to comply with these regulations could result in legal and financial repercussions, creating a significant barrier to the adoption of captive portal solutions. Additionally, the potential for data breaches or unauthorized access to sensitive customer information further complicates the use of captive portals. Businesses may hesitate to deploy these systems without robust security measures in place, limiting their willingness to invest in such solutions despite the growing demand for user authentication and engagement features.
SEGMENT ANALYSIS
BY APPLICATION
In 2023, the platform segment dominated the captive portal market with the highest revenue share of about 59%. This dominance can be attributed to the increasing demand for integrated, scalable solutions that provide secure, seamless access management for businesses. The platform's ability to offer a comprehensive suite of features, such as user authentication, data analytics, and network security, has made it the preferred choice for organizations seeking efficient and reliable Wi-Fi management systems.
The services segment is expected to grow at the fastest CAGR of approximately 15.96% from 2024 to 2032. This growth is driven by the rising need for specialized services such as installation, maintenance, and customization of captive portals. As businesses increasingly look for tailored solutions to meet specific customer engagement and compliance requirements, the demand for expert services to support the deployment and optimization of these platforms is surging. This trend highlights the growing reliance on service providers to ensure seamless and secure portal experiences.
BY DEPLOYMENT
In 2023, the travel and transportation segment led the captive portal market with the highest revenue share of approximately 26%. This dominance stems from the increasing demand for secure and reliable Wi-Fi access in airports, train stations, and transit hubs, where large volumes of passengers require quick, seamless connectivity. Captive portals play a critical role in managing user access, ensuring network security, and delivering targeted content, making them an essential solution for the industry’s rapidly evolving needs.
The hospitality and leisure segment is expected to grow at the fastest CAGR of around 16.35% from 2024 to 2032. This growth is fueled by the rising importance of customer experience in hotels, resorts, and leisure facilities, where businesses are leveraging captive portals to offer personalized services, promotions, and seamless internet access. With travelers demanding more sophisticated and efficient digital engagement, the hospitality industry is increasingly investing in advanced captive portal solutions to meet these expectations and enhance guest satisfaction.
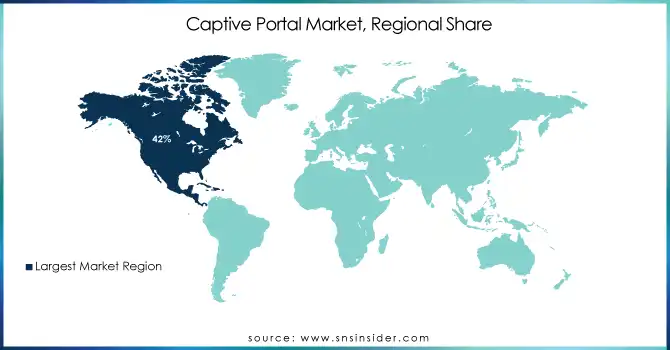
REGIONAL ANALYSIS
In 2023, North America held the dominant market share of approximately 42%, driven by the region's robust infrastructure and advanced technological adoption. The high demand for secure, reliable Wi-Fi networks in sectors like transportation, retail, and hospitality has led businesses to invest heavily in captive portal solutions. Additionally, strict data privacy regulations and a strong focus on customer experience have further fueled the demand for platforms that ensure both security and engagement.
In contrast, the Asia Pacific region is poised to experience the fastest growth, with a projected CAGR of 16.59% from 2024 to 2032. This growth is largely attributed to the rapid urbanization, increasing mobile internet penetration, and the expansion of digital services across emerging markets. As businesses in the region recognize the potential of captive portals to manage growing user bases and enhance customer interactions, the demand for these solutions is expected to surge, further driving the market's expansion.
Do You Need any Customization Research on Captive Portal Market - Enquire Now
KEY PLAYERS
-
Cisco Systems, Inc. (Meraki Captive Portal, DNA Spaces)
-
Aruba Networks (Hewlett Packard Enterprise Company) (ClearPass, AirWave)
-
Juniper Networks, Inc. (Mist Wi-Fi, Junos OS Captive Portal)
-
Extreme Networks, Inc. (ExtremeCloud IQ, ExtremeGuest)
-
Arista Networks, Inc. (CloudVision Wi-Fi, Cognitive Wi-Fi)
-
Enea (Qosmos DPI, Edge IP Traffic Intelligence)
-
Boingo Wireless (Boingo Broadband, Passpoint Hotspot)
-
Netgear (Insight Pro, Orbi Pro)
-
IronWifi (IronWifi Authentication, Captive Portal Solutions)
-
GlobalReach (Hotspot 2.0, Guest Wi-Fi)
-
Cloud4Wi (Volare Captive Portal, Presence Analytics)
-
Skyfii (Guest WiFi, IO Connect)
-
GoZone (WiFi Insights, Engage WiFi)
-
Adentro (WiFi Marketing, Captive Portal Solutions)
-
Anuvu (Connected Guest, Stream Wi-Fi)
-
Spotipo (WiFi Marketing, Guest Authentication)
-
Nexnet Solutions (Managed WiFi, Hotspot Authentication)
-
Performance Network (WiFi Portal, Engagement Analytics)
-
Cloudi-Fi (Cloudi-Fi Captive Portal, Guest WiFi Solutions)
-
WifiGem (Guest Portal, Analytics Dashboard)
-
Satcom Direct (SD WiFi, SD Cyber Smart)
-
Intelsat (FlexMove, Intelsat Managed WiFi)
-
Ray (Ray Access Points, WiFi Intelligence)
-
WatchGuard (Wi-Fi Cloud, Secure Guest Access)
-
Grandstream (GWN Cloud, GWN Manager)
-
Keenetic (KeeneticOS Captive Portal, Guest Network Services)
RECENT DEVELOPMENTS
-
In 2024, Cisco is updating its Captive Portal detection method for the Umbrella Roaming Security Module, transitioning from a Microsoft URL to a Cisco-specific URL for more reliable detection of public Wi-Fi login pages. This change aims to improve seamless and secure access to Wi-Fi networks.
-
In 2024, Nobu Hotels enhances its guest experience by integrating HPE Aruba Networking's Zero Trust connectivity, offering secure, AI-driven solutions for smart rooms and IoT devices. This upgrade ensures seamless, personalized services for guests.
-
In 2023, Juniper Networks has launched the Mist Access Assurance service, combining cloud-native network access control (NAC) with AI-driven automation. This service enhances security, simplifies operations, and scales efficiently, leveraging Mist AI to improve user connectivity and network policy enforcement.
| Report Attributes | Details |
|---|---|
| Market Size in 2023 | USD 0.93 Billion |
| Market Size by 2032 | USD 3.06 Billion |
| CAGR | CAGR of 14.14% From 2024 to 2032 |
| Base Year | 2023 |
| Forecast Period | 2024-2032 |
| Historical Data | 2020-2022 |
| Report Scope & Coverage | Market Size, Segments Analysis, Competitive Landscape, Regional Analysis, DROC & SWOT Analysis, Forecast Outlook |
| Key Segments | • By Offerings (Platform, Services) • By End-Use (Travel & Transportation, Hospitality & Leisure, Coworking Spaces, Shopping Malls & Retail Outlets, Entertainment, ISPs, Others) |
| Regional Analysis/Coverage | North America (US, Canada, Mexico), Europe (Eastern Europe [Poland, Romania, Hungary, Turkey, Rest of Eastern Europe] Western Europe] Germany, France, UK, Italy, Spain, Netherlands, Switzerland, Austria, Rest of Western Europe]), Asia Pacific (China, India, Japan, South Korea, Vietnam, Singapore, Australia, Rest of Asia Pacific), Middle East & Africa (Middle East [UAE, Egypt, Saudi Arabia, Qatar, Rest of Middle East], Africa [Nigeria, South Africa, Rest of Africa], Latin America (Brazil, Argentina, Colombia, Rest of Latin America) |
| Company Profiles | Cisco Systems, Inc., Aruba Networks, Juniper Networks, Inc., Extreme Networks, Inc., Arista Networks, Inc., Enea, Boingo Wireless, Netgear, IronWifi, GlobalReach, Cloud4Wi, Skyfii, GoZone, Adentro, Anuvu, Spotipo, Nexnet Solutions, Performance Network, Cloudi-Fi, WifiGem, Satcom Direct, Intelsat, Ray, WatchGuard, Grandstream, Keenetic. |
| Key Drivers | • Expansion of Public Wi-Fi Networks Drives Demand for Captive Portals in High-Traffic Areas • Increasing Focus on Customer Engagement through Captive Portals |
| RESTRAINTS | • Growing Privacy Concerns and Data Protection Regulations Impacting Captive Portal Adoption |
Frequently Asked Questions
Ans. The hospitality and leisure segment is expected to grow at a CAGR of 16.35% from 2024 to 2032.
Ans. The Asia Pacific region is expected to grow at the fastest CAGR of 16.59% from 2024 to 2032.
Ans. North America held the largest market share of approximately 42% in 2023.
Ans. The platform segment dominated the market with a 59% revenue share in 2023.
Ans. Captive Portal Market was valued at USD 0.93 billion in 2023 and is expected to reach USD 3.06 billion by 2032, growing at a CAGR of 14.14% from 2024-2032.
Get in Touch
