Augmented Shopping Market Report Scope & Overview:
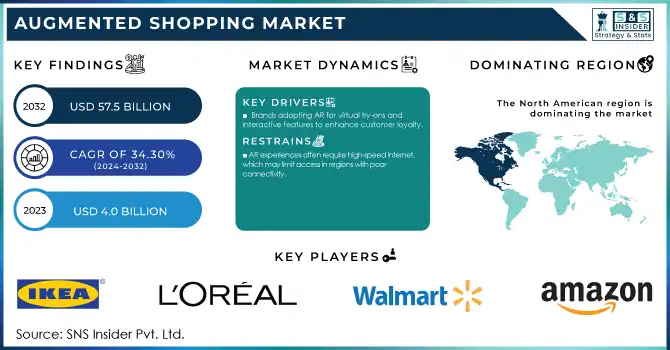
The Augmented Shopping Market was valued at USD 4.0 Billion in 2023 and is expected to reach USD 57.5 Billion by 2032, growing at a CAGR of 34.30% from 2024-2032.
To get more information on Augmented Shopping Market - Request Free Sample Report
Technological advancements and evolving consumer behaviors are set to drive strong growth in an Augmented Shopping Market. Augmented Reality and Virtual Reality will turn consumers' shopping experiences upside down as consumers can visualize the products in front of their eyes and their environments. It has transformed the way consumers engage and convert in the market, making it an essential component in the growth of the Consumer Experience market where immersion in content makes an impression. With the growth of e-commerce, there is a growing need for interactive shopping experiences that connect online users with brick-and-mortar stores. This is where augmented shopping solutions come in — they provide a seamless mix of online shopping convenience and the tactile sensation of shopping in a physical store.
Increasing consumer inclination toward personalized shopping experiences is another key factor fuelling the demand for augmented shopping in the world market. AR technologies provide retailers with the means to offer personalized product recommendations as well as augmented try-ons, increasing customer satisfaction and loyalty. By offering augmented shopping solutions, retailers are setting themselves apart from the competition, enticing and retaining customers through creative, experience-focused interactions. In addition to this, the proliferation of smartphones and tablets has made augmented shopping applications easier and more convenient to use, leading to rapid adoption.
A growing trend in the augmented shopping space is evident from the recent developments. As an example, augmented reality features such as virtual try-ons have been implemented by many brands including, Nars Cosmetics. Moreover, virtual stores – in particular, those inside Roblox – are changing the very nature of retail. These interactive stores, which enable physical goods to be sold via a 3D model, create an immersive shopping experience that appeals to buyers. As this demographic grows, expect virtual stores to take off as AI and augmented reality are blended into one electronic shopping experience. The Augmented Shopping Market is poised for significant growth, fuelled by technological advancements, the growing e-commerce boom, and a trend toward personalized and immersive shopping experiences. The augmented shopping market will continue to develop as retailers adopt innovative approaches and consumers are presented with fresh opportunities for engaging shopping experiences.
Market Dynamics
Drivers
-
Brands adopting AR for virtual try-ons and interactive features to enhance customer loyalty.
The role of brands that are using Augmented Reality for Virtual try-ons and kind of interactive features is changing the shopping experience. With AR tech implementation, retailers are allowing customers to virtually try their products—apparel, accessories, makeup, eyewear, and the like—without any physical touch. This benefits the fashion and beauty industry by helping consumers visualize how products will appear on them in real-time. Brands such as Nars Cosmetics, for example, have released AR tools for customers to try on makeup virtually, creating an interactive personalized experience.
Additionally, AR-enabled virtual try-ons make for a more interactive and immersive shopping experience, which can also enhance customer loyalty. It minimizes the ambiguity that comes with retail on the internet making fewer returns and a confident purchasing decision. Thus, immersive and personalized experiences create an emotional bond between brands and customers that results in repeat and sustained business. In addition, AR allows retailers the opportunity to integrate interactive elements like virtual fitting rooms, product customization, and tailored suggestions. These aspects make the shopping experience more personalized, which adds a layer of exclusivity. As a result, brands that utilize AR can set themselves apart in a saturated marketplace, attract technologically driven shoppers, and foster connections with continuous customers. This trend is likely to drive the sustained growth of the Augmented Shopping Market, with more retailers accepting AR to enhance customer engagement and experience.
-
Innovations in AR and VR enhance immersive shopping experiences, driving consumer engagement.
-
The rise of online shopping increases demand for interactive, virtual shopping solutions.
Restraints
-
AR experiences often require high-speed internet, which may limit access in regions with poor connectivity.
Augmented Reality, relies on the fast and stable internet as an integral part and suffers to perform in poorly connected areas. AR applications in the Augmented Shopping Market typically necessitate solving complex visual data in real-time, rendering 3D models, or having virtual try-on scenarios. The demand for high-bandwidth data transfer that this requires can result in lag, interruptions, or even prevent users in areas with slow or unreliable internet from using certain features.
The whole AR tech potential is not yet realized, which limits the way it works and is being used by some regions, especially where mobile networks and the Internet at large have not yet truly developed, especially in rural or low-bandwidth areas. They would be unable to enjoy the optimal virtual experiences such as trying on clothes, testing makeup, or placing furniture in their homes to see how it would look all together. This can weaken the benefits of AR in improving the shopping experience and make it less attractive in these areas. Slow internet speeds may lead to pixelation or distortion of AR content, also affecting the experience quality. Certainly, for the brands and retailers wanting to leverage AR in their customer shopping experiences, it will be important to keep regional limits in mind and work on optimizing AR applications that will work with lower bandwidths or provide contingency shopping solutions for consumers in zones with poor connectivity. This is a major challenge to overcome for AR to truly become widespread in the global Augmented Shopping Market.
-
The initial investment required for AR technology and infrastructure can be prohibitive for smaller retailers.
-
AR experiences may not be seamless across all devices, limiting accessibility for some consumers.
Segment Analysis
By Component
In 2023, the solutions segment dominated the market and accounted for 69% of revenue share. This can be attributed to the increase in demand for all-in-one AR solutions that can be easily integrated into current e-commerce platforms, mobile apps, and retail stores. There is an immensely growing demand among retailers for end-to-end solutions that cover content creation, software development, deployment, and evergreen support and maintenance. AR solutions additionally assist in offering retailers the one-stop shop, which provides them with the scalability and a customizable AR platform to tailor the app to their distinct business requirements. In addition, allowing retailers to capitalize on AR tech without the need for a high initial investment in in-house development or expertise in this area, appealing across all sizes of business.
The augmented shopping services segment is projected to grow at the fastest CAGR during the forecast period. Massive growth is predicted to be supported by the high demand for specialized services which should allow retailers to successfully combine AR technologies with their operations at the right level. While AR shopping experiences are on the rise, retailers need strategic guidance on AR strategy, content, and implementation to reap the highest rewards of AR adoption. This services segment consisting of consulting, training, maintenance, and support services has emerged solutions for retailers in overcoming the complexities of AR technology for maximizing return on investment.
By Application
The automotive sector dominated the market and represented a significant revenue share. The industry consists of complex and high-value products that require immersive and interactive customer experiences, thus laying a solid foundation for AR adoption. AR has been used by automobile companies and dealers to have customers interact with automobiles virtually, customize cars by viewing features and options, and even go for virtual test drives. As an example in this category, the automaker Toyota developed an AR app based on machine learning and Apple's ARkit. With this app, customers can identify their car using their phone camera and add the accessories virtually, without any requirement of physical markers, resulting in a more interesting and smooth shopping experience. These efforts drive customer engagement as well as enhance sales. A sizeable investment by the automobile sector in digital transformation and customer experience initiatives has made AR a competitive differentiator among automakers.
The footwear segment is set to gain the fastest growth rate between 2024 and 2032. The fashion aspect of footwear aligns perfectly with AR adoption, allowing customers to virtually try shoes, preview alternative styles/colors, or simply provide the perfect fit. Moreover, the competitive environment in this market, coupled with higher return rates of non-gaming physical inventory, has increased retailer investment in solutions to increase customer satisfaction, minimize returns, and gain a competitive advantage.
Regional Analysis
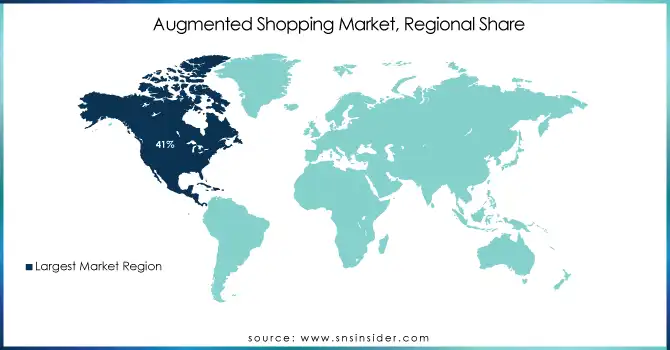
North America dominated the market with a revenue share of 41% in 2023 This can be accounted for by the growing e-commerce sector in the region, the high smartphone penetration rate, and high consumer demand for innovative technology. North America has a mature retail framework complemented by massive investments in digital transformation and customer experience, creating multiple pathways for AR to flourish. Further, a competitive market landscape in this region enforcing retailers to exploit AR as a vital differentiator has contributed to the growing retail AR market demand among in passing year.
The fastest growth over the forecast period is anticipated to be witnessed in the Asia Pacific region. With their rapidly rising economies and growing middle-income urban populations, countries like China, India, and Indonesia are generating attractive growth prospects for retailers. The Growth of AR and Its Adoption by Giants in Social Media and Retail: Taobao by Alibaba Group, JD. In such a scenario, the increasing use of AR solutions by retailers can be attributed to social commerce platforms, such as Xiaohongshu. com, WeChat, and Douyin. We can expect a corresponding increase in the use of innovative techniques such as AR over the next few years, with the optimism surrounding the region's economy.
Get Customized Report as per Your Business Requirement - Enquiry Now
KEY PLAYERS:
The major key players along with their products are
-
IKEA – IKEA Place
-
L'Oreal – L'Oreal Virtual Try-On
-
Sephora – Sephora Virtual Artist
-
Nike – Nike Fit
-
Amazon – Amazon AR View
-
Walmart – Walmart AR Shopping
-
Warby Parker – Warby Parker Virtual Try-On
-
ModiFace – ModiFace AR Beauty Try-On
-
Zara – Zara AR Experience
-
Alibaba – Alibaba AR Shopping
-
ASOS – ASOS Virtual Catwalk
-
H&M – H&M AR Shopping Experience
-
Hershey's – Hershey's AR Experience
RECENT DEVELOPMENTS:
In 2024, L'Oreal expanded its AR capabilities by introducing an enhanced version of its Virtual Try-On technology, enabling consumers to try on makeup in real-time through their smartphones and integrating AI to offer personalized product recommendations.
Sephora launched a new AR feature in 2024, allowing customers to virtually try on skincare products alongside makeup. This integration of augmented reality with skincare helps users assess how products would perform on their skin tones and types.
|
Report Attributes |
Details |
|
Market Size in 2023 |
USD 4.0 Billion |
|
Market Size by 2032 |
USD 57.5 Billion |
|
CAGR |
CAGR of 34.30% From 2024 to 2032 |
|
Base Year |
2023 |
|
Forecast Period |
2024-2032 |
|
Historical Data |
2020-2022 |
|
Report Scope & Coverage |
Market Size, Segments Analysis, Competitive Landscape, Regional Analysis, DROC & SWOT Analysis, Forecast Outlook |
|
Key Segments |
• By Component (Solutions, Services) |
|
Regional Analysis/Coverage |
North America (US, Canada, Mexico), Europe (Eastern Europe [Poland, Romania, Hungary, Turkey, Rest of Eastern Europe] Western Europe] Germany, France, UK, Italy, Spain, Netherlands, Switzerland, Austria, Rest of Western Europe]), Asia Pacific (China, India, Japan, South Korea, Vietnam, Singapore, Australia, Rest of Asia Pacific), Middle East & Africa (Middle East [UAE, Egypt, Saudi Arabia, Qatar, Rest of Middle East], Africa [Nigeria, South Africa, Rest of Africa], Latin America (Brazil, Argentina, Colombia, Rest of Latin America) |
|
Company Profiles |
IKEA, L'Oreal, Sephora, Nike, Amazon, Walmart, Warby Parker, ModiFace, Zara, Alibaba, ASOS, H&M, Hershey's |
|
Key Drivers |
• Innovations in AR and VR enhance immersive shopping experiences, driving consumer engagement. |
|
RESTRAINTS |
• The initial investment required for AR technology and infrastructure can be prohibitive for smaller retailers. |
Frequently Asked Questions
Ans. The Augmented Shopping Market was valued at USD 4.0 Billion in 2023 and is expected to reach USD 57.5 Billion by 2032.
Ans. The CAGR of the Augmented Shopping Market during the forecast period is 34.30% from 2024-2032.
Ans. Asia-Pacific is expected to register the fastest CAGR during the forecast period.
Ans: Innovations in AR and VR enhance immersive shopping experiences, driving consumer engagement.
Ans. The initial investment required for AR technology and infrastructure can be prohibitive for smaller retailers.
Get in Touch
