Automotive Flywheel Market Report Scope & Overview:
The automotive flywheel market was valued at USD 7.48 billion in 2025 and is expected to reach USD 11.84 billion by 2035, growing at a CAGR of 4.70% from 2026 to 2035.
The flywheel is one of the most ancient mechanical parts in engines. The flywheel plays the role that engineers are still unable to bypass in modern powertrain development. The flywheel acts as a mechanism that accumulates rotational energy from power cycles and releases this energy in non-power cycles, thereby maintaining a stable operation of the engine at low-speed rates. In addition to its core functionality, the flywheel provides a mechanical link between the engine and the clutch assembly in manual and automated manual gearboxes. Furthermore, in modern powertrains, especially in those equipped with the dual mass flywheel technology, the flywheel becomes a major vibration isolator. All these characteristics make the flywheel an indispensable part that can be found in traditional internal combustion engines, diesel trucks, and hybrid powertrain layouts.
Global vehicle production has returned to and surpassed pre-pandemic levels. The International Organization of Motor Vehicle Manufacturers reported global light vehicle output exceeding 92 million units in 2024. Every vehicle fitted with a manual or automated manual transmission, and many with automatic transmissions, requires a flywheel assembly. Commercial vehicles operating diesel powertrains represent the highest-value flywheel demand category because heavy-duty applications require larger, more precisely engineered flywheel assemblies with superior vibration damping specifications.
Market Size and Forecast
-
Market Size 2026E: USD 7.82 Billion
-
Market Size 2035: USD 11.84 Billion
-
CAGR: 4.70% from 2026 to 2035
-
Fastest Growing Region: Europe
-
Largest Region: Asia Pacific

To Get more information On Automotive Flywheel Market - Request Free Sample Report
Automotive Flywheel Market Trends
-
Dual mass flywheel technology is progressively replacing single mass designs in mainstream passenger cars across Europe and North America as NVH standards tighten and consumer expectations for driving refinement rise.
-
Lightweight material adoption, particularly aluminum alloy flywheel assemblies, is accelerating as automakers pursue gram-by-gram reductions in rotating mass to improve fuel economy and reduce CO2 emissions under increasingly stringent regulatory standards.
-
The growth of mild hybrid and full hybrid powertrain architectures is creating new flywheel application requirements, including integrated starter-generator flywheel systems that combine energy recovery with traditional mechanical functions.
-
Aftermarket demand is expanding in Asia, Latin America, and the Middle East as large fleets of aging vehicles with worn flywheel assemblies generate replacement cycles that commercial and online aftermarket channels are actively capturing.
-
Precision manufacturing advances including CNC balancing, laser welding integration, and automated spring assembly in dual mass flywheel production are improving product quality consistency and enabling higher-volume output with tighter tolerance specifications.
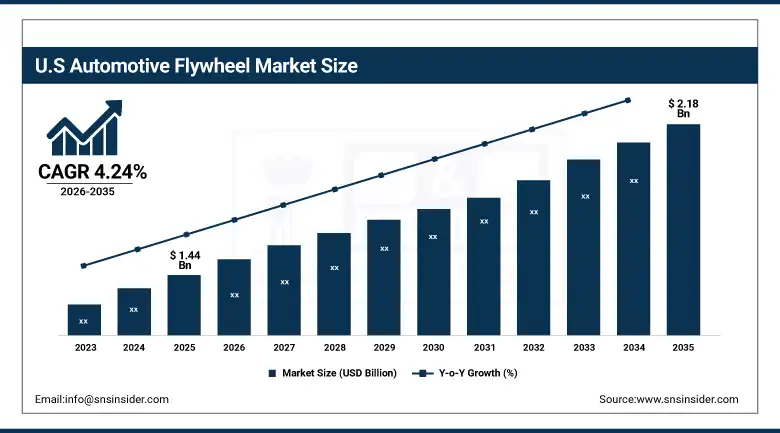
The U.S. Automotive Flywheel Market Size Outlook
The U.S. automotive flywheel market was valued at USD 1.44 billion in 2025 and is expected to reach around USD 2.18 billion by 2035, growing at a CAGR of 4.24% from 2026 to 2035.
The U.S. automotive flywheel market is influenced by a vehicle fleet that is dominated by passenger cars, light trucks, and SUVs featuring automatic transmissions. Such a structure leads to a smaller share of manual vehicles where the role of flywheel in the driveline becomes more visible. But the size and activity of the commercial vehicle segment are quite high, providing substantial procurement volumes for flywheels for OEM assembly and in the aftermarket from Class 7 and Class 8 diesel trucks. The U.S. aftermarket for automotive flywheels is highly developed and supported not only by the national auto spare parts chains but also by an extensive distribution network of independent suppliers. An increase in the age of the fleet, reaching 12.6 years in 2024 per S&P Global Mobility, stimulates flywheel replacements.
BorgWarner Inc. has been advancing its integrated powertrain component portfolio in the United States, including flywheel ring gear assemblies and torsional damper products for manual and automated manual transmission applications. The company's manufacturing operations in North America serve both domestic OEM programs and export markets, and its engineering investment in hybrid-compatible flywheel system designs positions it to capture growing demand from the expanding mild hybrid vehicle segment that is gaining share in the U.S. light truck and SUV market.
Automotive Flywheel Market Segment Analysis
-
By Type, the dual mass flywheel segment dominated the automotive flywheel market with 58.74% share in 2025, while the single mass flywheel segment holds stable demand in volume-oriented applications.
-
By Material, the steel and cast iron segment dominated the automotive flywheel market with 62.84% share in 2025, while the aluminum alloy segment is the fastest growing.
-
By Vehicle Type, the passenger cars segment dominated the automotive flywheel market with 67.25% share in 2025, while the heavy commercial vehicles segment is the fastest growing.
-
By Engine Type, the diesel engine segment dominated the automotive flywheel market with 52.38% share in 2025, while the hybrid engine segment is the fastest growing.
-
By Sales Channel, the OEM segment dominated the automotive flywheel market with 72.46% share in 2025, while the aftermarket segment is the fastest growing.
By Type, the dual mass flywheel segment dominates the automotive flywheel market, while representing the premium performance tier of the market.
The dual mass flywheel accounted for 58.74% of the market for automotive flywheels in 2025. The business case for using a dual mass flywheel is based on powertrain efficiency benefits that can be quantified. As a result of designing the flywheel as two rotating disks held together by springs and dampers, the dual mass design isolates engine vibrations before they affect the transmission. The consequence of doing so is a quieter interior, smoother shifting of gears, longer lifespan of transmission components, and minimized gear rattle. These factors have tangible commercial value as automobile manufacturers compete on NVH performance standards that consumers use to make their buying decision. Dual mass flywheel systems have been extensively used by European automakers in diesel engines since the early 2000s, and its usage in gasoline and hybrid vehicles has become common as costs have been reduced.
Single mass flywheels continue to serve a large and commercially significant vehicle population. High-volume entry-level passenger cars, light commercial vehicles in emerging markets, and heavy-duty applications where simplicity and serviceability take priority over NVH refinement are the primary single mass demand segments. The commercial logic favoring single mass in these applications is cost. A single mass flywheel is a precision-machined steel disc. It has no springs, no secondary mass, and no damper assembly. Its production cost is a fraction of an equivalent dual mass unit. In markets where vehicle price points are highly competitive and buyers are cost-sensitive, single mass flywheels remain the technically appropriate and commercially preferred solution.

By Material, the steel and cast iron segment dominates the market, while aluminum alloy is the fastest-growing material.
Steel and cast iron materials accounted for 62.84% of market revenue in 2025. The dominance of ferrous materials in flywheel manufacturing reflects their fundamental mechanical suitability for the application. Flywheels operate under continuous cyclic loading at engine rotational speeds that can exceed 6,000 RPM in passenger car applications. They must withstand substantial torque loads at engagement and resist deformation at elevated operating temperatures. Steel and cast iron both meet these requirements reliably and at competitive cost. Cast iron is particularly well suited to single mass flywheel production because it can be poured into complex ring gear integrated forms and machined to precise balance specifications at high production volumes. Steel forgings and stampings are widely used in dual mass flywheel primary and secondary mass construction.
Aluminum alloy is growing faster than any other material in the flywheel market. The commercial driver is straightforward. A reduction in flywheel rotational mass directly reduces engine work during acceleration events, contributing to measurable fuel economy improvement. Each kilogram removed from a rotating powertrain component has a proportionally larger effect on fuel consumption than removing equivalent mass from a static vehicle structure. Automakers pursuing incremental fuel economy gains to meet corporate average fuel economy targets and EU CO2 fleet average regulations are motivated to specify lighter flywheel assemblies wherever engineering feasibility allows. Aluminum alloy flywheels require surface hardening and precision coating to manage wear at the friction interface. These process requirements add cost. The premium is commercially justified in applications where the fuel economy benefit over the vehicle lifecycle exceeds the component cost differential.
By Vehicle Type, the passenger cars segment dominates the market, while heavy commercial vehicles are the fastest-growing segment.
Passenger cars generated 67.25% of automotive flywheel market revenue in 2025. This dominance reflects the sheer production volume of global passenger car manufacturing, which dwarfs all other vehicle categories combined. Every manually transmitted passenger car and a significant proportion of those with automated manual transmissions require a flywheel. Europe accounts for the highest-value flywheel procurement per vehicle because of the high prevalence of manual transmission diesel passenger cars fitted with dual mass flywheel systems at OEM specification. Japanese and Korean OEMs serve their domestic and export markets with high volumes of manual transmission gasoline passenger cars requiring flywheel assemblies. In emerging markets including India, Indonesia, and Brazil, entry-level manually transmitted vehicles sold in very large numbers create sustained high-volume demand for cost-optimized flywheel solutions.
Heavy commercial vehicles are the fastest-growing vehicle type segment for automotive flywheels. The commercial logic is clear. Heavy-duty diesel engines produce high torque outputs that impose extreme demands on flywheel assemblies in terms of rotational inertia, thermal stability, and vibration damping performance. The expanding global commercial vehicle fleet, driven by growth in freight transportation demand across Asia Pacific and Latin America, is generating both OEM production flywheel procurement and a large and growing aftermarket replacement cycle. Long-haul truck operators replace worn flywheel assemblies as part of scheduled clutch maintenance programs. Each replacement represents a commercially significant aftermarket transaction that sustains flywheel revenue beyond the initial OEM build event.
By Engine Type, the diesel engine segment dominates the market, while hybrid engine applications are the fastest-growing segment.
Diesel engine vehicles accounted for 52.38% of automotive flywheel market revenue in 2025. Diesel powertrains generate the most severe torsional vibration characteristics of any mass-produced automotive engine type. The high compression ratios and longer power strokes that give diesel engines their fuel economy and torque advantages also create pronounced combustion pulses that must be isolated from the transmission. Dual mass flywheel technology was initially developed and refined specifically for diesel passenger car and light commercial vehicle applications for this reason. The large installed base of diesel vehicles in Europe, India, and commercial vehicle fleets globally creates both OEM procurement and a deep aftermarket replacement demand that sustains diesel as the highest-revenue engine type category in the flywheel market.
Hybrid engine applications are growing the fastest. Hybrid powertrain architectures present a technically interesting challenge for flywheel engineers. The frequent engine stop-start cycles inherent to hybrid operation create impact loading conditions at clutch engagement that conventional flywheel designs were not optimized for. The integration of electric motor-generator units with the flywheel mass creates combined systems that must manage both mechanical energy storage and electromagnetic torque. Suppliers including Valeo and Schaeffler are developing integrated starter generator systems that incorporate flywheel mass management within a single module. These products command significantly higher unit prices than conventional flywheel assemblies and represent a growing share of the hybrid vehicle flywheel market value as global hybrid vehicle production volumes increase across Asia Pacific and Europe.
By Sales Channel, the OEM segment dominates the market, while the aftermarket segment is the fastest-growing channel.
OEM sales distribution accounted for 72.46% of revenue in the automotive flywheel market in 2025. Flywheel orders by automakers directly correlated to the production of cars. All vehicles produced using manual or automated manual transmissions came out with a new flywheel installed. Multiyear contracts between manufacturers of flywheels and automakers ensure steady income generation to support investments and production activities. Major Tier 1 flywheel suppliers, such as ZF Friedrichshafen, Schaeffler, Valeo, and EXEDY, had secured multiyear program positions with leading automakers worldwide, guaranteeing steady income streams for up to five to seven years. Program positions were a key competitive advantage within the OEM category that could not be easily challenged by smaller players.
Aftermarket distribution emerges as the most rapidly growing market for automotive flywheels. Vehicle aging on the global level acts as an underlying driving force for this trend. Wear occurs on the flywheel friction surface, the springs deteriorate in dual mass flywheel systems due to torsional damper fatigue, and ring gears get worn out due to the constant engagement with the starter motor. These are observable failure events that make up a definite replacement scenario in terms of which flywheel replacements get purchased on the aftermarket. In the commercial aftermarket distribution chain, replacement flywheel assemblies are supplied both directly under the OEM brand name and through alternative aftermarket brands. Increasing adoption of the e-commerce platform helps to expand flywheel availability in emerging regions with limited physical distribution network coverage.
Regional Analysis
|
Region |
Major Country |
Share within Region, 2025 (%) |
|---|---|---|
|
Asia Pacific |
China |
47.83% |
|
Europe |
Germany |
34.52% |
|
North America |
United States |
83.47% |
|
Middle East & Africa |
South Africa |
18.63% |
|
Latin America |
Brazil |
48.72% |
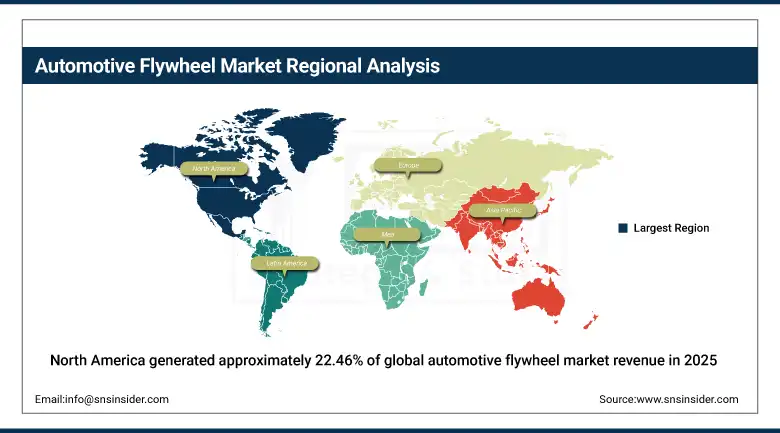
North America Automotive Flywheel Market Insights
North America generated approximately 22.46% of global automotive flywheel market revenue in 2025. The United States is the dominant national market, with a vehicle fleet and production mix that differs substantially from European and Asian markets. American consumer preference for automatic transmission vehicles in the passenger car and light truck segments reduces manual transmission flywheel demand relative to regions with higher stick shift market penetration. However, the North American commercial vehicle sector is large and active. Class 8 diesel trucks fitted with manual and automated manual transmissions require high-specification flywheel assemblies that generate above-average revenue per unit. The Mexican automotive manufacturing corridor, which produces vehicles for both the North American market and global export, contributes meaningful regional flywheel procurement through its OEM assembly operations.
ZF Friedrichshafen maintains significant North American manufacturing and engineering operations serving both the passenger car and commercial vehicle segments. Its SACHS brand flywheel and clutch systems supply multiple North American OEM programs and are distributed through its extensive aftermarket network across the United States, Canada, and Mexico. The company's investment in automated manual transmission clutch and flywheel systems for commercial vehicle applications positions it to capture growing demand as fleet operators in the U.S. trucking industry adopt automated manual transmissions for driver comfort and fuel efficiency reasons.
Get Customized Report as per Your Business Requirement - Enquiry Now
Europe Automotive Flywheel Market Insights
Europe is expected to be the fastest growing regional market in terms of the use of automotive flywheels. The compound annual growth rate in the region during the forecast period of 2026 to 2035 is estimated to be around 5.38%. This growth would be largely driven by the CO2 fleet average regulations introduced in the EU, which are expected to become increasingly stringent in the decade beginning 2030 onwards. This trend in the regulatory environment has led manufacturers active in Europe to invest in new powertrain technologies such as dual mass flywheels, mild hybrids, and NVH solutions. Germany emerges as the largest national market for automotive flywheels in Europe, where the head office of companies such as ZF, Schaeffler, and Valeo's operations in Europe is located. Besides, OEM programs from BMW, Mercedes-Benz, and Volkswagen Group can also be seen here.
Schaeffler Group's LUK brand is the dominant supplier of dual mass flywheel systems across the European automotive OEM market. The company's long-standing engineering partnership with major European automakers has resulted in program positions across virtually every diesel and many gasoline passenger car platforms produced at European factories. Schaeffler's ongoing investment in flywheel designs compatible with 48V mild hybrid powertrains reflects its strategic response to the European automotive industry's accelerating transition toward electrified powertrains that retain internal combustion engines as the primary drive source.
Asia Pacific Automotive Flywheel Market Insights
In 2025, the Asia Pacific accounted for an estimated 38.47% share of the automotive flywheel market, making it the world’s leading region. Leading in terms of market size in the region are China in terms of vehicle production volume as well as flywheel manufacturing capacity. In 2024, China had more than 30 million vehicle production volumes and not only features flywheel manufacturers domestically but also subsidiaries of the global Tier 1 flywheel suppliers in the region. The second largest Asia Pacific country is India, experiencing rapid growth thanks to the rising domestic production and high manual transmission vehicle fleets. Japan and South Korea make contributions due to the vehicle production programs by their domestic OEMs as well as global production by their automotive organizations respectively.
EXEDY Corporation, headquartered in Japan, is one of the world's leading manufacturers of clutch and flywheel systems for both OEM and aftermarket applications. The company's manufacturing network across Japan, China, India, Thailand, and the United States positions it at the center of Asia Pacific flywheel supply. EXEDY's engineering investment in lightweight flywheel designs for compact car applications and its growing hybrid system product portfolio reflect the commercial priorities of Asia Pacific automotive OEMs as they navigate fuel economy regulations and the gradual introduction of hybrid powertrain variants across their model lineups.
Middle East & Africa and Latin America Automotive Flywheel Market Insights
Latin America, the Middle East, and Africa are the regions which provide aftermarket sales of flywheels for commercial purposes. The regions are characterized by aging vehicle fleets with relatively high usage miles thus leading to higher component wear. Commercial, pickup, and SUV fleets operate under harsh conditions in the Middle East thus leading to increased wear of flywheels. Sub-Saharan Africa is dominated by South Africa which boasts a robust automotive industry. South Africa has Toyota, BMW, and Mercedes-Benz vehicle OEM factories that provide opportunities for local flywheel procurement. The largest market in Latin America for vehicles and vehicle components is Brazil, which boasts vehicle factories producing commercial and passenger vehicles. Historically, Brazilian drivers preferred manual transmission vehicles hence providing an excellent market for flywheels.
Valeo SA has facilities for manufacturing and distributing components in Latin America, serving both OEM manufacturing and after-market demands for the region. Recovery of Brazil's vehicle manufacturing industry from the shocks of the years 2020 and 2021 led to a surge in demand for components used in production. This was because Valeo SA already had its facility in Brazil.
Market Dynamics
Growth Drivers: Rising global vehicle production and the commercial momentum of dual mass flywheel adoption across premium and mainstream vehicle segments are the primary market growth engines.
Global automotive production is on a sustained recovery trajectory after the supply chain disruptions of 2021 and 2022. Recovering production volumes directly increase OEM flywheel procurement across all vehicle categories. The commercial logic of dual mass flywheel adoption continues to strengthen as automakers compete on driving refinement and NVH quality metrics that influence consumer brand perception. Vehicle manufacturers that specify dual mass flywheel systems generate higher per-vehicle flywheel revenue for suppliers than those specifying single mass alternatives. The progressive extension of dual mass technology from European diesel applications into gasoline, Asian, and commercial vehicle platforms is expanding the total addressable market for premium flywheel systems. Simultaneously, the large global vehicle fleet continues to age, sustaining aftermarket replacement demand that is largely independent of new vehicle production cycle volatility.
Restraints: The gradual global shift toward electric vehicles with no internal combustion engine reduces the addressable market for traditional flywheel systems over the long-term forecast horizon.
Conventional battery electric vehicles do not feature any flywheel assembly. With increasing adoption of BEVs around the world, especially in Europe and China, where governments have mandated a switch to electrified mobility, fewer and fewer vehicles will be produced that require flywheel technology. This trend is currently not impactful in the period between 2026 and 2035. The large majority of worldwide vehicle production will still involve an internal combustion engine – either a pure ICE configuration or a hybrid – that all require flywheel systems. But companies that derive a considerable portion of their revenues from sales to markets/segments that are at the forefront of switching to BEVs should focus on flywheel integrated energy regeneration and MG units.
Opportunities: The integration of flywheel technology with hybrid powertrain systems and the development of flywheel energy storage systems for commercial vehicle applications represent significant growth opportunities beyond the traditional OEM replacement paradigm.
Mild hybrid vehicle architectures that incorporate a belt-integrated starter generator or crankshaft-integrated motor present a natural integration opportunity for flywheel suppliers. These systems use the flywheel mass as part of the energy recovery and redistribution system, and suppliers with expertise in both flywheel dynamics and electric motor integration are well positioned to capture the component content of these hybrid systems. This represents a meaningful per-vehicle revenue expansion opportunity relative to supplying a standalone conventional flywheel. In commercial vehicles, flywheel energy storage systems that capture and release kinetic energy during braking and acceleration cycles have demonstrated fuel economy benefits of 10 to 25% in urban bus and delivery vehicle applications. While the technology remains in early commercial deployment, regulatory pressure on commercial fleet emissions in Europe and China provides a clear policy driver for accelerated adoption during the forecast period.
Recent Developments
-
2025: Schaeffler Group launched an updated LUK RepSet DMF dual mass flywheel aftermarket product range incorporating enhanced arc spring damper technology and improved friction coating specifications, targeting the large European passenger car aftermarket and extending the brand's technical positioning against independent aftermarket competitors.
-
2025: Valeo expanded its FlyWheel Start Stop system product line for 48V mild hybrid applications, advancing the commercial availability of integrated starter-generator flywheel modules that combine energy recovery, engine restart, and torsional damping in a single powertrain module for compact and mid-size passenger car OEM programs.
-
2024: The range of SACHS commercial vehicle flywheels offered by ZF Friedrichshafen was expanded to include new heavy-duty dual mass flywheel designs tailored for Class 8 diesel trucks to accommodate rising customer requirements among North American fleets using automated manual transmission systems requiring sophisticated torsional dampening of the engine-to-transmission connection.
-
2024: EXEDY Corporation has increased production capacity at its India plant to produce more flywheels for Indian passenger cars and commercial vehicles as the percentage of dual mass specifications among these vehicles rises, prompted by tightening NVH standards in the domestic market.
-
2023: BorgWarner continued development on its eGearDrive flywheel system for use in hybrid commercial vehicles through validation tests conducted in cooperation with European commercial vehicle OEM research projects seeking compliance with EU emissions regulation mandates for reduced CO2 emissions.
Automotive Flywheel Market Key Players are:
-
ZF Friedrichshafen AG (SACHS)
-
Schaeffler Group (LUK)
-
Valeo SA
-
EXEDY Corporation
-
Aisin Seiki Co. Ltd.
-
BorgWarner Inc.
-
Linamar Corporation
-
AmTech International
-
AMS Automotive
-
Platinum Driveline
-
JMT Auto Limited
-
Tilton Engineering Inc.
-
Ogura Clutch Co. Ltd.
-
Standard Motor Products (SMPE)
-
Marmon Ride Control (Autopart International)
-
Skyway Precision Inc.
-
Dura Automotive Systems
-
Mitsubishi Heavy Industries Ltd.
-
Novitec Group
-
Fidanza Performance
Automotive Flywheel Market Report Scope:
| Report Attributes | Details |
|---|---|
| Market Size in 2025 | USD 7.48 Billion |
| Market Size by 2035 | USD 11.84 Billion |
| CAGR | CAGR of 4.70% From 2026 to 2035 |
| Base Year | 2025 |
| Forecast Period | 2026-2035 |
| Historical Data | 2022-2024 |
| Report Scope & Coverage | Market Size, Segments Analysis, Competitive Landscape, Regional Analysis, DROC & SWOT Analysis, Forecast Outlook |
| Key Segments | • By Type (Dual Mass Flywheel, Single Mass Flywheel) • By Material (Steel and Cast Iron, Aluminum Alloy, Carbon Fiber Composite, Others) • By Vehicle Type (Passenger Cars, Light Commercial Vehicles, Heavy Commercial Vehicles) • By Engine Type (Diesel Engine, Gasoline Engine, Hybrid Engine) • By Sales Channel (OEM, Aftermarket) |
| Regional Analysis/Coverage | North America (US, Canada, Mexico), Europe (Eastern Europe [Poland, Romania, Hungary, Turkey, Rest of Eastern Europe] Western Europe] Germany, France, UK, Italy, Spain, Netherlands, Switzerland, Austria, Rest of Western Europe]), Asia Pacific (China, India, Japan, South Korea, Vietnam, Singapore, Australia, Rest of Asia Pacific), Middle East & Africa (Middle East [UAE, Egypt, Saudi Arabia, Qatar, Rest of Middle East], Africa [Nigeria, South Africa, Rest of Africa], Latin America (Brazil, Argentina, Colombia, Rest of Latin America) |
| Company Profiles | ZF Friedrichshafen AG (SACHS), Schaeffler Group (LUK), Valeo SA, EXEDY Corporation, Aisin Seiki Co. Ltd., BorgWarner Inc., Linamar Corporation, AmTech International, AMS Automotive, Platinum Driveline, JMT Auto Limited, Tilton Engineering Inc., Ogura Clutch Co. Ltd., Standard Motor Products (SMPE), Marmon Ride Control (Autopart International), Skyway Precision Inc., Dura Automotive Systems, Mitsubishi Heavy Industries Ltd., Novitec Group, Fidanza Performance |
Frequently Asked Questions
: The primary growth drivers are recovering global vehicle production volumes, the progressive commercial expansion of dual mass flywheel technology into mainstream passenger car and commercial vehicle applications driven by NVH regulatory requirements, the growing aftermarket replacement demand from an aging global vehicle fleet, and the emerging integration of flywheel mass management within 48V mild hybrid powertrain systems.
The Automotive Flywheel market is expected to grow at a CAGR of 4.70% from 2026 to 2035.
Get in Touch
