image

Bike Sharing Market Report Scope & Overview

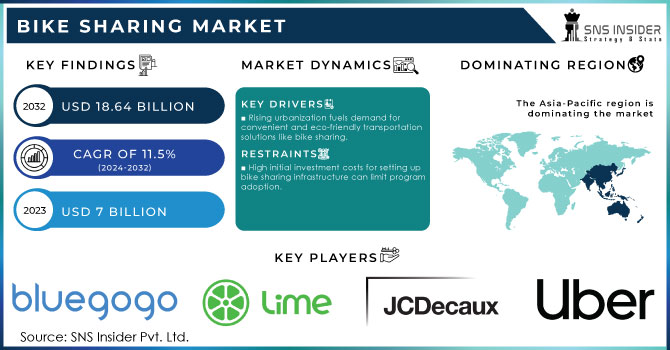
The Bike Sharing Market Size was valued at USD 7 billion in 2023 and is expected to reach USD 16.7 billion by 2031 and grow at a CAGR of 11.5% over the forecast period 2024-2031.

Bike sharing has emerged as a popular transportation solution in cities around the world. This service allows individuals to rent bicycles, both conventional and electric, for short-term use.  Users can access these bikes from designated stations throughout the city.

Bike Sharing Market Revenue Analysis

Get More Information on Bike Sharing Market - Request Sample Report

Docked systems utilize special racks that secure the bikes electronically, while dockless systems offer more flexibility, allowing users to park the bikes within designated areas or even along sidewalks. This system provides a convenient, affordable, and eco-friendly way to travel, particularly for short distances.  Locals and tourists alike can benefit from bike sharing for commuting, sightseeing, or leisure activities. The growth of the bike sharing market is attributed to several factors.  Increasing urbanization creates a demand for efficient and sustainable transportation options. Thus, future developments in bike sharing systems have the potential to make this mode of transportation even more efficient and user-friendly.

MARKET DYNAMICS:

KEY DRIVERS:

  • Rising urbanization fuels demand for convenient and eco-friendly transportation solutions like bike sharing.

As cities around the world grow denser, the need for efficient and environmentally friendly transportation solutions becomes increasingly critical. This is where bike sharing comes in. This system offers a convenient and eco-friendly way to navigate urban environments. With growing populations, cities are seeing a rise in traffic congestion and air pollution. Bike sharing provides an alternative that reduces reliance on cars, contributing to cleaner air and less crowded streets. This makes it an attractive option for both cities and residents seeking sustainable transportation solutions.

  • Technological advancements like mobile apps and GPS tracking make bike sharing user-friendly and efficient.

RESTRAINTS:

  • High initial investment costs for setting up bike sharing infrastructure can limit program adoption.

Though bike sharing offers a multitude of benefits, its widespread adoption can be hampered by the significant upfront investment required. Setting up a bike sharing program necessitates the creation of a network of docking stations or designated parking zones, along with the purchase and maintenance of a fleet of bicycles. These initial costs can be a major hurdle for cities, particularly those with limited budgets.  

  • Unfavourable weather conditions, like extreme heat or cold, might deter potential users.

OPPORTUNITIES:

  • Wider availability of electric bikes can attract those seeking a faster and easier riding experience.

  • Offering monthly or yearly subscriptions can attract frequent riders and generate recurring revenue.

CHALLENGES:

  • High upfront costs can make initiating bike sharing programs financially difficult for cities.

  • Vandalism and theft of bikes can be a significant financial burden and discourage ridership.

IMPACT OF RUSSIA-UKRAINE WAR

The ongoing war in Russia-Ukraine has disrupted the bike sharing market potentially hindering its growth trajectory. The war has caused a surge in global oil and metal prices, including steel and aluminium, which are key components in bicycle manufacturing. This translates to increased production costs for bicycles, impacting the affordability of launching or expanding bike sharing programs. The war has triggered a supply chain crisis, with shortages of crucial bike parts due to disruptions in manufacturing and transportation. This can lead to delays in deploying new bikes and hinder maintenance efforts for existing fleets. It has diverted resources away from urban development projects in many countries, potentially putting bike sharing infrastructure on the back burner as cities prioritize other areas of spending. The impact with ongoing war, could see a decline of 2-5% in the war's first year, depending on the severity and duration of the conflict.

IMPACT OF ECONOMIC SLOWDOWN

An economic slowdown can disrupt the growth of the bike sharing market in several ways.  When economic times limits, consumer spending tends to decrease. This can lead to a decline in ridership as people prioritize essential expenses and cut back on discretionary spending like bike sharing memberships or rentals. This translates to a decrease in revenue for bike sharing operators, potentially impacting their ability to maintain or expand their fleet.  The government funding for public transportation initiatives, which sometimes includes bike sharing programs, can be slashed by up to 10% during economic downturns. This financial strain can hinder the growth of bike sharing programs and limit their ability to offer subsidies or discounts that might attract new riders.  The economic slowdown can also have a bad effect on the bicycle manufacturing industry. A decrease in demand for personal bicycles, which can drop by 15-20% during recessions can impact the supply chain for bike sharing programs.

KEY MARKET SEGMENTS:
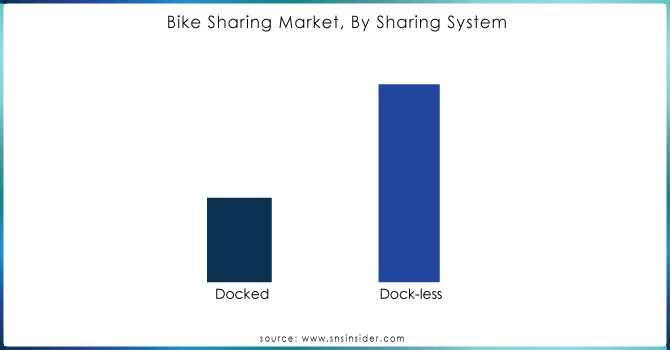
By Sharing System

  • Docked

  • Dock-less

Dockless is the dominating sub-segment in the Bike Sharing Market by sharing system holding around 60-65% of market share. Dockless systems offer unmatched convenience and flexibility. Users can locate and abandon bikes anywhere within the designated service area, eliminating the need to find a docking station. This is particularly appealing in densely populated cities or areas with limited docking infrastructure. Additionally, dockless systems often require less operational expenditure due to the absence of physical docking stations.

Bike-Sharing-Market-Segmentation-By-Sharing-System

Get a Customized Report as per your Business Requirement - Request For Customized Report

By Bike Type

  • Traditional/Convectional Bikes

  • E-Bikes

E-Bikes is the dominating sub-segment in the Bike Sharing Market by bike type holding around 50-55% of market share. E-bikes are gaining ground due to their functionality. The pedal assistance they offer makes them perfect for longer commutes, conquering hilly terrains, or simply providing a less strenuous riding experience. As battery technology improves and concerns about range anxiety diminish, e-bikes are poised to become even more popular.
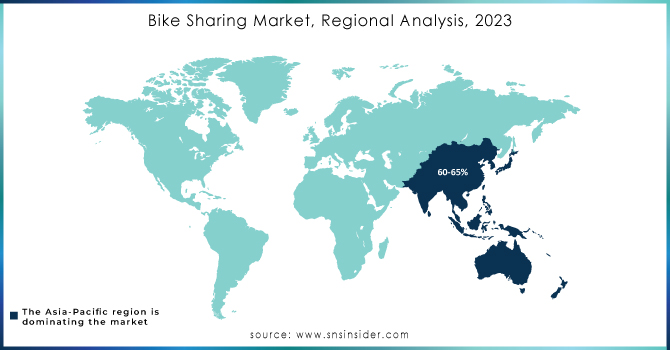
REGIONAL ANALYSES

The Asia-Pacific is the dominating region in the bike sharing market  holding 60-65%of market share. This dominance stems from the rapid urbanization creating a demand for efficient transportation, government support through subsidies and infrastructure, and a tech-savvy population readily embracing dockless systems.

Europe is the second highest region in this market fueled by a strong existing cycling culture, a growing focus on sustainability, and investments in dedicated bike lanes.

North America is the fastest growing region with rising traffic congestion, air pollution concerns, and advancements in both battery technology and bike-sharing apps are driving this rapid expansion, along with a shift towards more bike-friendly urban design in some cities.

Bike-Sharing-Market-By-Region

REGIONAL COVERAGE:

North America

  • US

  • Canada

  • Mexico

Europe

  • Eastern Europe

    • Poland

    • Romania

    • Hungary

    • Turkey

    • Rest of Eastern Europe

  • Western Europe

    • Germany

    • France

    • UK

    • Italy

    • Spain

    • Netherlands

    • Switzerland

    • Austria

    • Rest of Western Europe

Asia Pacific

  • China

  • India

  • Japan

  • South Korea

  • Vietnam

  • Singapore

  • Australia

  • Rest of Asia Pacific

Middle East & Africa

  • Middle East

    • UAE

    • Egypt

    • Saudi Arabia

    • Qatar

    • Rest of the Middle East

  • Africa

    • Nigeria

    • South Africa

    • Rest of Africa

Latin America

  • Brazil

  • Argentina

  • Colombia

  • Rest of Latin America

KEY PLAYERS

The major key players are Bluegogo (China), Neutron Holding, Inc (US), Dropbike (Canada), JCDecaux (France), Motivate (US), Jump Bikes (US), OFO (China), Anywheel Pte. Ltd, Uber Technologies Inc, Bird Rides, Inc, BIXI Montreal, Beijing Xiaoju Technology Co, Ltd., Bond Mobility (Europe) AG, Lime, LYft, Inc., Mobike, Mobycy, Nextbike GmbH, SG Bike Pte Ltd, Spin, Tembici., Youon Technology Co., Ltd and other key players.

Motivate (US)-Company Financial Analysis

Company Landscape Analysis

RECENT DEVELOPMENTS

  • In March 2023: MYBYK introduces two electric bike models: MYBYK Electric for citizens and tourists seeking convenient travel, and MYBYK Electric Cargo designed to assist gig-workers with last-mile deliveries.
  • In Dec. 2023: The U.S. government's development agency (DFC) and an inter-American investment bank (IDB Invest) are jointly contributing $23 million to Tembici, a company that rents bikes in Latin American cities. This investment aims to expand bike-sharing options in the region.

Bike Sharing Market Report Scope:

Report Attributes Details
Market Size in 2023 US$ 7 Billion
Market Size by 2031 US$ 16.7 Billion
CAGR CAGR of 11.5% From 2024 to 2031
Base Year 2023
Forecast Period 2024-2031
Historical Data 2020-2022
Report Scope & Coverage Market Size, Segments Analysis, Competitive  Landscape, Regional Analysis, DROC & SWOT Analysis, Forecast Outlook
Key Segments • by Bike Type (E-Bike, Traditional Bike)
• by Sharing System (Docked, Dock-less)
Regional Analysis/Coverage North America (US, Canada, Mexico), Europe (Eastern Europe [Poland, Romania, Hungary, Turkey, Rest of Eastern Europe] Western Europe] Germany, France, UK, Italy, Spain, Netherlands, Switzerland, Austria, Rest of Western Europe]), Asia Pacific (China, India, Japan, South Korea, Vietnam, Singapore, Australia, Rest of Asia Pacific), Middle East & Africa (Middle East [UAE, Egypt, Saudi Arabia, Qatar, Rest of Middle East], Africa [Nigeria, South Africa, Rest of Africa], Latin America (Brazil, Argentina, Colombia Rest of Latin America
Company Profiles Bluegogo (China), Neutron Holding, Inc (US), Dropbike (Canada), JCDecaux (France), Motivate (US), Jump Bikes (US), OFO (China), Anywheel Pte. Ltd, Uber Technologies Inc, Bird Rides, Inc, BIXI Montreal, Beijing Xiaoju Technology Co, Ltd., Bond Mobility (Europe) AG, Lime, LYft, Inc., Mobike, Mobycy, Nextbike GmbH, SG Bike Pte Ltd, Spin, Tembici. and Youon Technology Co., Ltd.
Key Drivers • Rising traffic congestion as a result of increased car use.
• Advancements in ride-sharing navigation technology.
RESTRAINTS • Early investment expenses are substantial.
• Frequent maintenance is required.

Frequently Asked Questions

Ans: The Bike Sharing Market was valued at USD 7 billion in 2023.

Ans:- Bike-sharing is a form of shared transportation in which individuals can borrow conventional or electric bikes for a fee or for free for a certain period of time.

Ans:- The e-bike sector is predicted to grow in popularity and market share in the worldwide bike-sharing market.

Ans:- Yes.

Ans:- Asia pacific region is anticipated to be the primary driver of the market.

Table of Contents

1. Introduction
1.1 Market Definition 
1.2 Scope
1.3 Research Assumptions

2. Industry Flowchart

3. Research Methodology

4. Market Dynamics
4.1 Drivers
4.2 Restraints
4.3 Opportunities
4.4 Challenges

5. Impact Analysis
5.1 Impact of Russia Ukraine Crisis
5.2 Impact of Economic Slowdown on Major Countries
5.2.1 Introduction
5.2.2 United States
5.2.3 Canada
5.2.4 Germany
5.2.5 France
5.2.6 UK
5.2.7 China
5.2.8 Japan
5.2.9 South Korea
5.2.10 India

6. Value Chain Analysis

7. Porter’s 5 Forces Model

8. Pest Analysis

9. Bike Sharing Market Segmentation, By Sharing System
9.1 Introduction
9.2 Trend Analysis
9.3 Docked
9.4 Dock-less

10. Bike Sharing Market Segmentation, By Bike Type
10.1 Introduction
10.2 Trend Analysis
10.3 Traditional/Convectional Bikes
10.4 E-Bikes

11. Regional Analysis
11.1 Introduction
11.2 North America
11.2.1 Trend Analysis
11.2.2 North America Bike Sharing Market, By Country
11.2.3 North America Bike Sharing Market Segmentation, By Sharing System
11.2.4 North America Bike Sharing Market Segmentation, By Bike Type
11.2.5 USA
11.2.5.1 USA Bike Sharing Market Segmentation, By Sharing System
11.2.5.2 USA Bike Sharing Market Segmentation, By Bike Type
11.2.6 Canada
11.2.6.1 Canada Bike Sharing Market Segmentation, By Sharing System
11.2.6.2 Canada Bike Sharing Market Segmentation, By Bike Type
11.2.7 Mexico
11.2.7.1 Mexico Bike Sharing Market Segmentation, By Sharing System
11.2.7.2 Mexico Bike Sharing Market Segmentation, By Bike Type
11.3 Europe
11.3.1 Trend Analysis
11.3.2 Eastern Europe
11.3.2.1 Eastern Europe Bike Sharing Market, By Country
11.3.2.2 Eastern Europe Bike Sharing Market Segmentation, By Sharing System
11.3.2.3 Eastern Europe Bike Sharing Market Segmentation, By Bike Type
11.3.2.4 Poland
11.3.2.4.1 Poland Bike Sharing Market Segmentation, By Sharing System
11.3.2.4.2 Poland Bike Sharing Market Segmentation, By Bike Type
11.3.2.5 Romania
11.3.2.5.1 Romania Bike Sharing Market Segmentation, By Sharing System
11.3.2.5.2 Romania Bike Sharing Market Segmentation, By Bike Type
11.3.2.6 Hungary
11.3.2.6.1 Hungary Bike Sharing Market Segmentation, By Sharing System
11.3.2.6.2 Hungary Bike Sharing Market Segmentation, By Bike Type
11.3.2.7 Turkey
11.3.2.7.1 Turkey Bike Sharing Market Segmentation, By Sharing System
11.3.2.7.2 Turkey Bike Sharing Market Segmentation, By Bike Type
11.3.2.8 Rest of Eastern Europe
11.3.2.8.1 Rest of Eastern Europe Bike Sharing Market Segmentation, By Sharing System
11.3.2.8.2 Rest of Eastern Europe Bike Sharing Market Segmentation, By Bike Type
11.3.3 Western Europe
11.3.3.1 Western Europe Bike Sharing Market, By Country
11.3.3.2 Western Europe Bike Sharing Market Segmentation, By Sharing System
11.3.3.3 Western Europe Bike Sharing Market Segmentation, By Bike Type
11.3.3.4 Germany
11.3.3.4.1 Germany Bike Sharing Market Segmentation, By Sharing System
11.3.3.4.2 Germany Bike Sharing Market Segmentation, By Bike Type
11.3.3.5 France
11.3.3.5.1 France Bike Sharing Market Segmentation, By Sharing System
11.3.3.5.2 France Bike Sharing Market Segmentation, By Bike Type
11.3.3.6 UK
11.3.3.6.1 UK Bike Sharing Market Segmentation, By Sharing System
11.3.3.6.2 UK Bike Sharing Market Segmentation, By Bike Type
11.3.3.7 Italy
11.3.3.7.1 Italy Bike Sharing Market Segmentation, By Sharing System
11.3.3.7.2 Italy Bike Sharing Market Segmentation, By Bike Type
11.3.3.8 Spain
11.3.3.8.1 Spain Bike Sharing Market Segmentation, By Sharing System
11.3.3.8.2 Spain Bike Sharing Market Segmentation, By Bike Type
11.3.3.9 Netherlands
11.3.3.9.1 Netherlands Bike Sharing Market Segmentation, By Sharing System
11.3.3.9.2 Netherlands Bike Sharing Market Segmentation, By Bike Type
11.3.3.10 Switzerland
11.3.3.10.1 Switzerland Bike Sharing Market Segmentation, By Sharing System
11.3.3.10.2 Switzerland Bike Sharing Market Segmentation, By Bike Type
11.3.3.11 Austria
11.3.3.11.1 Austria Bike Sharing Market Segmentation, By Sharing System
11.3.3.11.2 Austria Bike Sharing Market Segmentation, By Bike Type
11.3.3.12 Rest of Western Europe
11.3.3.12.1 Rest of Western Europe Bike Sharing Market Segmentation, By Sharing System
11.3.2.12.2 Rest of Western Europe Bike Sharing Market Segmentation, By Bike Type
11.4 Asia-Pacific
11.4.1 Trend Analysis
11.4.2 Asia Pacific Bike Sharing Market, By Country
11.4.3 Asia Pacific Bike Sharing Market Segmentation, By Sharing System
11.4.4 Asia Pacific Bike Sharing Market Segmentation, By Bike Type
11.4.5 China
11.4.5.1 China Bike Sharing Market Segmentation, By Sharing System
11.4.5.2 China Bike Sharing Market Segmentation, By Bike Type
11.4.6 India
11.4.6.1 India Bike Sharing Market Segmentation, By Sharing System
11.4.6.2 India Bike Sharing Market Segmentation, By Bike Type
11.4.7 Japan
11.4.7.1 Japan Bike Sharing Market Segmentation, By Sharing System
11.4.7.2 Japan Bike Sharing Market Segmentation, By Bike Type
11.4.8 South Korea
11.4.8.1 South Korea Bike Sharing Market Segmentation, By Sharing System
11.4.8.2 South Korea Bike Sharing Market Segmentation, By Bike Type
11.4.9 Vietnam
11.4.9.1 Vietnam Bike Sharing Market Segmentation, By Sharing System
11.4.9.2 Vietnam Bike Sharing Market Segmentation, By Bike Type
11.4.10 Singapore
11.4.10.1 Singapore Bike Sharing Market Segmentation, By Sharing System
11.4.10.2 Singapore Bike Sharing Market Segmentation, By Bike Type
11.4.11 Australia
11.4.11.1 Australia Bike Sharing Market Segmentation, By Sharing System
11.4.11.2 Australia Bike Sharing Market Segmentation, By Bike Type
11.4.12 Rest of Asia-Pacific
11.4.12.1 Rest of Asia-Pacific Bike Sharing Market Segmentation, By Sharing System
11.4.12.2 Rest of Asia-Pacific Bike Sharing Market Segmentation, By Bike Type
11.5 Middle East & Africa
11.5.1 Trend Analysis
11.5.2 Middle East
11.5.2.1 Middle East Bike Sharing Market, By Country
11.5.2.2 Middle East Bike Sharing Market Segmentation, By Sharing System
11.5.2.3 Middle East Bike Sharing Market Segmentation, By Bike Type
11.5.2.4 UAE
11.5.2.4.1 UAE Bike Sharing Market Segmentation, By Sharing System
11.5.2.4.2 UAE Bike Sharing Market Segmentation, By Bike Type
11.5.2.5 Egypt
11.5.2.5.1 Egypt Bike Sharing Market Segmentation, By Sharing System
11.5.2.5.2 Egypt Bike Sharing Market Segmentation, By Bike Type
11.5.2.6 Saudi Arabia
11.5.2.6.1 Saudi Arabia Bike Sharing Market Segmentation, By Sharing System
11.5.2.6.2 Saudi Arabia Bike Sharing Market Segmentation, By Bike Type
11.5.2.7 Qatar
11.5.2.7.1 Qatar Bike Sharing Market Segmentation, By Sharing System
11.5.2.7.2 Qatar Bike Sharing Market Segmentation, By Bike Type
11.5.2.8 Rest of Middle East
11.5.2.8.1 Rest of Middle East Bike Sharing Market Segmentation, By Sharing System
11.5.2.8.2 Rest of Middle East Bike Sharing Market Segmentation, By Bike Type
11.5.3 Africa
11.5.3.1 Africa Bike Sharing Market, By Country
11.5.3.2 Africa Bike Sharing Market Segmentation, By Sharing System
11.5.3.3 Africa Bike Sharing Market Segmentation, By Bike Type
11.5.3.4 Nigeria
11.5.3.4.1 Nigeria Bike Sharing Market Segmentation, By Sharing System
11.5.3.4.2 Nigeria Bike Sharing Market Segmentation, By Bike Type
11.5.3.5 South Africa
11.5.3.5.1 South Africa Bike Sharing Market Segmentation, By Sharing System
11.5.3.5.2 South Africa Bike Sharing Market Segmentation, By Bike Type
11.5.3.6 Rest of Africa
11.5.3.6.1 Rest of Africa Bike Sharing Market Segmentation, By Sharing System
11.5.3.6.2 Rest of Africa Bike Sharing Market Segmentation, By Bike Type
11.6 Latin America
11.6.1 Trend Analysis
11.6.2 Latin America Bike Sharing Market, By Country
11.6.3 Latin America Bike Sharing Market Segmentation, By Sharing System
11.6.4 Latin America Bike Sharing Market Segmentation, By Bike Type
11.6.5 Brazil
11.6.5.1 Brazil Bike Sharing Market Segmentation, By Sharing System
11.6.5.2 Brazil Bike Sharing Market Segmentation, By Bike Type
11.6.6 Argentina
11.6.6.1 Argentina Bike Sharing Market Segmentation, By Sharing System
11.6.6.2 Argentina Bike Sharing Market Segmentation, By Bike Type
11.6.7 Colombia
11.6.7.1 Colombia Bike Sharing Market Segmentation, By Sharing System
11.6.7.2 Colombia Bike Sharing Market Segmentation, By Bike Type
11.6.8 Rest of Latin America
11.6.8.1 Rest of Latin America Bike Sharing Market Segmentation, By Sharing System
11.6.8.2 Rest of Latin America Bike Sharing Market Segmentation, By Bike Type

12. Company Profiles
12.1  Bluegogo (China)
12.1.1 Company Overview
12.1.2 Financial
12.1.3 Products/ Services Offered
12.1.4 SWOT Analysis
12.1.5 The SNS View
12.2 Neutron Holding, Inc (US)
12.2.1 Company Overview
12.2.2 Financial
12.2.3 Products/ Services Offered
12.2.4 SWOT Analysis
12.2.5 The SNS View
12.3 Dropbike (Canada)
12.3.1 Company Overview
12.3.2 Financial
12.3.3 Products/ Services Offered
12.3.4 SWOT Analysis
12.3.5 The SNS View
12.4 JCDecaux (France)
12.4.1 Company Overview
12.4.2 Financial
12.4.3 Products/ Services Offered
12.4.4 SWOT Analysis
12.4.5 The SNS View
12.5 Motivate (US)
12.5.1 Company Overview
12.5.2 Financial
12.5.3 Products/ Services Offered
12.5.4 SWOT Analysis
12.5.5 The SNS View
12.6 Jump Bikes (US)
12.6.1 Company Overview
12.6.2 Financial
12.6.3 Products/ Services Offered
12.6.4 SWOT Analysis
12.6.5 The SNS View
12.7 OFO (China)
12.7.1 Company Overview
12.7.2 Financial
12.7.3 Products/ Services Offered
12.7.4 SWOT Analysis
12.7.5 The SNS View
12.8 Anywheel Pte. Ltd
12.8.1 Company Overview
12.8.2 Financial
12.8.3 Products/ Services Offered
12.8.4 SWOT Analysis
12.8.5 The SNS View
12.9 Uber Technologies Inc
12.9.1 Company Overview
12.9.2 Financial
12.9.3 Products/ Services Offered
12.9.4 SWOT Analysis
12.9.5 The SNS View
12.10 Bird Rides, Inc
12.10.1 Company Overview
12.10.2 Financial
12.10.3 Products/ Services Offered
12.10.4 SWOT Analysis
12.10.5 The SNS View
12.11 BIXI Montreal
12.11.1 Company Overview
12.11.2 Financial
12.11.3 Products/ Services Offered
12.11.4 SWOT Analysis
12.11.5 The SNS View
12.12 Beijing Xiaoju Technology Co, Ltd.
12.12.1 Company Overview
12.12.2 Financial
12.12.3 Products/ Services Offered
12.12.4 SWOT Analysis
12.12.5 The SNS View
12.13 Bond Mobility (Europe) AG
12.13.1 Company Overview
12.13.2 Financial
12.13.3 Products/ Services Offered
12.13.4 SWOT Analysis
12.13.5 The SNS View
12.14 LYft, Inc.
12.14.1 Company Overview
12.14.2 Financial
12.14.3 Products/ Services Offered
12.14.4 SWOT Analysis
12.14.5 The SNS View
12.15 Mobike
12.15.1 Company Overview
12.15.2 Financial
12.15.3 Products/ Services Offered
12.15.4 SWOT Analysis
12.15.5 The SNS View
12.16 Mobycy
12.16.1 Company Overview
12.16.2 Financial
12.16.3 Products/ Services Offered
12.16.4 SWOT Analysis
12.16.5 The SNS View
12.17 Nextbike GmbH
12.17.1 Company Overview
12.17.2 Financial
12.17.3 Products/ Services Offered
12.17.4 SWOT Analysis
12.17.5 The SNS View
12.18 SG Bike Pte Ltd
12.18.1 Company Overview
12.18.2 Financial
12.18.3 Products/ Services Offered
12.18.4 SWOT Analysis
12.18.5 The SNS View
12.19 Spin, Tembici.
12.19.1 Company Overview
12.19.2 Financial
12.19.3 Products/ Services Offered
12.19.4 SWOT Analysis
12.19.5 The SNS View
12.20 Youon Technology Co., Ltd
12.20.1 Company Overview
12.20.2 Financial
12.20.3 Products/ Services Offered
12.20.4 SWOT Analysis
12.20.5 The SNS View

13. Competitive Landscape
13.1 Competitive Benchmarking
13.2 Market Share Analysis
13.3 Recent Developments
13.3.1 Industry News
13.3.2 Company News
13.3.3 Mergers & Acquisitions

14. USE Cases and Best Practices

15. Conclusion

An accurate research report requires proper strategizing as well as implementation. There are multiple factors involved in the completion of good and accurate research report and selecting the best methodology to compete the research is the toughest part. Since the research reports we provide play a crucial role in any company’s decision-making process, therefore we at SNS Insider always believe that we should choose the best method which gives us results closer to reality. This allows us to reach at a stage wherein we can provide our clients best and accurate investment to output ratio.

Each report that we prepare takes a timeframe of 350-400 business hours for production. Starting from the selection of titles through a couple of in-depth brain storming session to the final QC process before uploading our titles on our website we dedicate around 350 working hours. The titles are selected based on their current market cap and the foreseen CAGR and growth.


The 5 steps process:

Step 1: Secondary Research:

Secondary Research or Desk Research is as the name suggests is a research process wherein, we collect data through the readily available information. In this process we use various paid and unpaid databases which our team has access to and gather data through the same. This includes examining of listed companies’ annual reports, Journals, SEC filling etc. Apart from this our team has access to various associations across the globe across different industries. Lastly, we have exchange relationships with various university as well as individual libraries.

Secondary Research

Step 2: Primary Research

When we talk about primary research, it is a type of study in which the researchers collect relevant data samples directly, rather than relying on previously collected data.  This type of research is focused on gaining content specific facts that can be sued to solve specific problems. Since the collected data is fresh and first hand therefore it makes the study more accurate and genuine.

We at SNS Insider have divided Primary Research into 2 parts.

Part 1 wherein we interview the KOLs of major players as well as the upcoming ones across various geographic regions. This allows us to have their view over the market scenario and acts as an important tool to come closer to the accurate market numbers. As many as 45 paid and unpaid primary interviews are taken from both the demand and supply side of the industry to make sure we land at an accurate judgement and analysis of the market.

This step involves the triangulation of data wherein our team analyses the interview transcripts, online survey responses and observation of on filed participants. The below mentioned chart should give a better understanding of the part 1 of the primary interview.

Primary Research

Part 2: In this part of primary research the data collected via secondary research and the part 1 of the primary research is validated with the interviews from individual consultants and subject matter experts.

Consultants are those set of people who have at least 12 years of experience and expertise within the industry whereas Subject Matter Experts are those with at least 15 years of experience behind their back within the same space. The data with the help of two main processes i.e., FGDs (Focused Group Discussions) and IDs (Individual Discussions). This gives us a 3rd party nonbiased primary view of the market scenario making it a more dependable one while collation of the data pointers.

Step 3: Data Bank Validation

Once all the information is collected via primary and secondary sources, we run that information for data validation. At our intelligence centre our research heads track a lot of information related to the market which includes the quarterly reports, the daily stock prices, and other relevant information. Our data bank server gets updated every fortnight and that is how the information which we collected using our primary and secondary information is revalidated in real time.

Data Bank Validation

Step 4: QA/QC Process

After all the data collection and validation our team does a final level of quality check and quality assurance to get rid of any unwanted or undesired mistakes. This might include but not limited to getting rid of the any typos, duplication of numbers or missing of any important information. The people involved in this process include technical content writers, research heads and graphics people. Once this process is completed the title gets uploader on our platform for our clients to read it.

Step 5: Final QC/QA Process:

This is the last process and comes when the client has ordered the study. In this process a final QA/QC is done before the study is emailed to the client. Since we believe in giving our clients a good experience of our research studies, therefore, to make sure that we do not lack at our end in any way humanly possible we do a final round of quality check and then dispatch the study to the client.


  •            5000 (33% Discount)


  •            8950 (40% Discount)


  •            3050 (23% Discount)

Start a Conversation

Hi! Click one of our member below to chat on Phone