Bio-polypropylene Market Analysis & Overview:
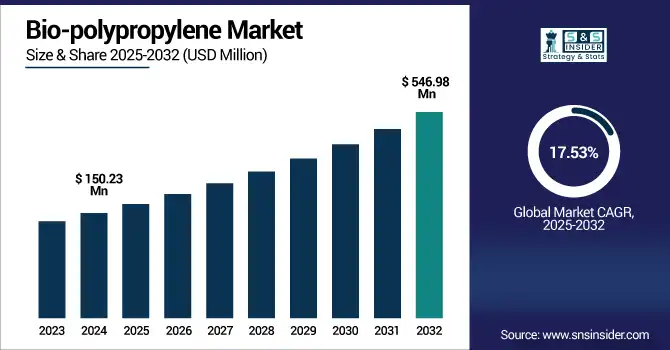
The Bio-Polypropylene Market size was valued at USD 150.23 Million in 2024 and is expected to reach USD 546.98 Million by 2032, growing at a CAGR of 17.53% over the forecast period of 2025-2032. Bio-polypropylene market analysis indicates that the increased adoption of bio-polypropylene in food-grade and medical packaging is being driven primarily by the material’s non-toxic and safe properties. Food packaging is another material that has to comply with a number of safety standards before it can be used for packaging food items further. Bio-polypropylene is a fully safe alternative for use in food contact applications, with no risk of toxin or contaminant release from direct contact between food and the container. This characteristic renders it suitable for packaging dairy products, meat, snack foods, and prepared meals. Packaging materials in the medical sector should not have any chemical reaction, or they should not be degraded by sensitive medical equipment or pharmaceuticals, which drive the bio-polypropylene market growth.
In September 2024, Citroniq raised USD 12 million in Series A for its first bio-PP plant in Nebraska, in collaboration with Lummus Technology, significantly boosting domestic bio-PP manufacturing.
Bio-Polypropylene Market Size and Forecast
-
Market Size in 2024: USD 150.23 Million
-
Market Size by 2032: USD 546.98 Million
-
CAGR: 17.53% from 2025 to 2032
-
Base Year: 2024
-
Forecast Period: 2025–2032
-
Historical Data: 2022–2023
To Get more information on Bio-polypropylene Market - Request Free Sample Report
Bio-Polypropylene Market Trends:
-
Rising demand for sustainable plastics is driving bio-polypropylene adoption, with the global bioplastics market growing at over 12% CAGR, increasing its share in packaging and consumer goods applications.
-
Strong regulatory push to reduce carbon emissions is accelerating bio-based polymer production, as bio-polypropylene can reduce lifecycle CO₂ emissions by 60–70% compared to conventional polypropylene.
-
Expansion in automotive lightweighting is boosting demand, with bio-based materials helping reduce vehicle weight by 10–15%, improving fuel efficiency.
-
Increasing use in food and flexible packaging is supporting growth, as sustainable packaging adoption has risen by over 20% annually across major FMCG brands.
-
Technological advancements in bio-feedstock processing are improving production efficiency, lowering costs by 15–25% and enhancing scalability for industrial applications.
Bio-Polypropylene Market Drivers
-
Growing Demand for Sustainable Packaging Materials Drives the Market Growth
The global trend towards sustainable and eco-friendly packaging solutions remains one of the strongest drivers in the bio-polypropylene market. With environmental apprehensions growing because of plastic waste, greenhouse gas emissions, and overflowing landfills, everybody, consumers, governments, and businesses, are starting to move towards sustainable packaging. Bio-polypropylene is derived from renewable bio-based resources such as sugarcane, cooking oil, or even biomass with various waste-to-fuel processes, so it can have a lower carbon footprint than traditional polypropylene. This recyclable, lightweight, and food-safe material makes it an ideal substitute for plastic packaging in the food, beverage, cosmetics, and bioplastics industry.
In September 2024, Braskem launched WENEW bio-polypropylene, developed from used cooking oil, to meet the rising demand for sustainable packaging in the U.S. This new bio-PP product is FDA-compliant and targets sectors like foodservice packaging, helping companies reduce their plastic footprint.
Bio-Polypropylene Market Restrain
-
High Production Costs Compared to Conventional Polypropylene May Hamper the Market Growth
One of the main restraints that are holding the bio-polypropylene market from expanding at a rapid rate is the high production cost of bio-polypropylene as compared to the petroleum-based polypropylene. Bio-PP manufacturing includes a range of steps, starting with renewable feedstocks to be processed via advanced fermentation or catalytic conversion technologies, followed by the polymerization of the resulting monomers. Such processes, however, tend to be costlier and less scalable than conventional techniques for extracting and refining fossil fuels. Moreover, the supply of relatively cheap bio-feedstock is still limited in most areas, and collecting agri or organic waste feedstock incurs further logistics capital.
Bio-Polypropylene Market Opportunities
-
Rising Use in Medical and Food Packaging Due to Safety and Compliance Creates an Opportunity in the Market
Increased adoption of bio-polypropylene in food packaging & medical applications, owing to its non-toxicity, higher chemical resistance, and FDA approval, is one of the key opportunities for bio-polypropylene. Conventional plastics with additives in the healthcare and food industries are criticized for potential leaching, toxic additives, and persistence in the environment. In contrast, the use of Bio-PP as an alternative is a safer and more eco-friendly product as it does not contain harmful ingredients such as phthalates or bisphenol A (BPA). The material can also be sterilized using gamma radiation or autoclaving techniques, both of which are important to ensure the hygiene of medical devices, as well as pharmaceutical packaging, which is driving the bio-polypropylene market trends.
In 2024, Braskem and U.S. partners launched FDA-compliant bio-PP solutions targeting medical packaging and food-safe containers. These bio-based materials meet safety and hygiene standards while reducing environmental impact, offering manufacturers a dual benefit of regulatory compliance and sustainability.
Bio-Polypropylene Market Segmentation Analysis:
By Source
Edible & Non-Edible Oils held the largest bio-polypropylene market share, around 56%, in 2024. This dominance can be attributed to the presence, renewability and low-cost of these oils as feedstocks for bio-based polymers. Bio-propylene is typically produced from oils such as soybean, palm, canola, and castor oil, because these oils have high carbon content and can be readily polymerized to form propylene. Moreover, with the improvements in processing technologies, edible and non-edible oils can be converted effectively into monomers capable of being used in the bio-polypropylene production. Both jatropha and waste cooking oil are preferable non-edible oils, well ahead of edible oils, because they are not competing with food and are also effective in promoting sustainability. Increasing environmental regulations and the low-carbon material agenda have led oil-based feedstock to be a more consistent, scalable solution, making it a stronghold in the supply chain of bio-polypropylene.
Starch held a significant bio-polypropylene market share. It is due to its low-cost availability, biodegradability, biodegradable polymers and accessibility as a renewable feedstock. Starch is a carbohydrate-rich polymer isolated from plants like corn, potatoes, and wheat, and can be metabolically and chemically converted into bio-based monomers. This property makes it an attractive feedstock, especially for bio-polypropylene, which is known for being a non-toxic substance and has been shown to have less of an environmental impact than fossil-derived feedstocks. According to the findings, in addition, starch-based bio-PP is gaining momentum in areas such as packaging, textiles, and agriculture, where compostability and sustainability are becoming more important.
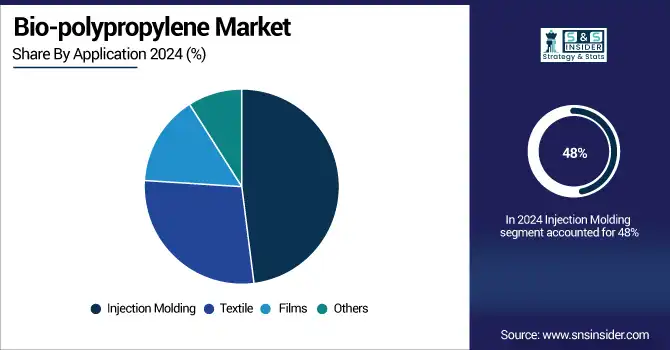
By Application
The injection molding segment held the largest market share, around 48%, in 2024. It is due to the versatility of injection molding as it is used in multiple industries including automotive, packaging, consumer goods, and electronics. The excellent processability, durability, and dimensional stability of bio-polypropylene make it a great candidate for such complex, high-precision component manufacturing in this technique. With many industries now moving towards sustainable manufacturing, bio-PP has been gaining popularity as a material to use for injection-molded parts, owing to its lower environmental impact and ability to work with existing molding equipment. The increasing demand for lightweight and sustainable materials in automotive interiors, consumer goods, and packaging products is also pushing bio-PP in injection molding.
Textile holds a significant market share in the biopolypropylene market. It is owing to the increasing demand for sustainable and eco-friendly fibers in the fashion, home furnishing, and industrial fabric arenas. Bio-polypropylene is the other versatile polymer with lightweight properties, anti-microbial properties, moisture, and chemical resistance, and good durability that can be used in apparel and non-apparel textile applications, including carpets, upholstery, non-woven fabrics, and active wear. With increasing consumer awareness regarding the adverse impacts associated with synthetic fibres on the environment, there is a gradual shift towards bio-based alternatives such as bio-PP, which targets lowering dependency on fossil fuels and reducing carbon emissions.
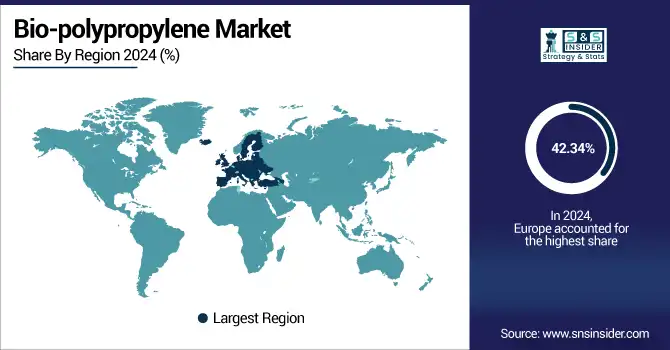
Bio-Polypropylene Market Regional Outlook:
Europe bio-polypropylene market held the largest market share, around 42.34%, in 2024. It is due to factors such as favorable environmental policies, structured water infrastructure, and policy regimes targeted at pollutant abatement and environmental sustainability. Micropollutant removal, such as PFAS and pharmaceuticals, is now required due to the new regulations of the EU’s Urban Waste Water Treatment Directive updated in 2025, creating demand for green advanced treatment chemicals. Fourth-stage wastewater treatments using green formulations are currently being used in countries like Germany, Sweden, and the Netherlands.
In December 2024, the EU will create new mandates by 2025, requiring all member states to require micropollutant removal, and which will force utilities and industries to adopt biodegradable water treatment solutions by 2027.
North America Bio-polypropylene market held a significant market share and is the fastest-growing segment in the forecast period. It is due to the high environmental regulations, community understanding of water hygiene, and the rising investment in sustainable infrastructure. But recent federal mandates such as the Clean Water Act and the recent update of PFAS to encouraged municipalities and industries to purchase nontoxic biodegradable chemicals and have accelerated that trend. EPA’s WIFIA program has also provided significant funding for large-scale water reuse and treatment systems that incorporate green chemicals. It has also accelerated with technological innovation and the commitment of corporations to ESG.
In January 2024, SNF Group introduced its range of organic coagulants branded as “GreenFloc” for the North American markets for municipalities, making the switch towards sustainable treatment solutions.
The U.S Bio-polypropylene market size was USD 27.16 million in 2024 and is expected to reach USD 106.36 million by 2032 and grow at a CAGR of 18.61% over the forecast period of 2025-2032. It is led by bold policy action and national investment in clean water infrastructure. This is driven by the U.S. Environmental Protection Agency’s 2024 ruling on drinking water limiting PFAS, which has even utilities switching to safer, greener treatment chemicals. Public-private partnership and the proliferation of broader ESG-based procurement practices across sectors are also driving sustainability-based feasibility towards the use of bio-based coagulants, corrosion inhibitors, and disinfectants. These changes are seen predominantly in high-density urban and industrial regions.
In April 2024, the EPA set PFAS limits hundreds of U.S. water utilities started obtaining green treatment chemicals and applying for federal grants to comply.
Asia pacific held a significant market share in the forecast period. It is due to rapid industrialization and urbanization, the point sources for water pollution are increasing at a very high rate in the Asia Pacific region, which is the fastest-growing market for green water treatment chemicals. With stricter environmental regulations and an increasing demand for water reuse, several countries are investing heavily in modern water treatment infrastructure, including China, India, and Indonesia. To satisfy the increasing demand for plant-based, phosphate-free, and biodegradable treatment solutions, local and international enterprises are expanding operations in the region.
In 2023, Kurita Water Industries recently formed a new subsidiary in India to extend the potent delivery of green chemical solutions to the Southeast Asia Region with its increasing need for sustainability.
Get Customized Report as per Your Business Requirement - Enquiry Now
Bio-Polypropylene Market Companies are:
The major Bio-polypropylene companies are Braskem, LyondellBasell Industries, SABIC, BASF SE, Neste, Borealis AG, Mitsui Chemicals, Inc., TotalEnergies Corbion, Global Bioenergies, and FKuR Kunststoff GmbH.
Recent Development:
-
In June 2025, Borealis AG acquired Integra Plastics AD, a Bulgarian post‑consumer polypropylene recycler, adding more than 20,000 tonnes/year of recycled PP capacity, bolstering its thrust in the circular economy
-
In March 2024, Braskem & Shell Chemicals partnered to bring certified bio-based and bio-circular polypropylene to the U.S. market using mass-balanced technology for sustainable applications.
| Report Attributes | Details |
|---|---|
| Market Size in 2024 | USD 150.23 Million |
| Market Size by 2032 | USD 546.98 Million |
| CAGR | CAGR of17.53% From 2025 to 2032 |
| Base Year | 2024 |
| Forecast Period | 2025-2032 |
| Historical Data | 2021-2023 |
| Report Scope & Coverage | Market Size, Segments Analysis, Competitive Landscape, Regional Analysis, DROC & SWOT Analysis, Forecast Outlook |
| Key Segments | •By Source (Edible & Non-Edible Oils, Starch, and Others) • By Application (Injection Molding, Textile, Films, and Others), |
| Regional Analysis/Coverage | North America (US, Canada, Mexico), Europe (Germany, France, UK, Italy, Spain, Poland, Turkey, Rest of Europe), Asia Pacific (China, India, Japan, South Korea, Singapore, Australia, Rest of Asia Pacific), Middle East & Africa (UAE, Saudi Arabia, Qatar, South Africa, Rest of Middle East & Africa), Latin America (Brazil, Argentina, Rest of Latin America) |
| Company Profiles | Braskem, LyondellBasell Industries, SABIC, BASF SE, Neste, Borealis AG, Mitsui Chemicals, Inc., TotalEnergies Corbion, Global Bioenergies, and FKuR Kunststoff GmbH |
Frequently Asked Questions
Ans: The packaging industry is driving demand for bio-polypropylene due to its growing shift toward sustainable, recyclable, and low-carbon materials. Its lightweight, durability, and compatibility with food-grade applications make it a preferred eco-friendly alternative.
Ans: Braskem, Borealis AG, LyondellBasell Industries, TotalEnergies Corbion, Mitsui Chemicals, Inc., SABIC, Trex Company, Inc., Global Bioenergies, Trinseo, Futerro.
Ans: Europe currently dominates the Bio-polypropylene market, while North America is the fastest-growing region.
Ans: Growing demand for sustainable packaging materials drives the market growth.
Ans: The Bio-polypropylene Market was valued at USD 150.23 million in 2024.
Get in Touch
