Blockchain Technology Market Report Scope & Overview:
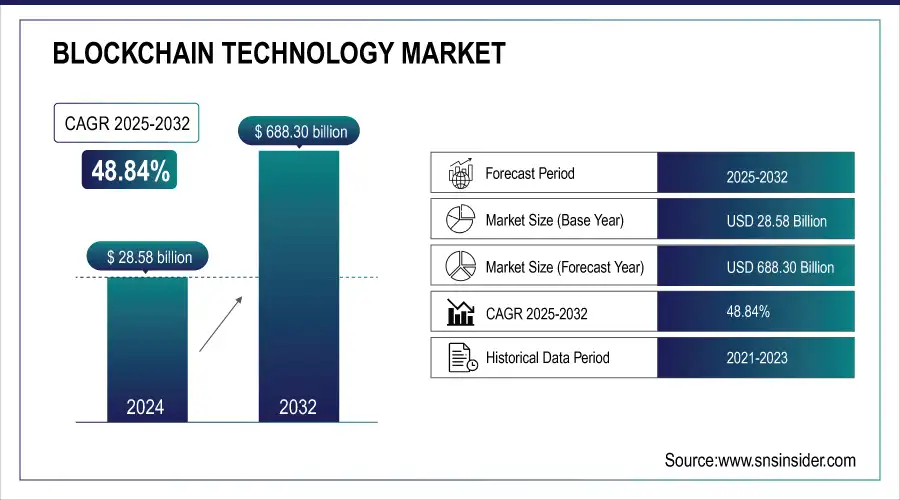
The Blockchain Technology Market was valued at USD 28.58 billion in 2024 and is expected to reach USD 688.30 billion by 2032, growing at a CAGR of 48.84% from 2025-2032.
The Blockchain Technology Market report examines the growing adoption of blockchain solutions across industry verticals such as finance, healthcare, retail, and supply chain, highlighting how businesses are leveraging the technology for enhanced transparency and security. It also analyzes decentralized application (dApp) usage trends by region, reflecting user engagement in areas like decentralized finance (DeFi), gaming, and NFT marketplaces. The report reviews cryptocurrency transaction volumes across major blockchain platforms like Bitcoin, Ethereum, and Binance Smart Chain to assess market activity and network demand. Additionally, it tracks enterprise blockchain investment patterns by organization size, showcasing how SMEs and large enterprises are allocating budgets for pilot projects and long-term deployments. New additions to the report could include insights into blockchain interoperability solutions, the adoption of zero-knowledge proof protocols for data privacy, the convergence of blockchain with AI and IoT ecosystems, and an analysis of global regulatory developments shaping the market landscape.
To Get more information on Blockchain Technology Market - Request Free Sample Report
Market Size and Forecast
-
Market Size in 2024: USD 28.58 Billion
-
Market Size by 2032: USD 688.30 Billion
-
CAGR: 48.84% from 2025 to 2032
-
Base Year: 2024
-
Forecast Period: 2025–2032
-
Historical Data: 2021–2023
Blockchain Technology Market Trends
-
Rising demand for secure, transparent, and decentralized systems is driving the blockchain technology market.
-
Growing adoption in banking, finance, supply chain, healthcare, and government sectors is boosting market growth.
-
Integration with smart contracts, digital identity, and tokenization is enhancing operational efficiency and trust.
-
Expansion of cryptocurrency and digital asset ecosystems is accelerating blockchain deployment.
-
Increasing focus on data security, fraud prevention, and regulatory compliance is shaping adoption trends.
-
Advancements in scalable, interoperable, and energy-efficient blockchain platforms are improving feasibility and performance.
-
Collaborations between technology providers, enterprises, and startups are fostering innovation and large-scale implementation.
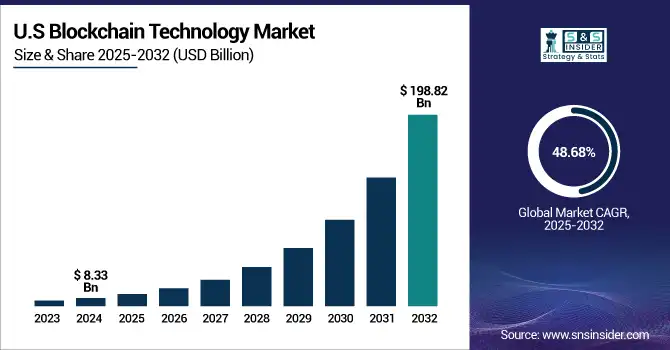
U.S. Blockchain Technology Market was valued at USD 8.33 billion in 2024 and is expected to reach USD 198.82 billion by 2032, growing at a CAGR of 48.68% from 2025-2032. Growth is driven by rising enterprise blockchain adoption, increasing cryptocurrency activity, and expanding decentralized finance (DeFi) platforms. Future demand will be fueled by Web3 innovations, blockchain-AI integrations, and favorable regulatory developments.
Blockchain Technology Market Growth Drivers:
-
Growing demand for decentralized, transparent, and secure transaction systems across industries is accelerating blockchain adoption.
One of the major reasons that organizations across sectors are adopting blockchain is the increasing necessity for safe, clear, permanent frameworks for transactions. The decentralized ledger technology of Blockchain is driving the increasing availability of the blockchain system, which makes it possible to preserve and independently check all historical data related to their transaction records, and this can prevent organizations from relying on third parties. This would be especially significant for sectors such as finance, supply chain, and healthcare, where the integrity and traceability of data are essential. Simultaneously, the emergence of decentralized finance (DeFi) and the massively growing adoption of cryptocurrencies have led to a high demand for blockchain infrastructures. Many enterprises that are aware of how blockchain can bring operational efficiencies, lower costs, and reliability in digital interactions can bring market growth.
Blockchain Technology Market Restraints:
-
Regulatory uncertainty and inconsistent compliance frameworks are limiting large-scale blockchain deployment in key sectors.
The blockchain market has been growing at a fast pace, but the rapid market growth is generally restrained by regulatory and legal uncertainties. There is a lack of a uniform regulatory framework on blockchain applications in the world today, especially on the launch of crypto-transactions, cross-border payments, data privacy, etc. The lack of clear guidelines leads to operational risks, compliance hurdles, and hesitation among enterprises and financial institutions. Furthermore, concerns over illegal activities such as money laundering and fraud conducted via blockchain-based platforms have led regulators to impose restrictive measures in some regions, potentially slowing market expansion.
Blockchain Technology Market Opportunities:
-
Integration of blockchain with AI, IoT, and zero-knowledge proof technologies is unlocking new market opportunities.
Blockchain has innovative applications with emerging technologies such as artificial intelligence, the Internet of Things, and edge computing, which will drive market growth. Incorporating AI into that same ecosystem with blockchain as its underbelly provides security in a highly decentralized framework to protect predictive analytics and real-time data processes, allowing smart contracts, secure device-to-device communication, and automated supply chain management across sectors. It will also have a wide market potential because of the increasing interest in blockchain interoperability and zero-knowledge proof applications for improved data privacy. These developments are opening up new venues for disruptive solutions, capturing venture investment, and long-term growth avenues for the blockchain space.
Blockchain Technology Market Challenge:
-
Scalability limitations and high energy consumption of blockchain networks hinder mainstream, enterprise-level adoption.
Scalability has been a long-standing challenge for the blockchain market, with current huge transaction volume networks often experiencing difficulties processing efficiently. The more popular public blockchains like Bitcoin and Ethereum are exchange-friendly but are inherently slow and have limited throughput, which causes congestion and high fees during peak usage times. Furthermore, the extensive energy usage of proof-of-work consensus mechanisms creates issues of environmental costs and operational costs as more enterprises become focused on sustainability initiatives. Even if new solution patterns like PoS and layer-2 scaling come to the fore, it would be indefensible to sway widespread scalability due to its complex technical and logistical core.
Blockchain Technology Market Segment Analysis
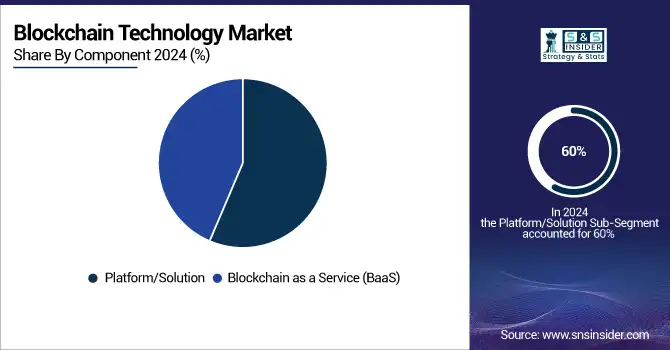
By Component, Platform/Solution led in 2024 with 60% revenue share, Blockchain as a Service growing fastest.
In 2024, the Platform/Solution segment dominated the market and accounted for 60% of revenue share due to the growing demand for secure, transparent, and efficient enterprise blockchain infrastructure. Organizations in finance, supply chain, and healthcare are quickly installing blockchain platforms that make transactions easier, ensure better data integrity, and help to track physical assets efficiently in real time. This segment is further driven by the increased adoption of decentralized finance platforms and digital asset management.
The Blockchain as a Service is expected to register the fastest CAGR during the forecast period, owing to the rising interest of enterprises in affordable, elastic, and managed blockchain solutions. BaaS enables companies to launch, host, and use blockchain networks in a potent and flexible environment without worrying about all the underlying support infrastructure. The demand dynamics are witnessing an uptrend due to the increasing adoption by small and medium enterprises along with growing integration of blockchain with the amount of cloud services, AI, and IoT.
By Type, Private blockchain dominated in 2024, Hybrid blockchain expected to grow at fastest CAGR.
The Private blockchain segment dominated the market and accounted for a significant revenue share in 2024, because of the growing need for businesses to have a highly secure and permissioned network where only selected or authorized entities have access to the data, along with the privilege to validate transactions. Many sectors such as banking, healthcare, and logistics, are quickly switching to the private blockchain due to its better security, scalability, and compliance features.
The hybrid blockchains are anticipated to achieve the fastest CAGR from 2025 to 2032 because of their ability to combine the advantages of personal and nonprofit networks. Using this model, organizations can manage sensitive data in a private blockchain while still utilizing an underlying public chain for transparency and auditability. Hybrid blockchains are paving the way for hybridization within supply chain, healthcare, energy, and other sectors that desire data privacy while simultaneously remaining open to create more operational efficiencies.
By Application, Payments led in 2024 with significant revenue, Digital Identity expected to grow fastest.
In 2024, the Payments segment led the blockchain technology market and accounted for a significant revenue share, attributable to the increasing adoption of cryptocurrencies and blockchain-oriented payment solutions for secure, real-time, and cross-border transactions. To lower transaction costs, strengthen transparency, and facilitate settlement speed, financial institutions, fintech, and e-commerce platforms are incorporating blockchain. This segment is also supported by the rising number of users around decentralized finance applications and digital wallets.
The Digital Identity is expected to grow at the fastest CAGR in the digital identity & access management market from 2024 to 2032, as various enterprises are becoming wary of data security and are facing more identity thefts and privacy breaches in their digital ecosystem. Due to their unique attributes of distributed, immutable, and self-sovereign identity verification, blockchain-based digital identity solutions are well-suited to replace centralized identity solutions in applications including banking, healthcare, government services, and the online space.
By Deployment, Proof-of-Concept dominated in 2024 with 66% revenue, Production deployment growing fastest.
In 2024, the Proof-of-Concept segment dominated the market and accounted for 66% of revenue share as enterprises continued to spend on small-scale, controlled blockchain tests to determine feasibility, performance, and security. As one of the primary blockchain use cases for enterprise, industries such as finance, logistics, and healthcare have been experimenting with asset tracking, digital identity, and contract management. This proof-of-concept phase enables organizations to identify integration issues and regulatory constraints before mass-scale deployment
The production is expected to exhibit the fastest CAGR due to growing enterprise confidence in the scalability, security, and ROI of blockchain. After successful PoC and pilot projects, banking, supply chain, healthcare, and many other industries are now ready for full-scale operational deployments. This move is led by applications in cross-border payments —that is, decentralized finance, smart contracts, and supply chain transparency.
By Industry, BFSI led in 2024 with largest revenue share, Retail & Consumer Goods growing fastest.
The BFSI segment dominated the market and accounted for a significant revenue share in 2024 due to increasing demand of secure, transparent, and efficient transactions in this sector during the forecast period 15. Most of its technology handles aspects such as cross-border payments, fraud prevention, digital identity, and others. The banking and financial institutions also use blockchain for faster settlement, transaction cost reduction, and improved regulatory compliance.
The Retail & Consumer Goods is projected to register the fastest CAGR owing to the ability of blockchain technology to provide more supply chain transparency, traceability, and customer trust. Blockchain allows real-time tracking of products from manufacturer to consumer, providing reliable proof of authenticity and reducing incidences of counterfeiting. Blockchain is also being used by retailers to make boosts to loyalty programs, digital payments, and customer data privacy.
Blockchain Technology Market Regional Analysis
North America Blockchain Technology Market Insights
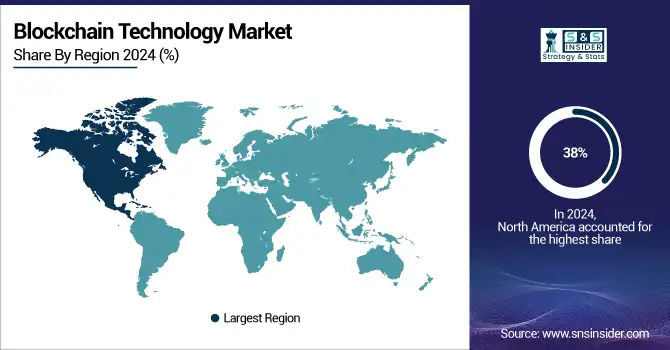
In 2024, North America dominated the market and accounted for the largest share of more than 38%, due to the U.S leading in adopting blockchain technology in multiple industries, including BFSI, healthcare, and supply chain. North America maintains its supremacy on the back of big blockchain providers and vast investment in Blockchain R&D.
Get Customized Report as per Your Business Requirement - Enquiry Now
Asia Pacific Blockchain Technology Market Insights
Asia Pacific is expected to register the fastest CAGR during the forecast period. This increase is backed by a rise in the adoption of blockchain technology across several countries, including China, India, and Japan, due to governmental support, exploring digital currencies, and large-scale investments in blockchain-oriented solutions across multiple domains.
Europe Blockchain Technology Market Insights
Europe’s Blockchain Technology Market is witnessing significant growth due to rising adoption across banking, finance, and supply chain sectors. Increasing demand for secure, transparent, and decentralized transaction solutions is driving market expansion. Government initiatives supporting blockchain integration, coupled with the growth of fintech and digital assets, are further boosting adoption.
Middle East & Africa and Latin America Blockchain Technology Market Insights
The Middle East & Africa and Latin America Blockchain Technology Markets are growing steadily, driven by increasing adoption in banking, finance, and supply chain management. Governments are promoting digital transformation and blockchain-friendly regulations, fostering innovation. Expanding fintech ecosystems, rising demand for secure and transparent transactions, and growing awareness of decentralized solutions are further accelerating blockchain integration, creating new opportunities across various industries in these regions.
Blockchain Technology Market Competitive Landscape:
Microsoft Corporation
Microsoft Corporation, founded in 1975 and headquartered in Redmond, Washington, is a global technology leader providing software, cloud computing, and enterprise solutions. The company delivers innovative platforms including Azure, Office 365, and AI-driven services, enabling businesses to enhance productivity, security, and digital transformation. Microsoft is also advancing blockchain integration, offering enterprise-grade solutions that connect diverse networks, improve interoperability, and support scalable, secure distributed applications.
-
November 2024: Microsoft announced plans to support interoperability between Azure Blockchain Service and other major blockchain networks.
Amazon Web Services (AWS)
Amazon Web Services (AWS), launched in 2006 and headquartered in Seattle, Washington, is a leading cloud computing provider offering infrastructure, storage, and application services to enterprises globally. AWS enables businesses to deploy scalable and secure solutions across AI, IoT, and blockchain ecosystems. Its cloud-based blockchain services facilitate faster transaction analysis, multi-protocol support, and enhanced application responsiveness, empowering organizations to leverage decentralized networks efficiently.
-
February 2024: AWS enhanced Amazon Managed Blockchain Query to provide access to non-finalized blockchain data, enabling applications to respond swiftly to recent events.
-
May 2024: AWS expanded support to additional blockchain protocols, including Hyperledger Fabric v2.5.
Key Players
The major key players along with their products are
-
IBM Corporation
-
Microsoft Corporation
-
Amazon Web Services (AWS)
-
SAP SE
-
R3
-
Ripple Labs Inc.
-
ConsenSys
-
Bitfury Group Limited
-
Digital Asset Holdings LLC
-
Hewlett Packard Enterprise (HPE)
-
Huawei Technologies Co., Ltd.
-
Blockstream
-
Chain, Inc.
-
Coinbase Global, Inc.
-
BitGo, Inc.
-
Bakkt Holdings, LLC
-
VeChain Foundation
-
Tezos Foundation
|
Report Attributes |
Details |
|
Market Size in 2024 |
US$ 28.58 Billion |
|
Market Size by 2032 |
US$ 688.30 Billion |
|
CAGR |
CAGR of 48.84 % From 2025 to 2032 |
|
Base Year |
2024 |
|
Forecast Period |
2025-2032 |
|
Historical Data |
2021-2023 |
|
Report Scope & Coverage |
Market Size, Segments Analysis, Competitive Landscape, Regional Analysis, DROC & SWOT Analysis, Forecast Outlook |
|
Key Segments |
• By Component (Platform/Solution, Blockchain as a Service (BaaS)) |
|
Regional Analysis/Coverage |
North America (US, Canada, Mexico), Europe (Eastern Europe [Poland, Romania, Hungary, Turkey, Rest of Eastern Europe] Western Europe] Germany, France, UK, Italy, Spain, Netherlands, Switzerland, Austria, Rest of Western Europe]), Asia Pacific (China, India, Japan, South Korea, Vietnam, Singapore, Australia, Rest of Asia Pacific), Middle East & Africa (Middle East [UAE, Egypt, Saudi Arabia, Qatar, Rest of Middle East], Africa [Nigeria, South Africa, Rest of Africa], Latin America (Brazil, Argentina, Colombia, Rest of Latin America) |
|
Company Profiles |
IBM Corporation, Microsoft Corporation, Amazon Web Services (AWS), Oracle Corporation, SAP SE, R3, Ripple Labs Inc., ConsenSys, Bitfury Group Limited, Guardtime, Digital Asset Holdings LLC, Hewlett Packard Enterprise (HPE), Huawei Technologies Co., Ltd., Blockstream, Chain, Inc. |
Frequently Asked Questions
By component, the Platform/Solution segment led in 2024 with 60% revenue share, while Blockchain as a Service is expected to grow fastest.
North America dominated the Blockchain Technology Market in 2024, holding more than 38% of the global market revenue.
Rising demand for decentralized, secure, and transparent transaction systems across BFSI, supply chain, healthcare, and government sectors drives market growth.
In 2024, the Blockchain Technology Market was valued at USD 28.58 billion, indicating strong foundational growth for future expansion.
The Blockchain Technology Market is expected to grow at a CAGR of 48.84% from 2025 to 2032, reflecting rapid adoption across industries.
Get in Touch
