Bone Densitometer Market Report Scope & Overview:
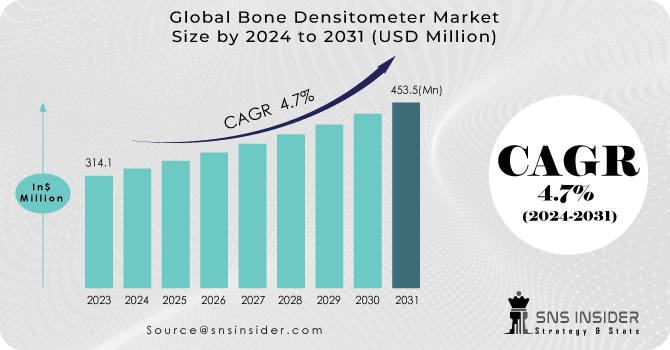
Bone Densitometers Market Size was valued at USD 275.2 Million in 2023 and is expected to reach USD 403.86 million by 2032, growing at a CAGR of 4.37% over the forecast period 2024-2032.
The Bone Densitometers Market report provides key statistics on the state of the bone densitometers manufacturers market and is a valuable source of guidance and direction for companies and individuals interested in the industry. It describes the incidence and prevalence of osteoporosis and provides a geographic perspective of disease burden. The report offers a look at trends in shipments of bone densitometers and installed bases to track market dynamics. Prescription trends for bone health assessments reveal physician referral patterns and diagnostic adoption rates. Similarly, healthcare spending is often divided between government, insurers, and out-of-pocket costs. The report also examines the technological progress in DXA, QCT, and AI-driven diagnostics, and considers regulatory compliance and market accessibility in the key regions. Stakeholders can leverage these insights to comprehend the growth-inducing factors, challenges, and impediments in the market and gain foresight of opportunities in the near future.
Get more information on Bone Densitometer Market - Request Sample Report
Rising awareness about bone health and the growing prevalence of osteoporosis are factors contributing to the growth of the bone densitometers market. More than 10 million adults in the U.S. have osteoporosis, according to the National Osteoporosis Foundation, and another 43 million have low bone mass. The U.S. accounted for a 34% share of the global market in 2023, aided by an established healthcare framework and relatively high awareness of bone health. This prominence has also been aided by government initiatives focusing on early detection and prevention of bone-related ailments.
Market Dynamics
Driver
-
Rising prevalence of osteoporosis and related bone disorders is increasing the demand for bone densitometer devices.
The increasing prevalence of osteoporosis and bone-related disorders is a primary factor contributing to the increased adoption of bone densitometer devices. Osteoporosis affects around 200 million women worldwide. The disease results in about 8.9 million fractures per year globally, or one fracture every three seconds. Osteoporosis-related fractures have a substantial impact. Hip fractures, in particular, have mortality rates of up to 20-24% in the first year after fracture. Among survivors, 40% cannot walk independently and 33% are completely dependent, or need nursing home care, in the year after the fracture.
Osteoporosis rates vary widely by location. For instance, a systematic review and meta-analysis revealed that the prevalence ranges from 4.1% in the Netherlands to 52.0% in Turkey, with continental variations spanning from 8.0% in Oceania to 26.9% in Africa. In the United States, approximately 10 million individuals are diagnosed with osteoporosis, and about 50% of women and 25% of men over the age of 50 are expected to experience an osteoporotic fracture. These shocking figures highlight the urgent need for early detection and treatment. Bone densitometer devices that measure the bone mineral density are of paramount importance for the early detection of osteoporosis, allowing timely treatment to prevent fractures. With the population across the globe aging, osteoporosis and related fractures are expected to increase in prevalence, adding to this potential demand for services in bone densitometry. This phenomenon underscores the need for easy access to accurate bone health assessment tools to help curb the individual and societal burdens of osteoporosis.
Restraint:
-
Limited awareness and education about bone health and densitometry among both healthcare professionals and the general population hinder early diagnosis and treatment.
A lack of awareness of bone health and densitometry education in both the public and healthcare providers can drastically prevent early diagnosis and treatment of osteoporosis. A survey conducted worldwide by the International Society for Clinical Densitometry (ISCD) and the International Osteoporosis Foundation (IOF) found that whereas more than 70% of institutions reported adequate access of dual-energy X-ray absorptiometry (DXA) services, less than 50% of services reported adherence to basic DXA quality assurance and reporting procedures. Furthermore, more than 50% of these institutions stated the need for continuing education in osteoporosis and DXA for operators and interpreters. Another study conducted in India using the Osteoporosis Knowledge Assessment Tool (OKAT) to evaluate osteoporosis knowledge among postmenopausal women demonstrated that only a small percentage of the participants were aware of the disease. This knowledge gap contributes to lower implementation of preventative measures and delayed diagnosis.
Likewise, based on data from a study in the Northern Border region in Saudi Arabia, utilizing the OKAT, 15.4% of participants showed poor knowledge, 53.9% showed moderate knowledge, and only 30.6% showed good knowledge concerning osteoporosis. The average percentage of correct answers was 44.1% a deficiency of knowledge. This widespread ignorance and misunderstanding among both healthcare providers and the public hamper the diagnosis and treatment of osteoporosis. Thus, inhibiting the adoption of bone densitometry technologies for early detection of diseases in the bone densitometers market.
Opportunity:
-
Technological advancements, such as the integration of artificial intelligence and machine learning algorithms, are enhancing the accuracy and efficiency of bone densitometer devices.
The introduction of AI and ML in bone densitometer devices represents a huge opportunity to improve the screening of osteoporosis and the assessment of bone health. A recent study published in 2024 investigated the diagnostic performance of an AI system for osteoporosis screening using dual-energy computed tomography (DECT) images, with quantitative computed tomography (QCT) as the reference standard. The AI system demonstrated a mean relative measurement error (RME) of -15.93%, compared to -25.47% for manual assessments, indicating higher accuracy. Furthermore, the AI system achieved a coefficient of determination (R²) of 0.973 with QCT results, surpassing the manual system's R² of 0.948. In terms of diagnostic performance, the AI system's area under the curve (AUC) was 0.979 for detecting osteoporosis and 0.980 for identifying low bone mineral density (BMD), reflecting excellent diagnostic capabilities. These findings underscore the potential use of AI to improve the accuracy and efficiency of bone densitometry, thereby enabling timely diagnosis and treatment of osteoporosis. With osteoporosis becoming increasingly prevalent globally, the implementation of AI-centric bone densitometer systems may serve as a key intervention toward combating this issue of public health concern.
Challenge:
-
High costs associated with bone densitometer devices and limited reimbursement policies can impede widespread adoption, particularly in developing regions.
The high cost of bone densitometer devices poses a significant challenge to their widespread adoption, particularly in developing regions. Dual-energy X-ray absorptiometry (DEXA), the gold standard for assessing bone mineral density, uses equipment that can cost anywhere between about $9,180 and $199,000, depending on the model and features. These demands can be daunting for small and medium healthcare facilities with tight budgets, preventing them from acquiring and deploying these advanced diagnostic tools. Adding to that are reimbursement challenges. In the United States, for example, Medicare reimbursement rates for DEXA scans have declined by over 60% between 2006 and 2010, making it economically unfeasible for many providers to offer these services. This reduction in reimbursement cut has resulted in reduced utilization of DEXA despite its gold standard status for measuring bone density. As a result, fewer patients, especially those at risk for osteoporosis, are entering important diagnostic tests that can lead to an increased risk of fractures and higher healthcare costs.
Segment Analysis
By Technology
In 2023, axial bone densitometry held the largest share of the market and accounted for 49% of the share. This dominance is largely due to its utility in assessing bone mineral density (BMD) specifically within the axial skeleton, which encompasses the spine and hip. Axial bone densitometers use dual-energy X-ray absorptiometry (DEXA) technology and can accurately diagnose conditions such as osteoporosis. The increasing prevalence of osteoporosis, driven by demographic shifts and lifestyle factors, has fueled the demand for these devices. According to government statistics, there is a rising demand for precise diagnostic instruments for the accurate management of bone-associated ailments. Another relevant aspect of the extension of axial bone densitometry is related to its utility for fracture risk assessment and monitoring treatment effects. In light of the aging population worldwide, the market for axial bone densitometers is anticipated to grow as it provides early detection and management of problems related to bone health. This highlights the growing role of advanced technology in the healthcare sector to meet increasing needs in the area of bone health and fracture management.
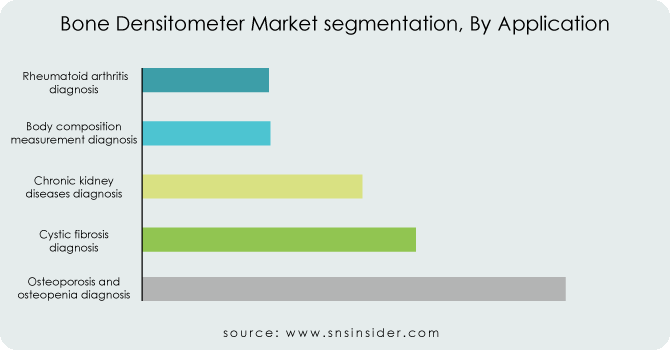
By Application
In 2023, osteoporosis and osteopenia held the major share of the market revenue 31%. The most important factor contributing to this phenomenon is the high global prevalence of these common diseases. Osteoporosis is estimated to affect about 200 million people worldwide, and 8 of 10 osteoporosis patients are women. As bone mineral density decreases, the risk of fracture increases, so early detection and management are essential. Growing government initiatives in preventive health and early intervention strategies have increased the demand for bone densitometers in the diagnosis and management of osteoporosis and osteopenia. Market growth is further propelled by growing awareness regarding bone health and on-time bone density screening. Regular bone health screenings are particularly needed among the elderly and have become a component of healthcare schemes in many countries. This trend is likely to continue, with an increasing focus on individualized bone health monitoring and preventive treatments.
By End-use
The hospitals segment accounted for the largest revenue share 54% of the market in 2023. As a result, DXA scans are typically performed in hospitals due to the presence of appropriate equipment and experienced healthcare workers. This dominance has been bolstered by rising demand for hospital services driven by an aging population and an increasing prevalence of chronic disease. Government investments in healthcare infrastructure have also improved the capacity of hospitals to offer advanced diagnostic services such as bone densitometry. Hospitals offer comprehensive care, including diagnosis, treatment, and management of bone-related disorders. Furthermore, the incorporation of advanced technology like AI in Diagnostic Devices is anticipated to improve the efficiency and accuracy of bone density measurements in a hospital setting. This development alongside hyper conducive reimbursement policy has solidified the position of hospitals in the bone densitometers market.
Need any customization research on Bone Densitometer Market - Enquiry Now
Regional Analysis
North America accounted for the highest market share 43% of the bone densitometers market. The market is driven by a strong healthcare infrastructure, high bone health awareness, and the strong presence of key market players. This market position has been bolstered by programs within the U.S. government aimed at better health outcomes, such as those geared toward the prevention and early detection of chronic conditions such as osteoporosis. Bone densitometry business growth in the region, contributed by the National Osteoporosis Foundation initiatives creating awareness about bone health.
The Asia Pacific region is experiencing rapid growth in the bone densitometers market, driven by a rapidly aging population and increasing healthcare expenditure. China and Japan are leading the way in this growth, including heavy investments in healthcare infrastructure and national health programs aimed at bone health. In these countries, government initiatives are in place to extend access to diagnostic technologies, particularly bone densitometry, given the growing incidence of osteoporosis and associated diseases. For example, China's healthcare reforms have emphasized the importance of preventive care, leading to increased adoption of bone densitometry services.
Key Players
Key Service Providers/Manufacturers
-
G.E. Healthcare (Lunar iDXA, Prodigy)
-
Hologic Inc. (Discovery DXA System, Horizon DXA System)
-
Siemens Healthcare Private Limited (MAMMOMAT Inspiration, Multix Fusion)
-
Hitachi, Ltd. (Supria 16, Supria 32)
-
DMS Imaging (Stratos, Stratos DR)
-
Scanflex Healthcare AB (AccuDexa, pDEXA)
-
OSTEOSYS Corp. (EXA-3000, EXA-PRESTO)
-
Swissray (ddRFormula, ddRCompact)
-
FURUNO ELECTRIC CO., LTD. (CM-200, CM-300)
-
Xingaoyi Medical Equipment Co.,Ltd. (XY-DEXA, XY-6000)
-
Osteometer Meditech Inc. (DTX-200 DexaCare)
-
Aarna Systems and Wellness Pvt. Ltd. (Ultrasound Bone Densitometer, Portable Bone Densitometer)
-
Shenzhen Shimai Medical Equipment Co., Ltd. (Portable Ultrasound Bone Densitometer SM-B30, SM S60 Ultrasonic Scanner)
-
MS Healthcare (Sonost 2000 Bone Mineral Density Machine, Sonost 3000 Bone Mineral Density Machine)
-
MAK Healthcare Inc. (BMD Machines)
-
Ecolight S.P.A. (EchoS, EchoStation)
-
Medilink (Medix DR, Medix 90)
-
Lone Oak Medical Technologies (AccuDEXA)
-
BeamMed Ltd (Sunlight MiniOmni, Sunlight Omnisense 8000S)
Recent Developments
-
In October 2024, BeamMed Ltd. launched the UltraSonic Bone Sonometer, which uses sophisticated ultrasound technology to produce detailed images that provide improved measurements of bone density.
-
In September 2023, OsteoSys Corp. became the first firm to commercially manufacture bone densitometers for laboratory animals for preclinical use, allowing researchers to conduct non-destructive measures of bone mineral density and body composition in their laboratory animals.
| Report Attributes | Details |
|---|---|
| Market Size in 2023 | USD 275.2 Million |
| Market Size by 2032 | USD 403.86 Million |
| CAGR | CAGR of 4.37% From 2024 to 2032 |
| Base Year | 2023 |
| Forecast Period | 2024-2032 |
| Historical Data | 2020-2022 |
| Report Scope & Coverage | Market Size, Segments Analysis, Competitive Landscape, Regional Analysis, DROC & SWOT Analysis, Forecast Outlook |
| Key Segments | • By Technology (Axial bone densitometry, Peripheral bone densitometry) • By Application (Chronic Kidney Diseases Diagnosis, Osteoporosis And Osteopenia Diagnosis, Cystic Fibrosis Diagnosis, Rheumatoid Arthritis Diagnosis, Body Composition Measurement) • By End Use (Specialty Clinics, Hospitals, Others) |
| Regional Analysis/Coverage | North America (US, Canada, Mexico), Europe (Eastern Europe [Poland, Romania, Hungary, Turkey, Rest of Eastern Europe] Western Europe] Germany, France, UK, Italy, Spain, Netherlands, Switzerland, Austria, Rest of Western Europe]), Asia Pacific (China, India, Japan, South Korea, Vietnam, Singapore, Australia, Rest of Asia Pacific), Middle East & Africa (Middle East [UAE, Egypt, Saudi Arabia, Qatar, Rest of Middle East], Africa [Nigeria, South Africa, Rest of Africa], Latin America (Brazil, Argentina, Colombia, Rest of Latin America) |
| Company Profiles | GE Healthcare, Hologic Inc., Siemens Healthcare Private Limited, Hitachi Ltd., DMS Imaging, Scanflex Healthcare AB, OSTEOSYS Corp., Swissray, FURUNO ELECTRIC CO., LTD., Xingaoyi Medical Equipment Co., Ltd., Osteometer Meditech Inc., Aarna Systems and Wellness Pvt. Ltd., Voden Medical Instruments S.p.A., Shenzhen Shimai Medical Equipment Co., Ltd., MS Healthcare, MAK Healthcare Inc., Echolight, Medilink, Lone Oak Medical Technologies, BeamMed Ltd. |
Frequently Asked Questions
Ans: The Hospitals segment dominated the Bone Densitometers Market.
Ans: Technological advancements, such as the integration of artificial intelligence and machine learning algorithms, are enhancing the accuracy and efficiency of bone densitometer devices.
Ans. The CAGR of the Bone Densitometers Market is 4.37% during the forecast period of 2024-2032.
Ans: The North American region dominated the Bone Densitometers Market in 2023.
Ans. The projected market size for the Bone Densitometers Market is USD 403.86 million by 2032.
Get in Touch
