Building Twin Market Size & Overview:
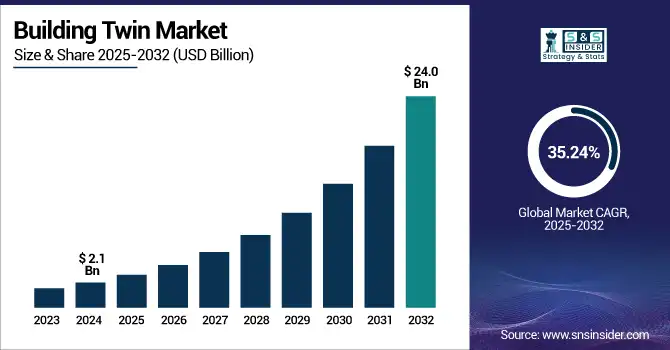
The Building Twin Market size was valued at USD 2.1 billion in 2024 and is expected to reach USD 24.0 billion by 2032, growing at a CAGR of 35.24% during 2025-2032.
To Get more information on Building Twin Market - Request Free Sample Report
The building twin market growth is driven by smart building adoption, energy efficiency requirements, and IoT and AI integration in the building and facility management sectors. A building twin is a digital replica of a physical structure that enable real-time monitoring, predictive maintenance, and operational efficiencies. The factors affecting market expansion are demand for cheaper building operations, improved occupant experience, and sustainability agendas. With the continuous urban development and infrastructural upgrades, the pace of connected intelligent buildings has grown immensely.
On top of it all, states of 5G networks and cloud technologies are almost promising urgent yet scalable deployments of building twins. Government initiatives toward smart cities also work in favor of the market. Building twin market trends indicate the growing adoption of AI to generate predictive insights, deeper integration with Building Information Modeling, and deeper movement into cloud-native digital twin platforms. Market size is projected to sustain strong double-digit growth till 2032.
Witnessing a CAGR of 36.7%, the U.S. building twin market size will be valued at USD 3.8 billion by 2032 from USD 0.3 billion in 2024. The growth is well set in action by 5G and AI, along with machine learning, for real-time monitoring and operational efficiency in advanced modes. More focus on sustainability and hefty investments in smart city infrastructure are acting as catalysts for enhanced adoption in commercial and industrial sectors.
Building Twin Market Dynamics:
Drivers:
-
Increased Efficiency and Automation Drive Smart Building Technology Adoption
Smart infrastructure demand is rising as digital twins provide real-time data on the building's systems and machinery, making buildings more operationally efficient, less energy-consuming, and more comfortable. As smart buildings equipped with IoT sensors and connected systems generate massive data, building twins can simulate and analyze. Moreover, digital twins with embedded AI, Machine learning, and automation provide the maximum potential for energy optimization, and predictive maintenance, among others. This will be adopted more by governments and private enterprises in the commercial and industrial sectors to deal with sustainability and cost.
For instance, the U.S. government invested USD 1.5 billion in smart city projects and the adoption of digital twin technology in urban infrastructure in 2023. It will support increased energy efficiency, carbon emissions reductions, and sustainability in public buildings. This funding is expected to increase up to USD 3 billion by 2025, which will accelerate the adoption of digital twins for infrastructure management
Restraints:
-
High Costs and Technical Barriers Hinder Widespread Adoption
Despite these benefits, the approach is burdened with the challenges posed by the high CAPEX and complexity of technology involved in the building twin market. An extended digital twin requires sophisticated hardware (sensors and gateways), powerful networking, cloud platform tools/services, and smart solutions architects for system integration and data analysis. Such costs can be significant, particularly for small- and medium-sized enterprises. The required technical skills needed to create, manage, and interpret digital twin systems do not yet match supply and demand, creating another barrier to adoption. Moreover, the absence of standard protocols among platforms also makes the integration challenging. This causes organizations to put off implementation or choose less robust solutions.
Opportunities:
-
Expansion of Smart City Initiatives Fuels Demand for Business Software Solutions
Demand for building twin solutions is further stimulated due to the rapid rise of smart city initiatives globally. Governments and municipalities are increasingly investing in smart infrastructure to enhance urban life, sustainability, and energy efficiency. By simulating and optimizing performance in real-time, implementing building twins can be effective in managing public facilities, transportation hubs, and commercial buildings. Smart cities, for their part, heavily depend on energy-saving and safety monitoring technologies, that smart buildings can deliver through reduced energy use, tracking of occupancy patterns over time, and ensuring safety. Driven by rising investments in 5G, cloud computing, and digital infrastructure, its adoption will expand across geographic regions including North America, Europe and parts of Asia-Pacific more recently.
According to a study, more than 60% of the world population will live in cities by 2025, and that translates into the necessity for smart and connected infrastructure over the next few decades. Investments from Government-backed smart city projects are expected to cross USD 30 billion by 2025 to help ensure the implementation of Building Twin technologies to accelerate urban infrastructure alignment.
Challenges:
-
Rising Data Privacy and Cybersecurity Concerns Drive Demand for Secure Business Software Solutions
Data privacy and cybersecurity are among the most prominent challenges to the building twin market. Twins created for building output rely on real-time data gathered from sensors, systems, and connected devices, which absorb a degree of cyber threat. Digital twin platforms can be hacked and manipulated, resulting in data being hacked and compromised, in the direction of misuse of sensitive information. With buildings increasingly interconnected, this attack surface grows, and security measures must improve as well, including encryption, multi-layer authentication, and continuous monitoring. Regulatory compliance (GDPR and CCPA) also presses organizations to start with robust data protection frameworks. Neglecting these issues could stifle adoption, particularly within critical infrastructure circles.
In 2023, the Cybersecurity and Infrastructure Security Agency (CISA) reported that nearly 70% of the U.S. critical infrastructure sectors, including buildings, face increasing cybersecurity threats.
Building Twin Market Segmentation Analysis:
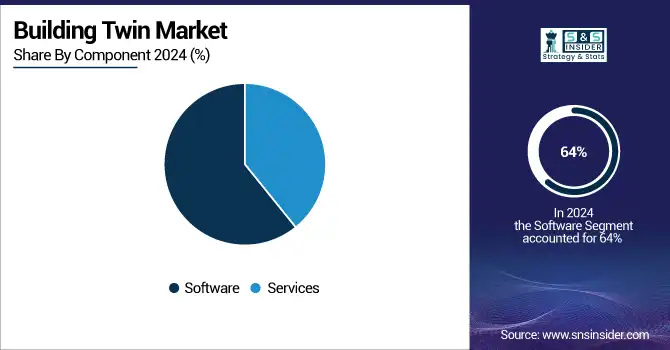
By Component
In 2024, the software segment dominated the market and accounted for 64% of the building twin market share, driven by the advantages of using integrated platforms that provide for real-time monitoring, predictive analytics, and energy optimization. The increased integration of technologies into software incorporates AI, machine learning, and IoT to ensure sustainability and cost efficiency. The greater implementation of Building Twin development in the commercial, industrial, and residential markets also contributes to the goals of digital transformation.
For instance, at CES 2025, Siemens launched the Siemens Industrial Copilot, an AI-powered assistant that enhances real-time decision-making, boosts productivity, and reduces downtime for operators and maintenance teams in industrial environments.
The service segment is associated with the fastest growth of the building twin market, fueled by the rising demand for implementing, integrating, and consulting on building twin technologies. The growing importance of building twins results in additional challenges for organizations to effectively deploy and maintain such systems. In response, providers of building twin technologies incorporate individualized services into their proposals, including training, technical support, and updates of systems. The emphasis on cloud-based and AI-integrated solutions also increases the speed of ongoing service implementation.
By Application
The facility management segment dominated the building twin market and accounted for a significant revenue share in 2024 owing to its significant contribution in balancing operating costs and occupant comfort concerning local environmental solutions. High penetration of integrated solutions in the utilities segment for real-time monitoring, predictive maintenance, and cost reduction, owing to the need for energy-efficient solutions, sustainability goals have been driving this segment in turn.
The smart automation segment is expected to register the fastest CAGR during 2025-2032, driven by technology upgrades in AI, machine learning, and IoT. They allow automated management of building systems, such as HVAC, lighting, and security, achieving energy savings and lower operating costs. With an increasing demand for self-learning and automated systems in buildings become more intelligent.
By End-Use
The commercial segment dominated the building twin market and accounted for 45% of revenue share, driven by the adoption of smart technologies in office buildings, retail complexes, and commercial real estate. Companies are using digital twins to increase an asset's energy efficiency while lowering maintenance costs and increasing the occupant experience. This segment is projected to continue to hold a higher revenue share in the coming years on the back of increasing investments in smart buildings and sustainability initiatives. In addition, the regulatory mandates for green buildings, along with rising demand for predictive analytics in commercial facilities, are driving the adoption in the developed and emerging economies.
The industrial segment is expected to register the fastest CAGR during 2025-2032 due to the increasing usage of digital twins in factories, warehouses, and logistics centers. To minimize downtimes, optimize operations, and enhance asset lifecycle management, industries are integrating this building twin technology, enabling real-time monitoring and predictive maintenance solutions. Moreover, the shift to Industry 4.0, more extensive use of IoT-enabled sensors, and a high demand for operational transparency, are driving the industrial sector toward building twins.
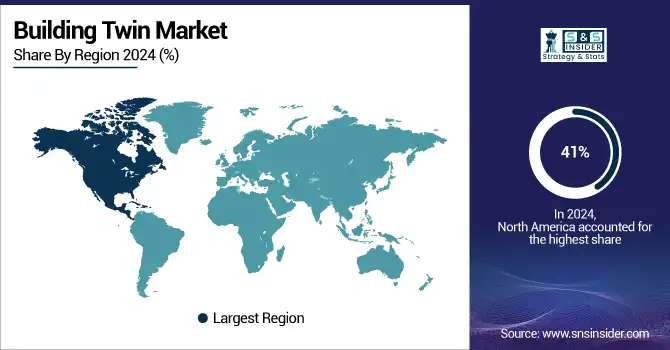
Building Twin Market Regional Outlook:
North America led the building twin market and accounted for 41% of revenue share as a result of the early adoption of smart building technology, with the strong digital infrastructure within a facility as a driver for their further implementation along with IoT and AI. The region is also aided by considerable spending on smart cities, green structures, and sustainability projects. Additionally, favorable government regulations regarding green infrastructure and the presence of key players in the market are also helping the growth in the commercial and industrial sectors.
The Asia Pacific region is expected to register the fastest CAGR during the forecast period due to the increasing urbanization, construction activities, and investments in smart city projects. This trend in adoption acceleration is bolstered by the digital transformation, energy efficiency, and automation objectives that this region is emphasizing. National sustainability regulations are being backed by many governments, especially in commercial infrastructure. The nexus of increased concerns regarding cost, energy, and operational efficiency globally, is driving the growth of digital twins, especially in the emerging economies.
In the Asia Pacific region, China dominated the building twin market due to its huge smart city programs, fast-growing infrastructure of digital technologies, and building policy. The large-scale implementation is also driven by strong government support and the investment made in the public and private sectors. Over the next several years, as various sectors within the country turn to digital twin technology for urban planning and complex industrial facilities management, this sector is likely to experience immense growth.
For instance, in November 2024, Suzhou launched China’s first public service platform powered by digital twin technology. Developed with the Suzhou Industrial Park Administrative Committee and CAICT, the platform provides nearly 150 professional services and features around 120 tech solutions, acting as a bridge between government, businesses, and the market.
The European building twin market continues to grow steadily due to high sustainability regulations and smart building technology, along with increasing digitalization across the construction and real estate industries. The EU Green Deal and energy performance directives are urging the integration of digital twin solutions for achieving the decarbonisation targets. In addition, the investments in smart infrastructure and retrofitting aging buildings are also driving demand.
Germany holds the largest share of the building twin market in Europe owing to its strong construction industry, well-developed manufacturing base, and government support for energy-efficient buildings. Driven by the country's efforts aligning with the "Digital Germany" strategy as outlined in the Industrial Strategy 2030, initiatives are accelerating alongside investment in Industry 4.0 technologies. Germany will continue to be the leader in this sector, with commercial and industrial property projected to see the most growth until 2032.
For instance, at the Festival of the Future 2024, the City of Munich unveiled its Digital Twin project to support climate neutrality goals. The initiative emphasizes precise urban modeling, proactive infrastructure management, and greater citizen engagement, making the digital twin a core enabler of sustainable urban development.
Get Customized Report as per Your Business Requirement - Enquiry Now
Key Players:
The major building twin companies are, Microsoft Corporation, Siemens AG, IBM Corporation, Oracle Corporation, Schneider Electric SE, Johnson Controls International plc, General Electric Company, PTC Inc., Trimble Inc., Dassault Systèmes SE, and others.
Recent Developments:
-
In November 2024, Microsoft collaborated with the Vatican to create an AI-generated digital twin of St. Peter's Basilica. Utilizing 400,000 high-resolution images and 22 terabytes of data, this digital replica enhances virtual exploration, manages visitor flow, and aids in conservation efforts by detecting structural issues invisible to the naked eye
-
In February 2025, Dassault Systèmes partnered with Apple to integrate its industrial 3D software into Apple's Vision Pro device. The collaboration aims to enhance digital twin technology, allowing real-time and remote collaboration on 3D models through the new "3DLive" app, facilitating early detection of manufacturing issues and improving design processes.
| Report Attributes | Details |
|---|---|
| Market Size in 2024 | US$ 2.1 Billion |
| Market Size by 2032 | US$ 24.0 Billion |
| CAGR | CAGR of 35.24 % From 2025 to 2032 |
| Base Year | 2024 |
| Forecast Period | 2025-2032 |
| Historical Data | 2021-2023 |
| Report Scope & Coverage | Market Size, Segments Analysis, Competitive Landscape, Regional Analysis, DROC & SWOT Analysis, Forecast Outlook |
| Key Segments | •By Component (Software, Service) •By Application (Security Management, Operations & Maintenance, Space Management, Facility Management, Smart Automation, Others) •By End-Use (Commercial, Industrial, Others) |
| Regional Analysis/Coverage | North America (US, Canada, Mexico), Europe (Germany, France, UK, Italy, Spain, Poland, Turkey, Rest of Europe), Asia Pacific (China, India, Japan, South Korea, Singapore, Australia, Rest of Asia Pacific), Middle East & Africa (UAE, Saudi Arabia, Qatar, South Africa, Rest of Middle East & Africa), Latin America (Brazil, Argentina, Rest of Latin America) |
| Company Profiles | Microsoft Corporation, Siemens AG, IBM Corporation, Oracle Corporation, Schneider Electric SE, Johnson Controls International plc, General Electric Company, PTC Inc., Trimble Inc., Dassault Systèmes SE and others in report |
Frequently Asked Questions
Ans- Challenges in the Building Twin Market is Data Privacy and Cybersecurity Concerns
Ans - one main growth factor for the Building Twin Market is Rising Adoption of Smart Building Technologies.
Ans- Asia-Pacific is expected to register the fastest CAGR during the forecast period.
Ans- The CAGR of the Building Twin Market during the forecast period is 35.24% from 2025-2032.
Ans - The Building Twin Market size was valued at USD 2.1 billion in 2024 and is expected to reach USD 24.0 billion by 2032.
Get in Touch
