AI Deception Tools Market Report Scope & Overview:
The AI Deception Tools Market was valued at USD 0.69 billion in 2025 and is expected to reach USD 8.57 billion by 2035, growing at a CAGR of 28.75% from 2026-2035.
AI Deception Tools Market growth is driven by the Increased complexity of cyberattacks and the need for proactive cybersecurity solutions across industries. These artificial intelligence-enabled technologies generate decoys, honeypots, and misdirection strategies to identify, analyse, and divert malicious activity as it happens. Companies are recognizing the benefits of using deception technology to protect critical infrastructure, intellectual property, and sensitive data, and they are steadily adopting deception-based security solutions.
AI Deception Tools Market Size and Forecast
-
Market Size in 2025: USD 0.69 Billion
-
Market Size by 2035: USD 8.57 Billion
-
CAGR: 28.75% from 2026 to 2035
-
Base Year: 2025
-
Forecast Period: 2026–2035
-
Historical Data: 2022–2024

To Get more information on AI Deception Tools Market - Request Free Sample Report
AI Deception Tools Market Trends
-
Rising need for advanced cybersecurity and threat simulation is driving the AI deception tools market.
-
Growing adoption across enterprises, financial services, and government agencies is boosting market growth.
-
Expansion of AI-powered honeypots, decoys, and trap systems is fueling deployment.
-
Increasing focus on detecting sophisticated cyberattacks, insider threats, and ransomware is shaping adoption trends.
-
Advancements in machine learning, behavioral analytics, and automated threat response are enhancing system effectiveness.
-
Rising investments in proactive cybersecurity strategies and IT risk management are supporting market expansion.
-
Collaborations between AI security solution providers, enterprises, and cybersecurity firms are accelerating innovation and global adoption.
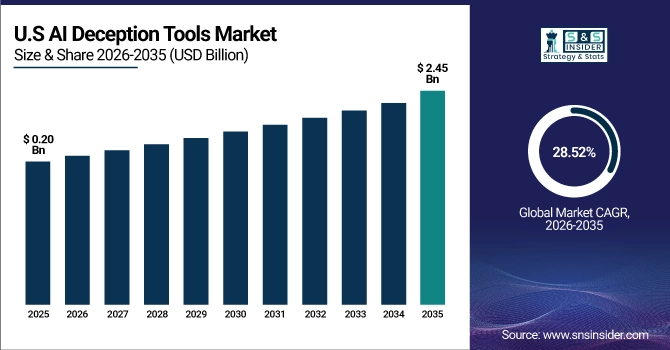
The U.S. AI Deception Tools Market was valued at USD 0.20 billion in 2025 and is expected to reach USD 2.45 billion by 2035, growing at a CAGR of 28.52% from 2026-2035. The U.S. AI Deception Tools Market is growing due to rising cybersecurity threats, increasing adoption of AI-driven defense solutions, demand for advanced threat detection, government initiatives, and the need to protect critical infrastructure and sensitive organizational data.
AI Deception Tools Market Growth Drivers:
-
The Growing Volume of Advanced Persistent Threats Is Compelling Organizations to Adopt AI-Driven Deception Tools for Proactive Threat Detection and Mitigation
Cyber threats, as major persistent threats (APTs), become more frequent and sophisticated, escalating the adoption of AI deception tools. While conventional security fails to identify and prevent stealthy intrusions, the AI-based deception technique proactively misleads attackers by deploying decoys, fake/dummy assets, and honeypots. They not only trap and slow down the intruder, but also collect information about how they behave, thus making future defenses stronger. The biggest adopters include industries with the most severe consequences in the event of data loss, including defense, finance, and healthcare.
25% of organizations experienced at least one APT in 2024 accounting for 43% of all high‑severity incidents a 74% increase over 2023 levels
AI Deception Tools Market Restraints:
-
The Difficulty of Integrating AI Deception Tools With Existing Legacy Systems Is Limiting Uptake, Particularly Among Resource-Constrained Small and Mid-Sized Enterprises
While they may be the golden ticket, the implementation and the use of those AI tools for deception-based solutions are challenging, and these have to be embedded into the current security architecture. Deceptive technologies do have their place, but too many organizations find themselves contorting the use of such tools to work alongside legacy systems, endpoint controls, and threat intelligence platforms. Exercising from within one's network boundaries with realistic decoys that accurately emulate operational systems without being intrusive requires experience and constant tuning.
According to Techaisle’s 2025 SMB security survey, 64% of small and mid‑sized businesses cited integration complexity—specifically connecting new AI tools to legacy systems and workflows—as a primary implementation challenge
AI Deception Tools Market Opportunities:
-
The Incorporation of Large Language Models and Generative AI Enables More Dynamic, Realistic Decoys, Expanding Capabilities and Market Reach
This might be the area where the use of deception technology converges with advanced AI techniques. LLMs and generative AI have huge potential for reinventing industries from a growth opportunity perspective. This allows hyper-realistic decoy targets, automation against an actual threat, and misdirection environments that adapt to enemy behavior. Generative AI can emulate human user behaviour, manufacture databases, or ship messages that entice and monitor attackers without endangering real-world assets. Generative AI has matured, and deception tools are getting smarter, more scalable, and cheaper to deploy, drawing investment across sectors.
AI Deception Tools Market Challenges:
-
Unclear Legal Frameworks and Ethical Concerns Surrounding AI-Driven Deception Are Causing Cautious Adoption Across Highly Regulated Industries
This presents ethical and legal challenges to the market growth of the AI deception tools. Just like for active defense, misdirecting attackers (for the sole purpose of defense!) obfuscates the line between misleading attackers and entering an entrapment scenario, and as tools will, in such a case, interact with human users or autonomous systems of other countries, the situation gets even more complex. Since regulators in many jurisdictions have not defined clear legal boundaries for deception-oriented cybersecurity (yet), this has led to ambiguity in enterprise buy-side adoption. In addition, there are problems with data privacy and consent surrounding synthetic data, simulated assets, and behavioral tracing through AI deception.
AI Deception Tools Market Segmentation Analysis:
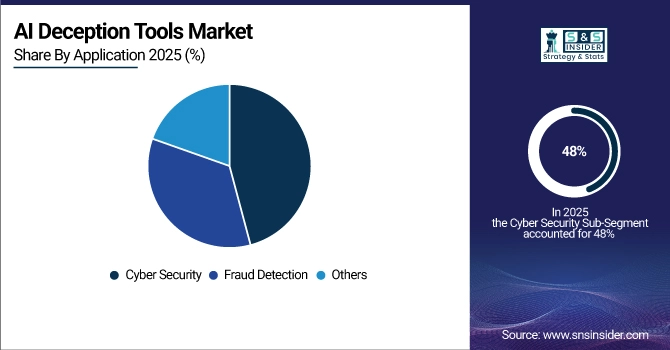
By Application:
In 2025, the cybersecurity segment dominated the market and accounted for a 48% of AI deception tools market share, due to the increase in the number of sophisticated cyberattacks put forth by cybercriminals such as zero-day exploits and APTs. Deception technologies driven by AI are increasingly being deployed by enterprise networks, government agencies, and critical infrastructure to detect threats faster and drive down dwell time while providing support for a zero-trust fabric.
The fraud detection segment is expected to register the fastest CAGR as financial institutions, e-commerce platforms, and even digital service providers are increasingly confronted with the double-edged sword of synthetic identity fraud, deepfakes, and transaction spoofing. These tools prevent fraud more effectively by simulating environments forged by fraud, analyzing attacker behavior, and enabling real-time fraud response, making them an integral part of integrated enterprise fraud management corrections in the detection phase and eliminating any financial and reputational risks.
By Technology:
In 2025, the machine learning segment dominated the AI deception tools market and accounted for a significant revenue share due to the feature of anomaly detection of anomalies, adaptation to emerging threats, and the automating abilities of deception strategies. Its scalability and efficiency in recognizing patterns allow rapid threat modeling, making it the backbone of modern deception-based cybersecurity frameworks across enterprises.
The generative AI segment is expected to register the fastest CAGR due to its ability to generate realistic utility using adaptive decoys along with real-time interactions to engage the attacker. The integration creates greater deception-led threat detection accuracy, lower false positives, and autonomous incident response enabling faster adoption of Illicit-Cloak across the finance and defense sectors as well as cloud-native organizations.
By End Use:
In 2025, the BFSI segment dominated the AI deception tools market and accounted for a significant revenue share owing to increased susceptibility to identity theft, fraud, and targeted cyberthreats. Financial organizations have already begun utilizing these AI deception tools for defending against critical data, creating simulated flows of fraudulent activity, and identifying real-time visibility of these threats to comply with soon-to-be more stringent cybersecurity regulations while also improving customer trust.
The government segment is expected to register the fastest CAGR. Due to the increasing geopolitical threat, expanding cyber warfare, and attacking public infrastructure. AI deception tools help identify state-sponsored intrusions, protect national security assets, and mislead human and non-human adversaries through decoys and digital twins, enabling national cyber defense strategies and significant investments in an AI-based safehouse
AI Deception Tools Market Regional Outlook:
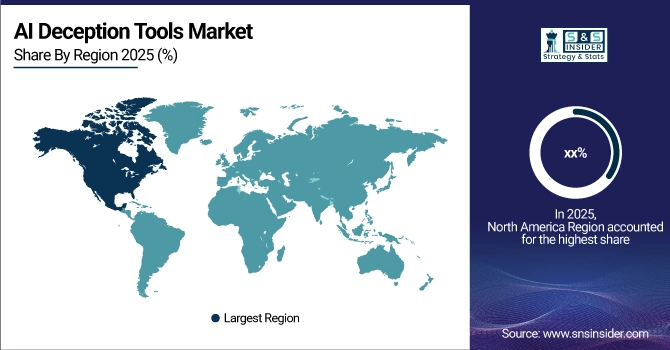
North America AI Deception Tools Market Insights
In 2025, the North America region dominated the AI deception tools market and accounted for a significant revenue share due to early technology adoption, high population of cybersecurity vendors, as well as increased government investment for AI-powered threat detection. The proliferation across financial, defense, and health sectors is being propelled by increasing APTs, fast expansion of digital infrastructure, and stringent compliance standards.
Get Customized Report as per Your Business Requirement - Enquiry Now
Asia Pacific AI Deception Tools Market Insights
According to the AI deception tools market analysis, the Asia Pacific region is expected to register the fastest CAGR due to an increase in digitization, customer data, and cyber threats, and an increase in identifiable processes and sector understanding of deception (IDeption). The cybersecurity solutions market in Asia Pacific is likely to grow significantly, with countries such as China, India, and South Korea spending heavily on cybersecurity modernization backed by national Artificial Intelligence (AI) policies and enterprise cloud adoption, along with increased demand for sophisticated protection, particularly in BFSI, telecom, and government sectors.
Europe AI Deception Tools Market Insights
The European AI Deception Tools Market is witnessing steady growth driven by the constant evolution of data protection regulations, such as GDPR, along with an increasing number of cybersecurity breaches, and the trend towards enterprise cloud adoption are driving the steady growth of the European AI Deception Tools Market. Rising investments in AI-based defense mechanisms across BFSI, telecom, and public sectors will further accelerate the growth of the market
Germany dominated the European AI Deception Tools Market owing to its robust industrial base, high cybersecurity expenditure, and government-supported initiatives, particularly those related to the development of a digital infrastructure.
Middle East & Africa and Latin America AI Deception Tools Market Insights
The Middle East & Africa and Latin America AI Deception Tools Market is expanding as organizations adopt advanced cybersecurity measures to counter sophisticated cyberattacks. Growing digital transformation, increasing cloud adoption, and rising awareness of AI-driven threat detection are driving demand. Government initiatives, investments in critical infrastructure protection, and the need for proactive security solutions further fuel market growth across these regions.
AI Deception Tools Market Competitive Landscape:
Microsoft Corporation
Microsoft Corporation is a global technology leader providing software, cloud computing, AI, and cybersecurity solutions. Its security portfolio integrates AI and machine learning to detect, prevent, and mitigate cyber threats across enterprise and consumer platforms. Microsoft focuses on proactive threat intelligence, automated defenses, and secure cloud services, helping organizations safeguard data and operations. Its AI-driven security initiatives address emerging risks like social engineering, identity-based attacks, and AI-powered deception, strengthening enterprise resilience and compliance worldwide.
-
2024: Palantir partnered with Microsoft to deploy its AIP platform on Azure Government Cloud, enabling advanced AI-powered security and deception capabilities for U.S. defense and intelligence agencies.
CrowdStrike Holdings, Inc.
CrowdStrike is a cybersecurity company specializing in cloud-native endpoint protection, threat intelligence, and AI-powered security solutions. Its Falcon platform leverages machine learning to detect malware, ransomware, and sophisticated attacks in real-time, offering threat hunting, incident response, and managed security services. CrowdStrike emphasizes AI and automation to anticipate evolving cyber threats, including AI-generated social engineering and identity attacks, providing organizations with advanced deception, decoy deployment, and analytics capabilities to improve resilience against adversaries in enterprise, cloud, and critical infrastructure environments.
-
2025: CrowdStrike launched new CrowdStrike Store apps, including Acalvio’s autonomous deception solutions, engaging adversaries with decoys to enhance threat hunting across Falcon deployments.
Darktrace
Darktrace is a cybersecurity AI company delivering autonomous threat detection, response, and simulation solutions across cloud, network, endpoint, and operational technology environments. Its ActiveAI Security Platform integrates AI-powered deception, threat simulation, and autonomous mitigation to protect against sophisticated cyberattacks. Darktrace combines real-time analytics with self-learning models, helping organizations respond dynamically to evolving risks. The platform emphasizes proactive defenses and simulation of attack scenarios to strengthen enterprise resilience against AI-driven threats and deception-based security challenges.
-
2024: Darktrace launched the ActiveAI Security Platform, integrating AI-powered deception, threat simulation, and autonomous response across cloud, endpoint, and OT environments.
Key Players
Some of the AI Deception Tools Market Companies
-
Darktrace
-
Palantir Technologies
-
IBM
-
Microsoft
-
Google DeepMind
-
Shield AI
-
Sensity AI
-
HiddenLayer
-
Vectra AI
-
ZeroFox
-
Fortinet
-
CrowdStrike
-
SentinelOne
-
Cybereason
-
ReSecurity
-
Claroty
-
Deceptive Bytes
-
Smokescreen Technologies
-
Illusive Networks
-
Acalvio Technologies
|
Report Attributes |
Details |
|---|---|
|
Market Size in 2025 |
US$ 0.69 Billion |
|
Market Size by 2035 |
US$ 8.57 Billion |
|
CAGR |
CAGR of 28.75 % From 2026 to 2035 |
|
Base Year |
2025 |
|
Forecast Period |
2026-2035 |
|
Historical Data |
2022-2024 |
|
Report Scope & Coverage |
Market Size, Segments Analysis, Competitive Landscape, Regional Analysis, DROC & SWOT Analysis, Forecast Outlook |
|
Key Segments |
• By Deployment Mode (Cloud-Based, On-Premise) |
|
Regional Analysis/Coverage |
North America (US, Canada), Europe (Germany, France, UK, Italy, Spain, Poland, Rest of Europe), Asia Pacific (China, India, Japan, South Korea, ASEAN Countries, Australia, Rest of Asia Pacific), Middle East & Africa (UAE, Saudi Arabia, Qatar,Egypt, South Africa, Rest of Middle East & Africa), Latin America (Brazil, Argentina, Mexico, Colombia, Rest of Latin America) |
|
Company Profiles |
Darktrace, Palantir Technologies, IBM, Microsoft, Google DeepMind, Shield AI, Sensity AI, HiddenLayer, Vectra AI, ZeroFox, Fortinet, CrowdStrike, SentinelOne, Cybereason, ReSecurity, Claroty, Deceptive Bytes, Smokescreen Technologies, Illusive Networks, Acalvio Technologies and others in the report |
Frequently Asked Questions
The North America region dominated the AI Deception Tools Market with 36% of revenue share in 2025.
In 2025, the machine learning segment dominated the AI deception tools market and accounted for a significant revenue share
The Growing Volume of Advanced Persistent Threats Is Compelling Organizations to Adopt AI-Driven Deception Tools for Proactive Threat Detection and Mitigation
The AI Deception Tools Market was valued at USD 0.69 billion in 2025 and is expected to reach USD 8.57 billion by 2035.
The expected CAGR of the AI Deception Tools Market over 2026-2035 is 28.75%.
Get in Touch
