Business Spend Management Software Market Report Scope & Overview:
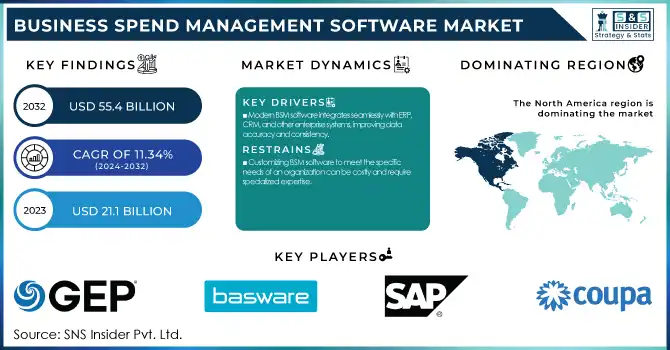
The Business Spend Management Software Market was valued at USD 21.1 Billion in 2023 and is expected to reach USD 55.4 Billion by 2032, growing at a CAGR of 11.34% from 2024-2032.
To get more information on Business Spend Management Software Market - Request Free Sample Report
Growing demand for operational efficiency, implementation of cost optimization strategies, and the need for better control over organizational financial operations are some driving factors boosting the growth of the Business Spend Management Software market. Business Spend Management software delivers a broader experience with integrated solutions for procurement, expenses, invoicing, and supplier relationship management helping the company automate finance workflows and gain better visibility into spending. The rising need to automate manual processes and eliminate financial management inefficiencies amongst organizations that prioritize digital transformation has led to the outsized demand for BSM software.
The growing cost optimization pressure for businesses is a key factor driving the Business Spend Management Software market growth. Organizations are looking to get their contracts signed for the best price and improve overall spending improvement in a highly competitive atmosphere. BSM software helps businesses examine overspending, take corrective actions to save costs and achieve a return on investment. In addition, increasing global complexity in regulations and compliance is driving the need for companies to implement solutions that will support compliance with financial and procurement policies. By defining the corporate policy, BSM helps maintain compliance and get spending in line with corporate policies.
Increasing adoption of cloud-based solutions is another key factor triggering market growth. By removing the need for large on-premise infrastructure, BSM software in the cloud is more accessible, scalable, and cost-effective. In addition to improving data accuracy and consistency, the integration capabilities of modern BSM software enable seamless connectivity with other enterprise systems, such as enterprise resource planning and customer relationship management platforms. Soaring utilization of artificial intelligence and machine learning in business service management solutions also fuels the growth of the market. These technologies include predictive analytics that can help businesses anticipate spending patterns and make wiser choices.
Market Dynamis
Drivers
-
Modern BSM software integrates seamlessly with ERP, CRM, and other enterprise systems, improving data accuracy and consistency.
Modern BSM solutions are designed to be highly integrative with other enterprise systems such as ERP and CRM systems for enhanced data accuracy and consistency. Organizations can integrate BSM software with ERP systems to ensure monetary, procurement, and vendor management data is connected and updated constantly between departments. For companies with high transaction volumes, this integration helps eliminate manual entry, thus minimizing the risk of errors and inconsistencies.
Also, it helps in maintaining better supplier relationships and optimization of procurement strategies through integration with CRM systems. Real-time access to customer and supplier data enables organizations to take advantage of efficiencies through informed pricing decisions, contract terms, and payment conditions so they can take greater control of spending and improve supplier management.
The ease of connecting BSM software with departmental enterprise systems speeds up collaboration among teams. Here is the answer to that question: Finance, procurement, and operations teams can work from a single view of spending data to find inefficiencies and potential areas to cut costs. The integration of financial and procurement data provides consistency across reports and forecasts. As a result, companies are empowered to make better decisions, meet compliance needs and drive operational effectiveness, with improved control of their budget.
-
Cloud-based BSM software offers scalability, cost-effectiveness, and easier access, reducing the need for on-premises infrastructure.
-
Demand for mobile solutions enables employees to manage expenses and approvals on the go, boosting productivity and engagement.
Restraints
-
Customizing BSM software to meet the specific needs of an organization can be costly and require specialized expertise.
Tailoring BSM software to capture the diverse data specific to an organization is often an expensive and complicated process, needing a special set of skills. Although packaged BSM solutions create a broad set of functionalities, they often fall short for organizations with highly customized procurement processes integrated with complicated financial workflows and compliance requirements. Such personalization can include changing the user interface of the software, customizing it to the current systems, and adding features that are not a part of the original software. This leads to expensive trainers and third-party consultants needing to implement it. The need for specialized expertise further complicates the situation, increasing costs for organizations. They may need to hire professionals familiar with the specific BSM software or rely on vendors with extensive knowledge of the platform. Additionally, the customization process can be time-consuming, often disrupting business operations.
Additionally, companies should also consider the long-term expenses involved in maintaining and upgrading the tailored solution. Ongoing costs may also be generated because, as the software changes, updates or added features may need to be accommodated in the customized solution. Such continuous investment can prove to be a considerable roadblock for small businesses with little budget, constraining them to best leverage the BSM software without parting a fortune. Thus, the unique cost & complexity of customization become the principal BSM software adoption obstacle for any organization with limited resources.
-
The initial investment and ongoing maintenance costs of BSM software can be prohibitive, especially for small and medium-sized businesses.
-
Some BSM software solutions may not scale effectively as organizations grow, leading to potential limitations in managing increased transaction volumes.
Segment Analysis
By Deployment
The cloud segment dominated the Business Spend Management software market and represented a revenue share of more than 68% in 2023, on account of the scalability, affordability, and convenience of the software. With cloud solutions, businesses do not have to spend heavily to gain the infrastructure, they can simply grow with their needs. Remote, device-agnostic BSM software access has been a critical benefit amid growing remote and mobile business trends. In addition, BSM solutions provided via the cloud might come with automatic updates so that businesses will have access to the latest features and security patches. Given the increasing focus of organizations on digital transformation, the need for cloud solutions will go further.
The on-premise segment is expected to register the fastest CAGR during the forecast period, as organizations opt for more control over their data and infrastructure. On-premise provides a higher degree of flexibility and security, which is especially suitable for organizations that need to meet strict compliance or handle sensitive information. Some of the larger enterprises, on the other hand, are leaning towards on-premise solutions so that they can be better integrated with their existing IT systems. The on-premise segment is expected to witness moderate growth in the coming years, especially among large enterprises and industries with high data security requirements including financial and healthcare sectors.
By Enterprise Size
The large enterprise segment dominated the market and accounted for a revenue share of more than 64% in 2023, due to their more complex procurement needs, broader business operations, and greater financial resources. These organizations require scalable, customizable solutions to support high transaction volumes and easy connectivity with existing enterprise systems. Business Spend Management software helps enterprises large and small maximize spending, remain compliant, and automate procurement processes. With ongoing digital transformation and increasing operational efficiency, BSM software in this segment is anticipated to be in high demand through the forecast period. As time goes on, large enterprises will start utilizing advanced features, like AI-driven analytics and predictive capabilities, stimulating the sending up of the archway.
The small and medium enterprises segment is expected to register the fastest compound annual growth rate in the BSM software market due to the increasing demand for cost management and financial optimization from these enterprises. Under rising pressure to cut operational expenses and enhance procurement efficiency, SMEs are switching to economically attractive, scalable BSM solutions. However, the advent of cloud-based BSM software has made these solutions far more accessible because it has removed the costly on-premise infrastructure. SMEs, while in digital transformation, are using tools to automate manual processes and visibility over spend. That said, it's a bright future for the SME segment with a lot of growth expected as relatively cheap and easy-to-implement BSM solutions become more available.
Regional Analysis
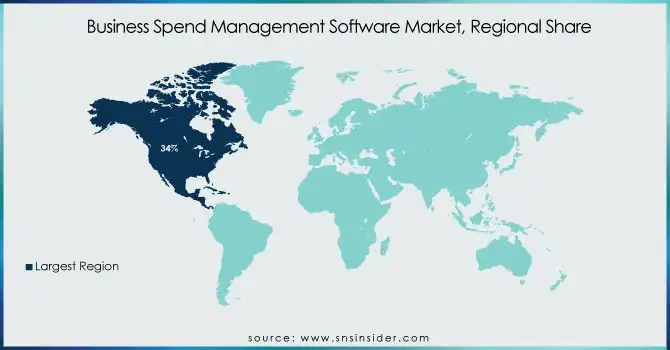
North America dominated the market and represented a revenue share of more than 34%, owing to the presence of a large number of big enterprises, well-developed technology infrastructure, and significant digitization trends. Established financial and regulatory frameworks in the region encourage the use of BSM software. The increasing need for businesses across North America to optimize operational capabilities, cost, and regulatory adherence is driving the market for BSM solutions. In addition, the rising utilization of AI, machine learning, and automation over BSM software is also anticipated to contribute to market growth. North America is expected to register the highest market revenue during the forecast period, owing to the high rate of innovation and growing adoption of advanced BSM technologies.
Asia-Pacific is expected to register the fastest compound annual growth rate, mainly due to the rapid economic development, digital transformation, and increasing numbers of SMEs. The growing need for optimization of costs, procurement efficiency, and financial control by businesses in APAC is driving the demand for BSM software at an unprecedented pace. Moreover, the rise of cloud-based BSM solutions has made BSM tools more accessible to organizations of all sizes. The emphasis on enhanced supply chain management and procurement processes in the region is further driving the demand for BSM software.
Get Customized Report as per Your Business Requirement - Enquiry Now
Key Players:
The major players in the market are GEP, Basware, SAP, Oracle, Coupa, Zycus, Ivalua, Jaggaer, Tradeshift, SynerTrade, Proactis, SciQuest, Ariba Network and others in the final report.
Recent Development:
-
January 2024: Coupa Software announced the integration of advanced artificial intelligence (AI) capabilities into its spend management platform, aiming to enhance predictive analytics and automate procurement processes.
-
March 2024: SAP SE unveiled a new version of SAP Ariba, featuring enhanced user interfaces and improved supplier collaboration tools to streamline procurement workflows.
-
May 2024: Oracle Corporation introduced Oracle Procurement Cloud 2.0, offering advanced analytics and machine learning features to optimize spend management and supplier performance.
|
Report Attributes |
Details |
|
Market Size in 2023 |
USD 21.1 Bn |
|
Market Size by 2031 |
USD 55.4 Bn |
|
CAGR |
CAGR of 11.34% From 2024 to 2032 |
|
Base Year |
2023 |
|
Forecast Period |
2024-2032 |
|
Historical Data |
2020-2022 |
|
Report Scope & Coverage |
Market Size, Segments Analysis, Competitive Landscape, Regional Analysis, DROC & SWOT Analysis, Forecast Outlook |
|
Key Segments |
• By Solution (Procure-to-Pay Solutions, Supplier & Risk Management, Travel & Expense Management, Contract & e-Tender Management, Spend Management/Spend Analytics,Others) |
|
Regional Analysis/Coverage |
North America (US, Canada, Mexico), Europe (Eastern Europe [Poland, Romania, Hungary, Turkey, Rest of Eastern Europe] Western Europe] Germany, France, UK, Italy, Spain, Netherlands, Switzerland, Austria, Rest of Western Europe]), Asia Pacific (China, India, Japan, South Korea, Vietnam, Singapore, Australia, Rest of Asia Pacific), Middle East & Africa (Middle East [UAE, Egypt, Saudi Arabia, Qatar, Rest of Middle East], Africa [Nigeria, South Africa, Rest of Africa], Latin America (Brazil, Argentina, Colombia, Rest of Latin America) |
|
Company Profiles |
SAP, Oracle, Coupa, Zycus, Ivalua, Jaggaer, GEP, Basware, Tradeshift, SynerTrade, Proactis, SciQuest, Ariba Network |
|
Key Drivers |
• Cloud-based BSM software offers scalability, cost-effectiveness, and easier access, reducing the need for on-premises infrastructure. |
|
Restraints |
• The initial investment and ongoing maintenance costs of BSM software can be prohibitive, especially for small and medium-sized businesses. |
Frequently Asked Questions
Ans: The Business Spend Management Software Market was valued at USD 21.1 Billion in 2023 and is expected to reach USD 55.4 Billion by 2032, growing at a CAGR of 11.34% from 2024-2032.
Ans: The CAGR of the Business Spend Management Software Market during the forecast period is 11.34% from 2024-2032.
Ans: Asia-Pacific is expected to register the fastest CAGR during the forecast period.
Ans: Cloud-based BSM software offers scalability, cost-effectiveness, and easier access, reducing the need for on-premises infrastructure.
Ans: The initial investment and ongoing maintenance costs of BSM software can be prohibitive, especially for small and medium-sized businesses.
Get in Touch
