image

Butyric Acid Market Report Scope & Overview:

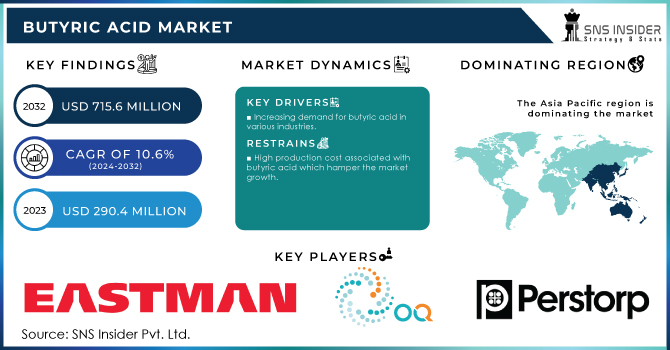
The Butyric Acid Market size was valued at USD 321 million in 2022. It is estimated to hit USD 644.32 million by 2030 and grow at a CAGR of 9.1% over the forecast period of 2023-2030.

The butyric acid market is experiencing significant growth due to its wide range of applications across various industries. Butyric acid, also known as butanoic acid, is a carboxylic acid with a foul odor. It is commonly found in dairy products, such as butter, and is also produced by bacteria during the fermentation process. Despite its unpleasant smell, butyric acid has gained popularity in several industries due to its versatile properties. The global butyric acid market is witnessing substantial growth, primarily driven by its increasing demand in the food and beverage industry. It is widely used as a flavoring agent, preservative, and feed additive.

Butyric Acid Market Revenue Analysis

Get E-PDF Sample Report on Butyric Acid Market - Request Sample Report

The synthetic type segment dominated the butyric acid market with a revenue share of about 61.3% in 2022. Synthetic production methods allow for greater control over the purity and consistency of the acid, ensuring a higher quality product. This reliability has made synthetic butyric acid a preferred choice for various industries, including food and beverage, pharmaceuticals, and animal feed.

Furthermore, the pharmaceutical industry has also recognized the potential of butyric acid in the development of drugs and treatments. Furthermore, the market is expanding due to the rising adoption of butyric acid in animal feed. It has proven to be an effective growth promoter and aids in improving gut health in livestock. This has led to increased demand from the agriculture sector.

Market Dynamics

Drivers

  • Increasing demand for butyric acid in various industries

  • Versatile nature of butyric acid

  • Rising awareness regarding the health benefits associated with butyric acid consumption

Butyric acid, also known as butanoic acid, is a short-chain fatty acid that occurs naturally in various foods and is produced by certain bacteria in the gut. It plays a crucial role in maintaining gut health and has been associated with numerous health benefits. One of the key advantages of butyric acid consumption is its positive impact on the digestive system. It helps in maintaining a healthy gut by promoting the growth of beneficial bacteria and inhibiting the growth of harmful bacteria. Furthermore, butyric acid has been found to possess anti-inflammatory properties, which can be beneficial for individuals suffering from inflammatory bowel diseases such as Crohn's disease and ulcerative colitis. In addition to its effects on gut health, butyric acid has also shown potential in supporting weight management. Studies have indicated that it may help in reducing appetite and promoting feelings of fullness, which can aid in weight loss efforts. Moreover, butyric acid has been linked to improved insulin sensitivity and blood sugar control.

Restrain

  • High production cost associated with butyric acid

Opportunities

  • Expanding applications of butyric acid in the pharmaceutical industry

Butyric acid, a versatile compound, is finding increasing utilization within the pharmaceutical sector. One notable application of butyric acid lies in its ability to enhance the bioavailability of certain drugs. By incorporating butyric acid into pharmaceutical formulations, the absorption and effectiveness of these drugs can be significantly improved. Furthermore, butyric acid has shown potential in the treatment of various medical conditions. Its anti-inflammatory and antimicrobial properties make it a valuable component in the development of drugs targeting specific diseases. The pharmaceutical industry is actively exploring the potential of butyric acid in the treatment of conditions such as cancer, inflammatory bowel disease, and metabolic disorders.

Challenges

  • Stringent regulations and standards associated with the use of butyric acid

Impact of Russia-Ukraine War:

Rising energy costs have become a major concern for all key players, as the prices of most commodities continue to increase due to an unprecedented surge in raw material and natural gas prices. This surge has had a negative impact on the market outlook for Butyric Acid in Europe, as reduced consumer spending habits and sluggish demand from the downstream solvent sector, despite sufficient inventories, have hampered growth. During the month ending in March 2022, the CFR Antwerp negotiations for Belgian Butyric Acid Industrial grade remained stagnant at around USD 1650/MT. Geopolitical tensions between Russia and Ukraine played a significant role in the steep rise in feedstock Butyraldehyde prices in the US market. The prices of WTI and Brent crude oil, along with natural gas, experienced a drastic increase during this quarter, further driving up costs.

According to assessments, the price of Butyric Acid hovered around USD 1480/MT in the quarter ending March 2022. Due to tight supply and strong demand from end-users, OQ chemicals have raised the price of Butyric Acid throughout the entire European region. The disruptions in supply, coupled with high crude oil prices, have further contributed to the increased cost of Butyric Acid. European countries' limited imports of oil and gas from Russia have resulted in high production costs, which have had a direct impact on the price of Butyric Acid in the regional market. Additionally, the pharmaceutical and animal feed industries have experienced increased demand for Butyric Acid, further driving up prices.

Impact of Recession:

The recession has had a significant impact on the demand for butyric acid. In the second quarter of 2023, the price of butyric acid experienced a sharp decline in the US market. Despite this, the demand for the product did not increase as there was already enough supply to meet the needs of the downstream pharma, food processing, and chemical industries. Manufacturers faced a decrease in new orders, and companies struggled to attract new business as consumers continued to use up their existing inventories with little confidence in the economy. During the first 2 months of the second quarter of 2023, there was a slight increase in the price of butyric acid due to a rise in inquiries from downstream industries in the Asian market. However, in June, the Asian market experienced a sudden decline in the demand for butyric acid, leading to a halt in new work orders for businesses, that were forced to rely on their existing stocks. Additionally, the low-cost pressure from feedstock propylene played a role in stabilizing the price of the product. In June, both the pharma and food processing industries remained stagnant due to low trading activities. This indicates that the demand for butyric acid decreased as there was already enough supply available in the market. Unfortunately, the market has not seen any improvement in the demand for butyric acid over the second quarter of 2023, largely due to the economic uncertainty in France.

Market segmentation

By Type

  • Synthetic

  • Renewable

By Derivatives

  • Sodium Butyrate

  • Calcium Butyrate

  • Others

By End-use

  • Pharmaceuticals

  • Chemical Intermediates

  • Biofuels

  • Human Dietary Supplements

  • Food Additives & Flavoring

  • Cosmetic

  • Animal Feed

  • Leather Tanning

  • Plasticizer

  • Others

Butyric Acid Market Segmentation Analysis

Get Customized Report as Per Your Business Requirement - Request For Customized Report

Regional Analysis

Asia Pacific region is expected to be the dominant player in the Butyric Acid market and is predicted to grow with a CAGR of about 9.4% during the forecast period of 2023-2030. The Asia Pacific region boasts a robust industrial landscape, with various industries such as food and beverages, pharmaceuticals, and animal feed, among others, heavily relying on Butyric Acid. This reliance is primarily due to the versatile nature of Butyric Acid, which finds applications in flavoring agents, pharmaceutical intermediates, and animal feed additives, among others. Furthermore, the Asia Pacific region is witnessing significant economic growth, leading to an increase in disposable income and subsequently driving the demand for various consumer goods. This surge in demand further fuels the need for Butyric Acid, as it is a vital component in the production of perfumes, textiles, and plastics, among other consumer products. The demographic advantage, coupled with the region's increasing urbanization and changing lifestyles, contributes to the escalating demand for Butyric Acid.

REGIONAL COVERAGE:

North America

  • US

  • Canada

  • Mexico

Europe

  • Eastern Europe

    • Poland

    • Romania

    • Hungary

    • Turkey

    • Rest of Eastern Europe

  • Western Europe

    • Germany

    • France

    • UK

    • Italy

    • Spain

    • Netherlands

    • Switzerland

    • Austria

    • Rest of Western Europe

Asia Pacific

  • China

  • India

  • Japan

  • South Korea

  • Vietnam

  • Singapore

  • Australia

  • Rest of Asia Pacific

Middle East & Africa

  • Middle East

    • UAE

    • Egypt

    • Saudi Arabia

    • Qatar

    • Rest of Middle East

  • Africa

    • Nigeria

    • South Africa

    • Rest of Africa

Latin America

  • Brazil

  • Argentina

  • Colombia

  • Rest of Latin America

Key Players

The major key players are Eastman Chemical Company, OQ Chemicals GmbH, Perstorp Holding AB, Blue Marble Biomaterials, Tokyo Chemical Industry Co. Ltd, Alfa Aesar, OXEA GmbH, Beijing Huamaoyuan Fragrance Flavor Co. Ltd, Snowco industrial Co. Ltd, Palital Feed Additives B.V., and other key players mentioned in the final report.

Eastman Chemical Company-Company Financial Analysis

Recent Development:

  • In April 2022, OQ Chemicals announced a price increase for n-butyric acid, which has taken effect from May 1, 2022, due to supply and demand factors.

  • In March 2022, Perstorp introduced Gastrivix™ Avi, a solution for gut health that combines the advantages of valeric and butyric acid. This innovative addition to Perstorp's range of broiler feed solutions follows the successful launch of Gastrivix™ Avi.

Butyric Acid Market Report Scope
Report Attributes Details
Market Size in 2022  US$ 321 Mn
Market Size by 2030  US$ 644.32 Mn
CAGR   CAGR of 9.1%  From 2023 to 2030
Base Year 2022
Forecast Period 2023-2030
Historical Data 2019-2021
Report Scope & Coverage Market Size, Segments Analysis, Competitive  Landscape, Regional Analysis, DROC & SWOT Analysis, Forecast Outlook
Key Segments • By Type (Synthetic and Renewable)
• By Derivatives (Sodium Butyrate, Calcium Butyrate, and Others)
• By End-use (Pharmaceuticals, Chemical Intermediates, Biofuels, Human Dietary Supplements, Food Additive & Flavoring, Cosmetic, Animal Feed, Leather Tanning, Plasticizer, and Others)
Regional Analysis/Coverage 
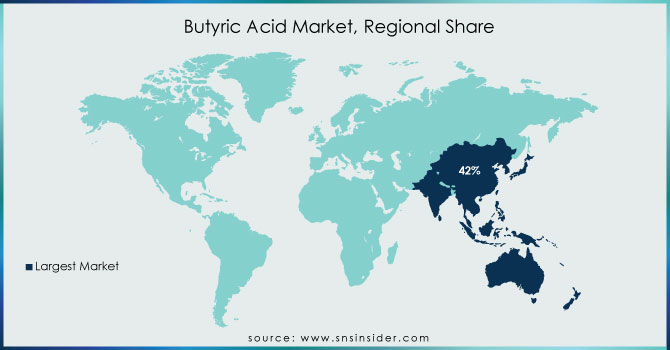
North America (US, Canada, Mexico), Europe (Eastern Europe [Poland, Romania, Hungary, Turkey, Rest of Eastern Europe] Western Europe] Germany, France, UK, Italy, Spain, Netherlands, Switzerland, Austria, Rest of Western Europe]), Asia Pacific (China, India, Japan, South Korea, Vietnam, Singapore, Australia, Rest of Asia Pacific), Middle East & Africa (Middle East [UAE, Egypt, Saudi Arabia, Qatar, Rest of Middle East], Africa [Nigeria, South Africa, Rest of Africa], Latin America (Brazil, Argentina, Colombia Rest of Latin America)
Company Profiles Eastman Chemical Company, OQ Chemicals GmbH, Perstorp Holding AB, Blue Marble Biomaterials, Tokyo Chemical Industry Co. Ltd, Alfa Aesar, OXEA GmbH, Beijing Huamaoyuan Fragrance Flavor Co. Ltd, Snowco industrial Co. Ltd, Palital Feed Additives B.V.
Key Drivers • Increasing demand for butyric acid in various industries
• Versatile nature of butyric acid
• Rising awareness regarding the health benefits associated with butyric acid consumption
Market Restraints • High production cost associated with butyric acid


Frequently Asked Questions

Ans: The Butyric Acid Market was valued at USD 321 million in 2022.

Ans: The expected CAGR of the global Butyric Acid Market during the forecast period is 9.1%.

Ans: The compound's potential to improve gut health, enhance digestion, and boost immunity has attracted consumers, thereby driving market growth.

Ans: The complex manufacturing process and the need for specialized equipment and raw materials contribute to the elevated production expenses, limiting market expansion.

Ans: Yes, you can ask for the customization as pas per your business requirement.

Table of Contents


1. Introduction
1.1 Market Definition
1.2 Scope
1.3 Research Assumptions


2. Research Methodology


3. Market Dynamics
3.1 Drivers
3.2 Restraints
3.3 Opportunities
3.4 Challenges


4. Impact Analysis
4.1 Impact of the Ukraine- Russia War
4.2 Impact of Ongoing Recession
4.2.1 Introduction
4.2.2 Impact on major economies
4.2.2.1 US
4.2.2.2 Canada
4.2.2.3 Germany
4.2.2.4 France
4.2.2.5 United Kingdom
4.2.2.6 China
4.2.2.7 Japan
4.2.2.8 South Korea
4.2.2.9 Rest of the World


5. Value Chain Analysis


6. Porter’s 5 forces model


7. PEST Analysis


8. Butyric Acid Market Segmentation, By Type
8.1 Synthetic
8.2 Renewable


9. Butyric Acid Market Segmentation, By Derivatives
9.1 Sodium Butyrate
9.2 Calcium Butyrate
9.3 Others


10. Butyric Acid Market Segmentation, By End-use
10.1 Pharmaceuticals
10.2 Chemical Intermediates
10.3 Biofuels
10.4 Human Dietary Supplements
10.5 Food Additives & Flavoring
10.6 Cosmetic
10.7 Animal Feed
10.8 Leather Tanning
10.9 Plasticizer
10.10 Others


11. Regional Analysis
11.1 Introduction
11.2 North America
11.2.1 North America Butyric Acid Market by Country
11.2.2North America Butyric Acid Market by Type
11.2.3 North America Butyric Acid Market by Derivatives
11.2.4 North America Butyric Acid Market by End-use
11.2.5 USA
11.2.5.1 USA Butyric Acid Market by Type
11.2.5.2 USA Butyric Acid Market by Derivatives
11.2.5.3 USA Butyric Acid Market by End-use
11.2.6 Canada
11.2.6.1 Canada Butyric Acid Market by Type
11.2.6.2 Canada Butyric Acid Market by Derivatives
11.2.6.3 Canada Butyric Acid Market by End-use
11.2.7 Mexico
11.2.7.1 Mexico Butyric Acid Market by Type
11.2.7.2 Mexico Butyric Acid Market by Derivatives
11.2.7.3 Mexico Butyric Acid Market by End-use
11.3 Europe
11.3.1 Eastern Europe
11.3.1.1 Eastern Europe Butyric Acid Market by Country
11.3.1.2 Eastern Europe Butyric Acid Market by Type
11.3.1.3 Eastern Europe Butyric Acid Market by Derivatives
11.3.1.4 Eastern Europe Butyric Acid Market by End-use
11.3.1.5 Poland
11.3.1.5.1 Poland Butyric Acid Market by Type
11.3.1.5.2 Poland Butyric Acid Market by Derivatives
11.3.1.5.3 Poland Butyric Acid Market by End-use
11.3.1.6 Romania
11.3.1.6.1 Romania Butyric Acid Market by Type
11.3.1.6.2 Romania Butyric Acid Market by Derivatives
11.3.1.6.4 Romania Butyric Acid Market by End-use
11.3.1.7 Turkey
11.3.1.7.1 Turkey Butyric Acid Market by Type
11.3.1.7.2 Turkey Butyric Acid Market by Derivatives
11.3.1.7.3 Turkey Butyric Acid Market by End-use
11.3.1.8 Rest of Eastern Europe
11.3.1.8.1 Rest of Eastern Europe Butyric Acid Market by Type
11.3.1.8.2 Rest of Eastern Europe Butyric Acid Market by Derivatives
11.3.1.8.3 Rest of Eastern Europe Butyric Acid Market by End-use
11.3.2 Western Europe
11.3.2.1 Western Europe Butyric Acid Market by Type
11.3.2.2 Western Europe Butyric Acid Market by Derivatives
11.3.2.3 Western Europe Butyric Acid Market by End-use
11.3.2.4 Germany
11.3.2.4.1 Germany Butyric Acid Market by Type
11.3.2.4.2 Germany Butyric Acid Market by Derivatives
11.3.2.4.3 Germany Butyric Acid Market by End-use
11.3.2.5 France
11.3.2.5.1 France Butyric Acid Market by Type
11.3.2.5.2 France Butyric Acid Market by Derivatives
11.3.2.5.3 France Butyric Acid Market by End-use
11.3.2.6 UK
11.3.2.6.1 UK Butyric Acid Market by Type
11.3.2.6.2 UK Butyric Acid Market by Derivatives
11.3.2.6.3 UK Butyric Acid Market by End-use
11.3.2.7 Italy
11.3.2.7.1 Italy Butyric Acid Market by Type
11.3.2.7.2 Italy Butyric Acid Market by Derivatives
11.3.2.7.3 Italy Butyric Acid Market by End-use
11.3.2.8 Spain
11.3.2.8.1 Spain Butyric Acid Market by Type
11.3.2.8.2 Spain Butyric Acid Market by Derivatives
11.3.2.8.3 Spain Butyric Acid Market by End-use
11.3.2.9 Netherlands
11.3.2.9.1 Netherlands Butyric Acid Market by Type
11.3.2.9.2 Netherlands Butyric Acid Market by Derivatives
11.3.2.9.3 Netherlands Butyric Acid Market by End-use
11.3.2.10 Switzerland
11.3.2.10.1 Switzerland Butyric Acid Market by Type
11.3.2.10.2 Switzerland Butyric Acid Market by End-use
11.3.2.10.3 Switzerland Butyric Acid Market by Derivatives
11.3.2.11.1 Austria
11.3.2.11.2 Austria Butyric Acid Market by Type
11.3.2.11.3 Austria Butyric Acid Market by Derivatives
11.3.2.11.4 Austria Butyric Acid Market by End-use
11.3.2.12 Rest of Western Europe
11.3.2.12.1 Rest of Western Europe Butyric Acid Market by Type
11.3.2.12.2 Rest of Western Europe Butyric Acid Market by Derivatives
11.3.2.12.3 Rest of Western Europe Butyric Acid Market by End-use
11.4 Asia-Pacific
11.4.1 Asia-Pacific Butyric Acid Market by Country
11.4.2 Asia-Pacific Butyric Acid Market by Type
11.4.3 Asia-Pacific Butyric Acid Market by Derivatives
11.4.4 Asia-Pacific Butyric Acid Market by End-use
11.4.5 China
11.4.5.1 China Butyric Acid Market by Type
11.4.5.2 China Butyric Acid Market by Derivatives
11.4.5.3 China Butyric Acid Market by End-use
11.4.6 India
11.4.6.1 India Butyric Acid Market by Type
11.4.6.2 India Butyric Acid Market by Derivatives
11.4.6.3 India Butyric Acid Market by End-use
11.4.7 Japan
11.4.7.1 Japan Butyric Acid Market by Type
11.4.7.2 Japan Butyric Acid Market by Derivatives
11.4.7.3 Japan Butyric Acid Market by End-use
11.4.8 South Korea
11.4.8.1 South Korea Butyric Acid Market by Type
11.4.8.2 South Korea Butyric Acid Market by Derivatives
11.4.8.3 South Korea Butyric Acid Market by End-use
11.4.9 Vietnam
11.4.9.1 Vietnam Butyric Acid Market by Type
11.4.9.2 Vietnam Butyric Acid Market by Derivatives
11.4.9.3 Vietnam Butyric Acid Market by End-use
11.4.10 Singapore
11.4.10.1 Singapore Butyric Acid Market by Type
11.4.10.2 Singapore Butyric Acid Market by Derivatives
11.4.10.3 Singapore Butyric Acid Market by End-use
11.4.11 Australia
11.4.11.1 Australia Butyric Acid Market by Type
11.4.11.2 Australia Butyric Acid Market by Derivatives
11.4.11.3 Australia Butyric Acid Market by End-use
11.4.12 Rest of Asia-Pacific
11.4.12.1 Rest of Asia-Pacific Butyric Acid Market by Type
11.4.12.2 Rest of Asia-Pacific Butyric Acid Market by Derivatives
11.4.12.3 Rest of Asia-Pacific Butyric Acid Market by End-use
11.5 Middle East & Africa
11.5.1 Middle East
11.5.1.1 Middle East Butyric Acid Market by country
11.5.1.2 Middle East Butyric Acid Market by Type
11.5.1.3 Middle East Butyric Acid Market by Derivatives
11.5.1.4 Middle East Butyric Acid Market by End-use
11.5.1.5 UAE
11.5.1.5.1 UAE Butyric Acid Market by Type
11.5.1.5.2 UAE Butyric Acid Market by Derivatives
11.5.1.5.3 UAE Butyric Acid Market by End-use
11.5.1.6 Egypt
11.5.1.6.1 Egypt Butyric Acid Market by Type
11.5.1.6.2 Egypt Butyric Acid Market by Derivatives
11.5.1.6.3 Egypt Butyric Acid Market by End-use
11.5.1.7 Saudi Arabia
11.5.1.7.1 Saudi Arabia Butyric Acid Market by Type
11.5.1.7.2 Saudi Arabia Butyric Acid Market by Derivatives
11.5.1.7.3 Saudi Arabia Butyric Acid Market by End-use
11.5.1.8 Qatar
11.5.1.8.1 Qatar Butyric Acid Market by Type
11.5.1.8.2 Qatar Butyric Acid Market by Derivatives
11.5.1.8.3 Qatar Butyric Acid Market by End-use
11.5.1.9 Rest of Middle East
11.5.1.9.1 Rest of Middle East Butyric Acid Market by Type
11.5.1.9.2 Rest of Middle East Butyric Acid Market by Derivatives
11.5.1.9.3 Rest of Middle East Butyric Acid Market by End-use
11.5.2 Africa
11.5.2.1 Africa Butyric Acid Market by Country
11.5.2.2 Africa Butyric Acid Market by Type
11.5.2.3 Africa Butyric Acid Market by Derivatives
11.5.2.4 Africa Butyric Acid Market by End-use
11.5.2.5 Nigeria
11.5.2.5.1 Nigeria Butyric Acid Market by Type
11.5.2.5.2 Nigeria Butyric Acid Market by Derivatives
11.5.2.5.3 Nigeria Butyric Acid Market by End-use
11.5.2.6 South Africa
11.5.2.6.1 South Africa Butyric Acid Market by Type
11.5.2.6.2 South Africa Butyric Acid Market by Derivatives
11.5.2.6.3 South Africa Butyric Acid Market by End-use
11.5.2.7 Rest of Africa
11.5.2.7.1 Rest of Africa Butyric Acid Market by Type
11.5.2.7.2 Rest of Africa Butyric Acid Market by Derivatives
11.5.2.7.3 Rest of Africa Butyric Acid Market by End-use
11.6 Latin America
11.6.1 Latin America Butyric Acid Market by Country
11.6.2 Latin America Butyric Acid Market by Type
11.6.3 Latin America Butyric Acid Market by Derivatives
11.6.4 Latin America Butyric Acid Market by End-use
11.6.5 Brazil
11.6.5.1 Brazil Butyric Acid Market by Type
11.6.5.2 Brazil Butyric Acid Market by Derivatives
11.6.5.3 Brazil Butyric Acid Market by End-use
11.6.6 Argentina
11.6.6.1 Argentina Butyric Acid Market by Type
11.6.6.2 Argentina Butyric Acid Market by Derivatives
11.6.6.3 Argentina Butyric Acid Market by End-use
11.6.7 Colombia
11.6.7.1 Colombia Butyric Acid Market by Type
11.6.7.2 Colombia Butyric Acid Market by Derivatives
11.6.7.3 Colombia Butyric Acid Market by End-use
11.6.8 Rest of Latin America
11.6.8.1 Rest of Latin America Butyric Acid Market by Type
11.6.8.2 Rest of Latin America Butyric Acid Market by Derivatives
11.6.8.3    Rest of Latin America Butyric Acid Market by End-use


12. Company profile
12.1 Eastman Chemical Company
12.1.1 Company Overview
12.1.2 Financial
12.1.3 Products/ Services Offered
12.1.4 SWOT Analysis
12.1.5 The SNS View
12.2 OQ Chemicals GmbH
12.2.1 Company Overview
12.2.2 Financials
12.2.3 Products/ Services Offered
12.2.4 SWOT Analysis
12.2.5 The SNS View
12.3 Perstorp Holding AB
12.3.1 Company Overview
12.3.2 Financials
12.3.3 Products/ Services Offered
12.3.4 SWOT Analysis
12.3.5 The SNS View
12.4 Blue Marble Biomaterials
12.4.1 Company Overview
12.4.2 Financials
12.4.3 Products/ Services Offered
12.4.4 SWOT Analysis
12.4.5 The SNS View
12.5 Tokyo Chemical Industry Co. Ltd.
12.5.1 Company Overview
12.5.2 Financials
12.5.3 Products/ Services Offered
12.5.4 SWOT Analysis
12.5.5 The SNS View
12.6 Alfa Aesar
12.6.1 Company Overview
12.6.2 Financials
12.6.3 Products/ Services Offered
12.6.4 SWOT Analysis
12.6.5 The SNS View
12.7 OXEA GmbH
12.7.1 Company Overview
12.7.2 Financials
12.7.3 Products/ Services Offered
12.7.4 SWOT Analysis
12.7.5 The SNS View
12.8 Beijing Huamaoyuan Fragrance Flavor Co. Ltd.
12.8.1 Company Overview
12.8.2 Financials
12.8.3 Products/ Services Offered
12.8.4 SWOT Analysis
12.8.5 The SNS View
12.9 Snowco Industrial Co. Ltd.
12.9.1 Company Overview
12.9.2 Financials
12.9.3 Products/ Services Offered
12.9.4 SWOT Analysis
12.9.5 The SNS View
12.10 Palital Feed Additives B.V.
12.10.1 Company Overview
12.10.2 Financials
12.10.3 Products/ Services Offered
12.10.4 SWOT Analysis
12.10.5 The SNS View


13. Competitive Landscape
13.1 Competitive Benchmarking
13.2 Market Share Analysis
13.3 Recent Developments
13.3.1 Industry News
13.3.2 Company News
13.3.3 Mergers & Acquisitions


14. Use Case and Best Practices


15. Conclusion

An accurate research report requires proper strategizing as well as implementation. There are multiple factors involved in the completion of good and accurate research report and selecting the best methodology to compete the research is the toughest part. Since the research reports we provide play a crucial role in any company’s decision-making process, therefore we at SNS Insider always believe that we should choose the best method which gives us results closer to reality. This allows us to reach at a stage wherein we can provide our clients best and accurate investment to output ratio.

Each report that we prepare takes a timeframe of 350-400 business hours for production. Starting from the selection of titles through a couple of in-depth brain storming session to the final QC process before uploading our titles on our website we dedicate around 350 working hours. The titles are selected based on their current market cap and the foreseen CAGR and growth.


The 5 steps process:

Step 1: Secondary Research:

Secondary Research or Desk Research is as the name suggests is a research process wherein, we collect data through the readily available information. In this process we use various paid and unpaid databases which our team has access to and gather data through the same. This includes examining of listed companies’ annual reports, Journals, SEC filling etc. Apart from this our team has access to various associations across the globe across different industries. Lastly, we have exchange relationships with various university as well as individual libraries.

Secondary Research

Step 2: Primary Research

When we talk about primary research, it is a type of study in which the researchers collect relevant data samples directly, rather than relying on previously collected data.  This type of research is focused on gaining content specific facts that can be sued to solve specific problems. Since the collected data is fresh and first hand therefore it makes the study more accurate and genuine.

We at SNS Insider have divided Primary Research into 2 parts.

Part 1 wherein we interview the KOLs of major players as well as the upcoming ones across various geographic regions. This allows us to have their view over the market scenario and acts as an important tool to come closer to the accurate market numbers. As many as 45 paid and unpaid primary interviews are taken from both the demand and supply side of the industry to make sure we land at an accurate judgement and analysis of the market.

This step involves the triangulation of data wherein our team analyses the interview transcripts, online survey responses and observation of on filed participants. The below mentioned chart should give a better understanding of the part 1 of the primary interview.

Primary Research

Part 2: In this part of primary research the data collected via secondary research and the part 1 of the primary research is validated with the interviews from individual consultants and subject matter experts.

Consultants are those set of people who have at least 12 years of experience and expertise within the industry whereas Subject Matter Experts are those with at least 15 years of experience behind their back within the same space. The data with the help of two main processes i.e., FGDs (Focused Group Discussions) and IDs (Individual Discussions). This gives us a 3rd party nonbiased primary view of the market scenario making it a more dependable one while collation of the data pointers.

Step 3: Data Bank Validation

Once all the information is collected via primary and secondary sources, we run that information for data validation. At our intelligence centre our research heads track a lot of information related to the market which includes the quarterly reports, the daily stock prices, and other relevant information. Our data bank server gets updated every fortnight and that is how the information which we collected using our primary and secondary information is revalidated in real time.

Data Bank Validation

Step 4: QA/QC Process

After all the data collection and validation our team does a final level of quality check and quality assurance to get rid of any unwanted or undesired mistakes. This might include but not limited to getting rid of the any typos, duplication of numbers or missing of any important information. The people involved in this process include technical content writers, research heads and graphics people. Once this process is completed the title gets uploader on our platform for our clients to read it.

Step 5: Final QC/QA Process:

This is the last process and comes when the client has ordered the study. In this process a final QA/QC is done before the study is emailed to the client. Since we believe in giving our clients a good experience of our research studies, therefore, to make sure that we do not lack at our end in any way humanly possible we do a final round of quality check and then dispatch the study to the client.

Start a Conversation

Hi! Click one of our member below to chat on Phone