Virtual Studio Market Report Scope & Overview:
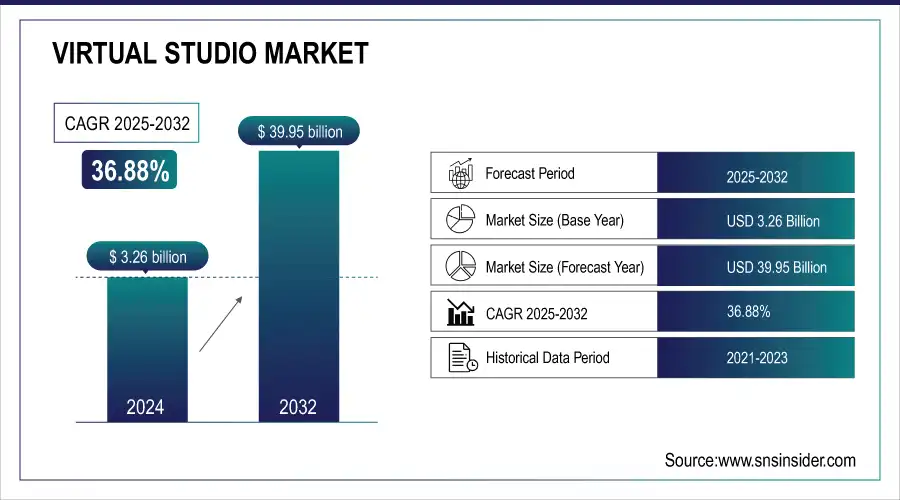
The Virtual Studio Market size was valued at USD 3.26 billion in 2024 and is expected to reach USD 39.95 billion by 2032, growing at a CAGR of 36.88% over 2025-2032.
The Virtual Studio Market growth is increasing as production of content in real-time but at a cost-effective price is on the rise throughout the media and entertainment industries. Improvements in real-time rendering engines, virtual production tools, and camera tracking technology have given studios the ability to really create great-looking visuals without having to shoot on physical sets. Rapid adoption has also been spurred by the increased need for more immersive content in films, television shows, live events, and streaming online.
An example of this trend is Studio Ulster, a USD 91 million virtual production facility in Belfast backed by the UK government and Ulster University, which boasts the tallest motion-capture stage in Europe, and LED volume walls, robotics, LiDAR, and 3D/4D scanning technologies. And using augmented reality (AR) and extended reality (XR) in broadcasting and advertising deepens the connection with the audience.
In Singapore, the Infocomm Media Development Authority (IMDA) has partnered with the UK’s National Film and Television School to train 15 local media lecturers and industry professionals, launching industry challenges and specialized virtual production training programs. The shift toward remote production workflows post-pandemic has also fueled investment in cloud-based virtual studio solutions.
The U.S. Virtual Studio Market size was valued at USD 0.77 billion in 2024 and is expected to reach USD 9.29 billion by 2032, growing at a CAGR of 36.42% over 2025-2032.
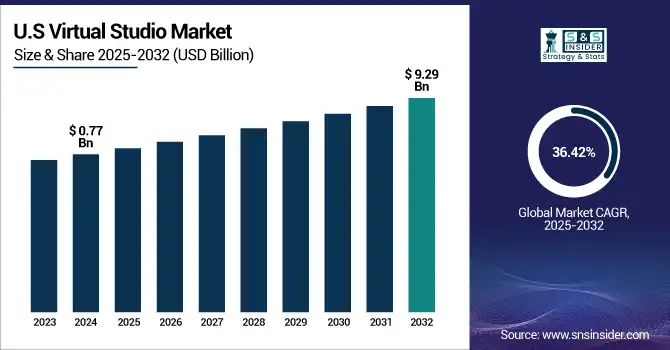
The growth of the U.S. Virtual Studio Market is due to the increasing adoption of scalable-source real-time production tools, rising demand for remote production and content creation, increased investment in many advanced broadcast technologies across entertainment, advertising, and even live events which continue to be strong in the post-pandemic era against the backdrop of Digital Transformation.
Virtual Studio Market Dynamics
Drivers
-
Growing Demand for Real-Time Content Creation Is Accelerating the Adoption of Advanced Virtual Production Tools and Environments Globally
As the need for real-time content generation in film, TV and streaming increases, the production houses are moving to virtual studios. By utilizing real-time integrated CGI with live-action imagery, these studios are able to provide greater flexibility, cost savings, and faster turnaround on content. Growing demand that is especially in entertainment and broadcast sectors where speed and quality are key factors. In addition to this, virtual studios are used by gaming and eSports industries to provide a more engaging experience. Such a shift allows for smooth remote collaboration, easy post-production, and increases efficiency, making real-time content generation, a formidable market-fuelling engine.
-
Abertay University has used 5G-enabled virtual production in a project - collaborating with other UK partners to allow actors filmed 280 miles apart in Dundee and Manchester to connect and interact in a shared virtual environment in real-time, demonstrating the power of remote collaboration without requiring physical co-location.
Restraints
-
High Initial Investment in Virtual Studio Infrastructure Limits Adoption Among Small-Scale Studios and Independent Content Creators
High-res LED walls, accurate camera tracking systems, rendering engines, and bespoke software requires an expensive initial capital investment for virtual studios. Costs such as these are often prohibitive and a barrier to entry for smaller studios and indie producers. Moreover, high ongoing maintenance and upgrade costs further deter adoption. Large media houses can presumably justify the cost owing to a higher production run, while independent creators typically need to work with conventional setups. Financial constraints limit mass market penetrance, mainly in developing regions, where a lack of access to funding, in addition to budget restrictions, leads to impediments when scaling up virtual studio deployments.
Opportunities
-
Integration With AI And Real-Time Rendering Engines is Unlocking Next-Gen Creativity and Automation in Virtual Production
The pace, creativity and direction that artificial intelligence and real-time rendering technologies such as Unreal Engine has for how virtual studios create content is changing. With the help of AI for generating scenes, changing lighting, and tracking objects, repetitive tasks will be completed through tools thus releasing human resources for creative work. Real-time rendering is a high-quality rendering technique that provides photorealistic outputs in no time, which adds life to the virtual environments. It shortens production time and enhances storytelling skill. This integration is a key opportunity to take the market to the next level of technology, as these technologies mature, virtual studios can provide more customization, smarter and more adaptive workflows.
-
Epic Games announced full integration of MetaHuman 5.6 to Unreal Engine, provides the access for real-time animation and expressiveness to be compatible directly within the Unreal Engine in 2025. Additionally, new MetaHuman Animator can create high-fidelity facial animation from audio or camera input alone.
Challenges
-
Managing Large Data Volumes in Real-Time Places Pressure on Network Infrastructure and Storage Capabilities in Virtual Studio Setups
Virtual studios need to render, process and store enormous amounts of high-resolution visual data in real-time. These data loads require powerful computing and ultra-fast network connections that are not always available or affordable. Poor bandwidth means dips, frame drops or delayed renders that can break a live production. Large files for big projects, particularly render outputs, need scalable storage, which means costs to the infrastructure also grow. For studios that do not have high-performance IT environments, the operational risks of data are significant. Meeting these needs is crucial to deliver high quality, reliable virtual experiences.
Virtual Studio Market Segments
By Component
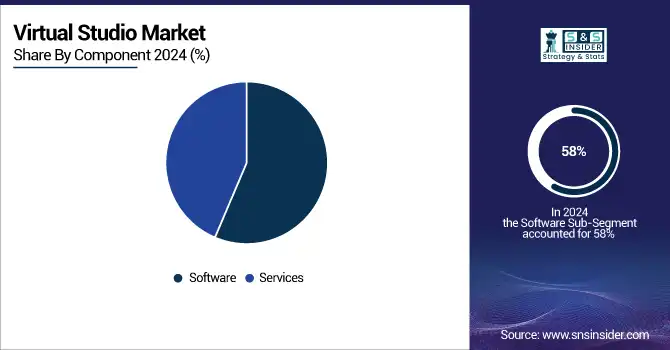
The software segment dominated the Virtual Studio Market share of a 58% in 2024 owing to the high demand for real-time rendering, VFX tools, and virtual production platforms including Unreal Engine and more. Ideal for studios using digital production techniques across the film, television, and live media industries, these software solutions create artistic production freedom, integrate seamlessly with hardware, and streamline content creation workflows.
The services segment is projected to grow at the fastest CAGR of 38.23% over 2025 to 2032 due to growing demand for consulting, integration and managed services With more companies coming into the production office requiring virtual studio setups that come with intricate configurations, execution of real-time collaboration, and constant maintenance, such companies need expertise in their corner. The stickiness here is especially pronounced with first time users who are looking for end-to-end service support for seamless implementation and operations.
By Deployment
The on-premises segment captured 53% of the Virtual Studio Market revenue in 2024 as a result of larger media houses that prefer high-performance, secured, and customizable production environments. On the other hand, for big-budget projects in which speed, security, and quality are existential pillars, on-premises configurations give enhanced control over sensitive material and low-latency operation and alignment with studio-owned, proprietary infrastructure.
The cloud-based segment is expected to grow at the fastest CAGR of 38.51% over 2025 to 2032, driven by the demand for production solutions that are more flexible, scalable, and suitable for remote use. Cloud platforms decrease hardware dependence, allow collaboration across the globe, and easily offer access to high-grade virtual production equipment. Such on-demand, pay-as-you-go resources at a low-cost without a major capital investment is particularly appealing to SMEs and content creators.
By Enterprise Size
Large enterprises held a 60% revenue share in the Virtual Studio Market in 2024, owing to their larger capacity for investing in technology, skillful personnel, and in-house production capacity over SMBs. Quality and scale are also critical for these organizations, which tend to create high-budget content that benefits from cutting-edge virtual production tools, and thus, can be expected to maintain their dominance throughout the spectrum.
SMEs are expected to grow at the fastest CAGR of 38.55% over 2025 to 2032 owing to rising adoption of low-cost virtual studio solutions. Thus cloud-based platforms, subscription-based models, and modular software tools are enabling smaller businesses and content creators to participate in the virtual production arena. Further democratization of technology allows small and medium enterprises (SMEs) to innovate and cost-effectively scale what they offer in digital content.
By Application
The post-production editing segment held a 28% revenue share in 2024, driven by its high emphasis on merging CGI, virtual environments & compositing with live action footage. Virtual studios vastly increase how much one can change the original material instantly, which is a dream come true for an editor. It is a market-leading application among higher budgeted films and TV, with the vast majority of it produced using virtual editing workflows.
Live streaming and broadcasting is forecasted to grow at the fastest CAGR of 40% over 2025 to 2032, primarily on account of the increasing demand for immersive, real-time visual content through sports analytics and eSports events. Dynamic backgrounds and interactive backdrops with live graphics can increase viewer response thanks to virtual studios. These setups are becoming increasingly popular with broadcasters as a way to stand out from the competition, and offer rapid remote production elasticity.
By End Use
The online videos segment accounted for 33% of the Virtual Studio Market revenue in 2024 due to high demand for creative content from platforms such as YouTube, Tiktok and Instagram. The proliferation and democratization of virtual production tools have become the latest trend for content creators, influencers, and the brands they serve to inject a new level of creativity into visual storytelling, improve post-production efficiencies, and compete in an ever-evolving digital media landscape.
Commercial ads are anticipated to grow at the fastest CAGR of 38.95% over 2025 to 2032 as virtual studios are increasingly being used to create visually appealing and more cost-effective advertisements. Real-time rendering and virtual environments allow brands to create the most personalized, experiential campaigns possible. The prospect of cutting down on shoot costs, time and visual aesthetics makes advertising sector adopts it fast.
Virtual Studio Market Regional Analysis
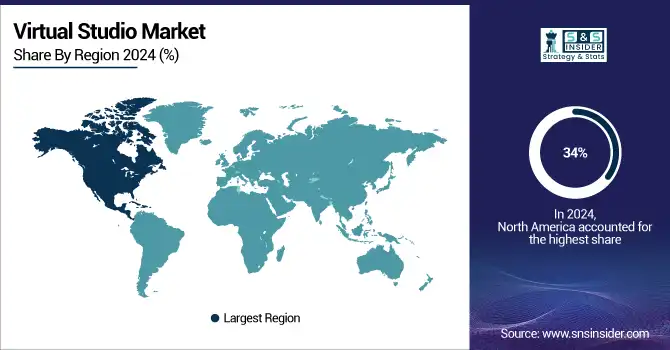
North America held the largest revenue share of 34% in the Virtual Studio Market in 2024 as most of the leading studios launched the advanced production technologies across the U.S. and Canada. Support from leading technology providers, solid infrastructure and a developed media and entertainment industry have been encouraging ongoing investment in virtual production solutions, hence the Middle East stakes a strong claim as global vanguards of virtual studio adoption.
The U.S. is dominating the Virtual Studio Market in North America due to its advanced media infrastructure and early adoption of virtual production technologies.
Asia Pacific is expected to grow at the fastest CAGR of 39.32% over 2025 to 2032, due to solid digital transformation processes boosting content creation across developing economies such as China, India, and South Korea and growing need of immersive media market. Increased government backing for creative industries, the rise of OTT platforms, growing knowledge about cost-effective virtual production tools and a fragmented media environment are all enabling quicker adoption in dynamic studios across the region.
China is the leader of the Virtual Studio Market in Asia Pacific owing to large scale investments in Digital media, grown infrastructure and a rise of entertainment sector with potential.
Europe is experiencing strong growth in the Virtual Studio Market, due to the high demand for virtual production in film, advertising, and broadcasting. Technological innovation and government-backed creative industry initiatives are leading adoption by countries such as the UK, Germany and France.
The U.K. is dominating the Virtual Studio Market in Europe, owing to the presence of established and well-served film production hubs, the high adoption of advanced technology and government support.
Emerging markets such as Middle East & Africa and Latin America are driven by digital transformation, expanding media sectors, and digital content creators investing in virtual production, fueling key Virtual Studio Market trends among broadcasting, advertising and entertainment applications.
Key Players
Virtual Studio Market companies are Adobe Inc., Autodesk, Inc., Avid Technology, Inc., Blackmagic Design Pty Ltd, Chaos Group Ltd., Emerson Electric Co., Epic Games, Inc., Foundry Visionmongers Ltd., Harmonic Inc., Luxion, Inc., Maxon Computer GmbH, Microsoft Corporation, Monarch Innovative Technologies Pvt. Ltd., Nippon Control System Corporation, OTOY Inc., PreSonus Audio Electronics, Inc., SideFX Software Inc., Unity Technologies, Vizrt Group, Pixotope Technologies AS.
Recent Developments:
-
2025: Adobe Inc. introduced Creative Cloud 2025.1, accelerating virtual studio workflows AI-powered Firefly Boards, up to 5× faster rendering and enhanced video & design collaboration tools.
-
2023: Epic Games, Inc. launched the Virtual Production Visualization Guide a step-by-step tutorial series guiding film and broadcast professionals through Unreal Engine workflows for previs, pitchvis, techvis, and LED‑stage deployment.
Report Attributes | Details |
---|---|
Market Size in 2024 | USD 3.26 Billion |
Market Size by 2032 | USD 39.95 Billion |
CAGR | CAGR of 36.88% From 2025 to 2032 |
Base Year | 2024 |
Forecast Period | 2025-2032 |
Historical Data | 2021-2023 |
Report Scope & Coverage | Market Size, Segments Analysis, Competitive Landscape, Regional Analysis, DROC & SWOT Analysis, Forecast Outlook |
Key Segments | • By Component (Software, Services) • By Deployment (On-Premises, Cloud-based) • By Enterprise Size (SMEs, Large Enterprise) • By Application (Virtual Sets and Environments, Motion Capture and Tracking, Rendering and Animation, Live Streaming and Broadcasting, Post-Production Editing) • By End Use (Movies, TV Shows, Commercial Ads, Online Videos, Others) |
Regional Analysis/Coverage | North America (US, Canada), Europe (Germany, UK, France, Italy, Spain, Russia, Poland, Rest of Europe), Asia Pacific (China, India, Japan, South Korea, Australia, ASEAN Countries, Rest of Asia Pacific), Middle East & Africa (UAE, Saudi Arabia, Qatar, South Africa, Rest of Middle East & Africa), Latin America (Brazil, Argentina, Mexico, Colombia, Rest of Latin America). |
Company Profiles | Adobe Inc., Autodesk, Inc., Avid Technology, Inc., Blackmagic Design Pty Ltd, Chaos Group Ltd., Emerson Electric Co., Epic Games, Inc., Foundry Visionmongers Ltd., Harmonic Inc., Luxion, Inc., Maxon Computer GmbH, Microsoft Corporation, Monarch Innovative Technologies Pvt. Ltd., Nippon Control System Corporation, OTOY Inc., PreSonus Audio Electronics, Inc., SideFX Software Inc., Unity Technologies, Vizrt Group, Pixotope Technologies AS |
Table Of Contents
1. Introduction
1.1 Market Definition & Scope
1.2 Research Assumptions & Abbreviations
1.3 Research Methodology
2. Executive Summary
2.1 Market Snapshot
2.2 Market Absolute $ Opportunity Assessment & Y-o-Y Analysis, 2021–2032
2.3 Market Size & Forecast, By Segmentation, 2021–2032
2.3.1 Market Size By Component
2.3.2 Market Size By Application
2.3.3 Market Size By Deployment
2.3.4 Market Size By End Use
2.3.5 Market Size By Enterprise Size
2.4 Market Share & Bps Analysis By Region, 2024
2.5 Industry Growth Scenarios – Conservative, Likely & Optimistic
2.6 Industry CxO’s Perspective
3. Market Overview
3.1 Market Dynamics
3.1.1 Drivers
3.1.2 Restraints
3.1.3 Opportunities
3.1.4 Key Market Trends
3.2 Industry PESTLE Analysis
3.3 Key Industry Forces (Porter’s) Impacting Market Growth
3.4 Industry Supply Chain Analysis
3.4.1 Raw Material Suppliers
3.4.2 Manufacturers
3.4.3 Distributors/Suppliers
3.4.4 Customers/End-Users
3.5 Industry Life Cycle Assessment
3.6 Parent Market Overview
3.7 Market Risk Assessment
4. Statistical Insights & Trends Reporting
4.1 Pricing Analysis & Forecast
4.1.1 Overview
4.1.2 Pricing Analysis & Forecast By Component
4.1.3 Price Benchmarking By Key Players
4.1.4 Average Subscription Pricing for Virtual Studio Software (Monthly/Annual)
4.1.5 Cost Structure Breakdown: Hardware vs. Software vs. Services
4.2 Regulatory Landscape
4.2.1 Overview
4.2.2 Regulatory Trends By Key Countries
4.2.3 Regulatory Outlook By Component Type
4.2.4 Standards & Certification Requirements for Virtual Production Tools
4.2.5 Compliance Guidelines for Cloud-Based Virtual Studio Solutions
4.3 Technology Evolution & Integration Stats
4.3.1 Overview
4.3.2 Integration Rate with Real-Time Rendering Engines (e.g., Unreal Engine, Unity)
4.3.3 Usage Statistics of AR/VR Components in Virtual Studios
4.3.4 Cloud vs. On-Premise Virtual Studio Adoption Split
4.3.5 AI & ML Integration in Virtual Production Workflows
4.4 Investment & Innovation Landscape
4.4.1 Overview
4.4.2 Venture Capital and Private Equity Funding by Segment
4.4.3 M&A Activity Analysis in Virtual Studio Ecosystem
4.4.4 Patent Filing Trends in Real-Time Graphics & Virtual Production
4.4.5 Innovation Hotspots and R&D Spending Trends
5. Virtual Studio Market Segmental Analysis & Forecast, By Component, 2021 – 2032, Value (Usd Billion) & Volume (Number of Installations)
5.1 Introduction
5.2 Software
5.2.1 Key Trends
5.2.2 Market Size & Forecast, 2021 – 2032
5.3 Services
5.3.1 Key Trends
5.3.2 Market Size & Forecast, 2021 – 2032
6. Virtual Studio Market Segmental Analysis & Forecast, By Application, 2021 – 2032, Value (USD Billion) & Volume (Number of Installations)
6.1 Introduction
6.2 Virtual Sets and Environments
6.2.1 Key Trends
6.2.2 Market Size & Forecast, 2021 – 2032
6.3 Motion Capture and Tracking
6.3.1 Key Trends
6.3.2 Market Size & Forecast, 2021 – 2032
6.4 Rendering and Animation
6.4.1 Key Trends
6.4.2 Market Size & Forecast, 2021 – 2032
6.5 Live Streaming and Broadcasting
6.5.1 Key Trends
6.5.2 Market Size & Forecast, 2021 – 2032
6.6 Post-Production Editing
6.6.1 Key Trends
6.6.2 Market Size & Forecast, 2021 – 2032
7. Virtual Studio Market Segmental Analysis & Forecast, By Enterprise Size, 2021 – 2032, Value (USD Billion) & Volume (Number of Installations)
7.1 Introduction
7.2 SMEs
7.2.1 Key Trends
7.2.2 Market Size & Forecast, 2021 – 2032
7.3 Large Enterprise
7.3.1 Key Trends
7.3.2 Market Size & Forecast, 2021 – 2032
8. Virtual Studio Market Segmental Analysis & Forecast, By End Use, 2021 – 2032, Value (USD Billion) & Volume (Number of Installations)
8.1 Introduction
8.2 Movies
8.2.1 Key Trends
8.2.2 Market Size & Forecast, 2021 – 2032
8.3 TV Shows
8.3.1 Key Trends
8.3.2 Market Size & Forecast, 2021 – 2032
8.4 Commercial Ads
8.4.1 Key Trends
8.4.2 Market Size & Forecast, 2021 – 2032
8.5 Online Videos
8.5.1 Key Trends
8.5.2 Market Size & Forecast, 2021 – 2032
8.6 Others
8.6.1 Key Trends
8.6.2 Market Size & Forecast, 2021 – 2032
9. Virtual Studio Market Segmental Analysis & Forecast, By Deployment, 2021 – 2032, Value (USD Billion) & Volume (Number of Installations)
9.1 Introduction
9.2 SMEs
9.2.1 Key Trends
9.2.2 Market Size & Forecast, 2021 – 2032
9.3 Large Enterprise
9.3.1 Key Trends
9.3.2 Market Size & Forecast, 2021 – 2032
9.4 Deployment 3
9.4.1 Key Trends
9.4.2 Market Size & Forecast, 2021 – 2032
9.5 Deployment 4
9.5.1 Key Trends
9.5.2 Market Size & Forecast, 2021 – 2032
9.6 Deployment 5
9.6.1 Key Trends
9.6.2 Market Size & Forecast, 2021 – 2032
9.7 Deployment 6
9.7.1 Key Trends
9.7.2 Market Size & Forecast, 2021 – 2032
9.8 Deployment 7
9.8.1 Key Trends
9.8.2 Market Size & Forecast, 2021 – 2032
9.9 Deployment 8
9.9.1 Key Trends
9.9.2 Market Size & Forecast, 2021 – 2032
10. Virtual Studio Market Segmental Analysis & Forecast By Region, 2021 – 2032, Value (USD Billion) & Volume (Number of Installations)
10.1 Introduction
10.2 North America
10.2.1 Key Trends
10.2.2 Virtual Studio Market Size & Forecast, By Component, 2021 – 2032
10.2.3 Virtual Studio Market Size & Forecast, By Application, 2021 – 2032
10.2.4 Virtual Studio Market Size & Forecast, By Enterprise Size, 2021 – 2032
10.2.5 Virtual Studio Market Size & Forecast, By End Use, 2021 – 2032
10.2.6 Virtual Studio Market Size & Forecast, By Deployment, 2021 – 2032
10.2.7 Virtual Studio Market Size & Forecast, By Country, 2021 – 2032
10.2.7.1 USA
10.2.7.1.1 Virtual Studio Market Size & Forecast, By Component, 2021 – 2032
10.2.7.1.2 Virtual Studio Market Size & Forecast, By Application, 2021 – 2032
10.2.7.1.3 Virtual Studio Market Size & Forecast, By Enterprise Size, 2021 – 2032
10.2.7.1.4 Virtual Studio Market Size & Forecast, By End Use, 2021 – 2032
10.2.7.1.5 Virtual Studio Market Size & Forecast, By Deployment, 2021 – 2032
10.2.7.2 Canada
10.2.7.2.1 Virtual Studio Market Size & Forecast, By Component, 2021 – 2032
10.2.7.2.2 Virtual Studio Market Size & Forecast, By Application, 2021 – 2032
10.2.7.2.3 Virtual Studio Market Size & Forecast, By Enterprise Size, 2021 – 2032
10.2.7.2.4 Virtual Studio Market Size & Forecast, By End Use, 2021 – 2032
10.2.7.2.5 Virtual Studio Market Size & Forecast, By Deployment, 2021 – 2032
10.3 Europe
10.3.1 Key Trends
10.3.2 Virtual Studio Market Size & Forecast, By Component, 2021 – 2032
10.3.3 Virtual Studio Market Size & Forecast, By Application, 2021 – 2032
10.3.4 Virtual Studio Market Size & Forecast, By Enterprise Size, 2021 – 2032
10.3.5 Virtual Studio Market Size & Forecast, By End Use, 2021 – 2032
10.3.6 Virtual Studio Market Size & Forecast, By Deployment, 2021 – 2032
10.3.7 Virtual Studio Market Size & Forecast, By Country, 2021 – 2032
10.3.7.1 Germany
10.3.7.1.1 Virtual Studio Market Size & Forecast, By Component, 2021 – 2032
10.3.7.1.2 Virtual Studio Market Size & Forecast, By Application, 2021 – 2032
10.3.7.1.3 Virtual Studio Market Size & Forecast, By Enterprise Size, 2021 – 2032
10.3.7.1.4 Virtual Studio Market Size & Forecast, By End Use, 2021 – 2032
10.3.7.1.5 Virtual Studio Market Size & Forecast, By Deployment, 2021 – 2032
10.3.7.2 UK
10.3.7.2.1 Virtual Studio Market Size & Forecast, By Component, 2021 – 2032
10.3.7.2.2 Virtual Studio Market Size & Forecast, By Application, 2021 – 2032
10.3.7.2.3 Virtual Studio Market Size & Forecast, By Enterprise Size, 2021 – 2032
10.3.7.2.4 Virtual Studio Market Size & Forecast, By End Use, 2021 – 2032
10.3.7.2.5 Virtual Studio Market Size & Forecast, By Deployment, 2021 – 2032
10.3.7.3 France
10.3.7.3.1 Virtual Studio Market Size & Forecast, By Component, 2021 – 2032
10.3.7.3.2 Virtual Studio Market Size & Forecast, By Application, 2021 – 2032
10.3.7.3.3 Virtual Studio Market Size & Forecast, By Enterprise Size, 2021 – 2032
10.3.7.3.4 Virtual Studio Market Size & Forecast, By End Use, 2021 – 2032
10.3.7.3.5 Virtual Studio Market Size & Forecast, By Deployment, 2021 – 2032
10.3.7.4 Italy
10.3.7.4.1 Virtual Studio Market Size & Forecast, By Component, 2021 – 2032
10.3.7.4.2 Virtual Studio Market Size & Forecast, By Application, 2021 – 2032
10.3.7.4.3 Virtual Studio Market Size & Forecast, By Enterprise Size, 2021 – 2032
10.3.7.4.4 Virtual Studio Market Size & Forecast, By End Use, 2021 – 2032
10.3.7.4.5 Virtual Studio Market Size & Forecast, By Deployment, 2021 – 2032
10.3.7.5 Spain
10.3.7.5.1 Virtual Studio Market Size & Forecast, By Component, 2021 – 2032
10.3.7.5.2 Virtual Studio Market Size & Forecast, By Application, 2021 – 2032
10.3.7.5.3 Virtual Studio Market Size & Forecast, By Enterprise Size, 2021 – 2032
10.3.7.5.4 Virtual Studio Market Size & Forecast, By End Use, 2021 – 2032
10.3.7.5.5 Virtual Studio Market Size & Forecast, By Deployment, 2021 – 2032
10.3.7.6 Russia
10.3.7.6.1 Virtual Studio Market Size & Forecast, By Component, 2021 – 2032
10.3.7.6.2 Virtual Studio Market Size & Forecast, By Application, 2021 – 2032
10.3.7.6.3 Virtual Studio Market Size & Forecast, By Enterprise Size, 2021 – 2032
10.3.7.6.4 Virtual Studio Market Size & Forecast, By End Use, 2021 – 2032
10.3.7.6.5 Virtual Studio Market Size & Forecast, By Deployment, 2021 – 2032
10.3.7.7 Poland
10.3.7.7.1 Virtual Studio Market Size & Forecast, By Component, 2021 – 2032
10.3.7.7.2 Virtual Studio Market Size & Forecast, By Application, 2021 – 2032
10.3.7.7.3 Virtual Studio Market Size & Forecast, By Enterprise Size, 2021 – 2032
10.3.7.7.4 Virtual Studio Market Size & Forecast, By End Use, 2021 – 2032
10.3.7.7.5 Virtual Studio Market Size & Forecast, By Deployment, 2021 – 2032
10.3.7.8 Rest of Europe
10.3.7.8.1 Virtual Studio Market Size & Forecast, By Component, 2021 – 2032
10.3.7.8.2 Virtual Studio Market Size & Forecast, By Application, 2021 – 2032
10.3.7.8.3 Virtual Studio Market Size & Forecast, By Enterprise Size, 2021 – 2032
10.3.7.8.4 Virtual Studio Market Size & Forecast, By End Use, 2021 – 2032
10.3.7.8.5 Virtual Studio Market Size & Forecast, By Deployment, 2021 – 2032
10.4 Asia-Pacific
10.4.1 Key Trends
10.4.2 Virtual Studio Market Size & Forecast, By Component, 2021 – 2032
10.4.3 Virtual Studio Market Size & Forecast, By Application, 2021 – 2032
10.4.4 Virtual Studio Market Size & Forecast, By Enterprise Size, 2021 – 2032
10.4.5 Virtual Studio Market Size & Forecast, By End Use, 2021 – 2032
10.4.6 Virtual Studio Market Size & Forecast, By Deployment, 2021 – 2032
10.4.7 Virtual Studio Market Size & Forecast, By Country, 2021 – 2032
10.4.7.1 China
10.4.7.1.1 Virtual Studio Market Size & Forecast, By Component, 2021 – 2032
10.4.7.1.2 Virtual Studio Market Size & Forecast, By Application, 2021 – 2032
10.4.7.1.3 Virtual Studio Market Size & Forecast, By Enterprise Size, 2021 – 2032
10.4.7.1.4 Virtual Studio Market Size & Forecast, By End Use, 2021 – 2032
10.4.7.1.5 Virtual Studio Market Size & Forecast, By Deployment, 2021 – 2032
10.4.7.2 India
10.4.7.2.1 Virtual Studio Market Size & Forecast, By Component, 2021 – 2032
10.4.7.2.2 Virtual Studio Market Size & Forecast, By Application, 2021 – 2032
10.4.7.2.3 Virtual Studio Market Size & Forecast, By Enterprise Size, 2021 – 2032
10.4.7.2.4 Virtual Studio Market Size & Forecast, By End Use, 2021 – 2032
10.4.7.2.5 Virtual Studio Market Size & Forecast, By Deployment, 2021 – 2032
10.4.7.3 Japan
10.4.7.3.1 Virtual Studio Market Size & Forecast, By Component, 2021 – 2032
10.4.7.3.2 Virtual Studio Market Size & Forecast, By Application, 2021 – 2032
10.4.7.3.3 Virtual Studio Market Size & Forecast, By Enterprise Size, 2021 – 2032
10.4.7.3.4 Virtual Studio Market Size & Forecast, By End Use, 2021 – 2032
10.4.7.3.5 Virtual Studio Market Size & Forecast, By Deployment, 2021 – 2032
10.4.7.4 South Korea
10.4.7.4.1 Virtual Studio Market Size & Forecast, By Component, 2021 – 2032
10.4.7.4.2 Virtual Studio Market Size & Forecast, By Application, 2021 – 2032
10.4.7.4.3 Virtual Studio Market Size & Forecast, By Enterprise Size, 2021 – 2032
10.4.7.4.4 Virtual Studio Market Size & Forecast, By End Use, 2021 – 2032
10.4.7.4.5 Virtual Studio Market Size & Forecast, By Deployment, 2021 – 2032
10.4.7.5 Australia
10.4.7.5.1 Virtual Studio Market Size & Forecast, By Component, 2021 – 2032
10.4.7.5.2 Virtual Studio Market Size & Forecast, By Application, 2021 – 2032
10.4.7.5.3 Virtual Studio Market Size & Forecast, By Enterprise Size, 2021 – 2032
10.4.7.5.4 Virtual Studio Market Size & Forecast, By End Use, 2021 – 2032
10.4.7.5.5 Virtual Studio Market Size & Forecast, By Deployment, 2021 – 2032
10.4.7.6 ASEAN Countries
10.4.7.6.1 Virtual Studio Market Size & Forecast, By Component, 2021 – 2032
10.4.7.6.2 Virtual Studio Market Size & Forecast, By Application, 2021 – 2032
10.4.7.6.3 Virtual Studio Market Size & Forecast, By Enterprise Size, 2021 – 2032
10.4.7.6.4 Virtual Studio Market Size & Forecast, By End Use, 2021 – 2032
10.4.7.6.5 Virtual Studio Market Size & Forecast, By Deployment, 2021 – 2032
10.4.7.7 Rest of Asia-Pacific
10.4.7.7.1 Virtual Studio Market Size & Forecast, By Component, 2021 – 2032
10.4.7.7.2 Virtual Studio Market Size & Forecast, By Application, 2021 – 2032
10.4.7.7.3 Virtual Studio Market Size & Forecast, By Enterprise Size, 2021 – 2032
10.4.7.7.4 Virtual Studio Market Size & Forecast, By End Use, 2021 – 2032
10.4.7.7.5 Virtual Studio Market Size & Forecast, By Deployment, 2021 – 2032
10.5 Latin America
10.5.1 Key Trends
10.5.2 Virtual Studio Market Size & Forecast, By Component, 2021 – 2032
10.5.3 Virtual Studio Market Size & Forecast, By Application, 2021 – 2032
10.5.4 Virtual Studio Market Size & Forecast, By Enterprise Size, 2021 – 2032
10.5.5 Virtual Studio Market Size & Forecast, By End Use, 2021 – 2032
10.5.6 Virtual Studio Market Size & Forecast, By Deployment, 2021 – 2032
10.5.7 Virtual Studio Market Size & Forecast, By Country, 2021 – 2032
10.5.7.1 Brazil
10.5.7.1.1 Virtual Studio Market Size & Forecast, By Component, 2021 – 2032
10.5.7.1.2 Virtual Studio Market Size & Forecast, By Application, 2021 – 2032
10.5.7.1.3 Virtual Studio Market Size & Forecast, By Enterprise Size, 2021 – 2032
10.5.7.1.4 Virtual Studio Market Size & Forecast, By End Use, 2021 – 2032
10.5.7.1.5 Virtual Studio Market Size & Forecast, By Deployment, 2021 – 2032
10.5.7.2 Argentina
10.5.7.2.1 Virtual Studio Market Size & Forecast, By Component, 2021 – 2032
10.5.7.2.2 Virtual Studio Market Size & Forecast, By Application, 2021 – 2032
10.5.7.2.3 Virtual Studio Market Size & Forecast, By Enterprise Size, 2021 – 2032
10.5.7.2.4 Virtual Studio Market Size & Forecast, By End Use, 2021 – 2032
10.5.7.2.5 Virtual Studio Market Size & Forecast, By Deployment, 2021 – 2032
10.5.7.3 Mexico
10.5.7.3.1 Virtual Studio Market Size & Forecast, By Component, 2021 – 2032
10.5.7.3.2 Virtual Studio Market Size & Forecast, By Application, 2021 – 2032
10.5.7.3.3 Virtual Studio Market Size & Forecast, By Enterprise Size, 2021 – 2032
10.5.7.3.4 Virtual Studio Market Size & Forecast, By End Use, 2021 – 2032
10.5.7.3.5 Virtual Studio Market Size & Forecast, By Deployment, 2021 – 2032
10.5.7.4 Colombia
10.5.7.4.1 Virtual Studio Market Size & Forecast, By Component, 2021 – 2032
10.5.7.4.2 Virtual Studio Market Size & Forecast, By Application, 2021 – 2032
10.5.7.4.3 Virtual Studio Market Size & Forecast, By Enterprise Size, 2021 – 2032
10.5.7.4.4 Virtual Studio Market Size & Forecast, By End Use, 2021 – 2032
10.5.7.4.5 Virtual Studio Market Size & Forecast, By Deployment, 2021 – 2032
10.5.7.5 Rest of Latin America
10.5.7.5.1 Virtual Studio Market Size & Forecast, By Component, 2021 – 2032
10.5.7.5.2 Virtual Studio Market Size & Forecast, By Application, 2021 – 2032
10.5.7.5.3 Virtual Studio Market Size & Forecast, By Enterprise Size, 2021 – 2032
10.5.7.5.4 Virtual Studio Market Size & Forecast, By End Use, 2021 – 2032
10.5.7.5.5 Virtual Studio Market Size & Forecast, By Deployment, 2021 – 2032
10.6 Middle East & Africa
10.6.1 Key Trends
10.6.2 Virtual Studio Market Size & Forecast, By Component, 2021 – 2032
10.6.3 Virtual Studio Market Size & Forecast, By Application, 2021 – 2032
10.6.4 Virtual Studio Market Size & Forecast, By Enterprise Size, 2021 – 2032
10.6.5 Virtual Studio Market Size & Forecast, By End Use, 2021 – 2032
10.6.6 Virtual Studio Market Size & Forecast, By Deployment, 2021 – 2032
10.6.7 Virtual Studio Market Size & Forecast, By Country, 2021 – 2032
10.6.7.1 UAE
10.6.7.1.1 Virtual Studio Market Size & Forecast, By Component, 2021 – 2032
10.6.7.1.2 Virtual Studio Market Size & Forecast, By Application, 2021 – 2032
10.6.7.1.3 Virtual Studio Market Size & Forecast, By Enterprise Size, 2021 – 2032
10.6.7.1.4 Virtual Studio Market Size & Forecast, By End Use, 2021 – 2032
10.6.7.1.5 Virtual Studio Market Size & Forecast, By Deployment, 2021 – 2032
10.6.7.2 Saudi Arabia
10.6.7.2.1 Virtual Studio Market Size & Forecast, By Component, 2021 – 2032
10.6.7.2.2 Virtual Studio Market Size & Forecast, By Application, 2021 – 2032
10.6.7.2.3 Virtual Studio Market Size & Forecast, By Enterprise Size, 2021 – 2032
10.6.7.2.4 Virtual Studio Market Size & Forecast, By End Use, 2021 – 2032
10.6.7.2.5 Virtual Studio Market Size & Forecast, By Deployment, 2021 – 2032
10.6.7.3 Qatar
10.6.7.3.1 Virtual Studio Market Size & Forecast, By Component, 2021 – 2032
10.6.7.3.2 Virtual Studio Market Size & Forecast, By Application, 2021 – 2032
10.6.7.3.3 Virtual Studio Market Size & Forecast, By Enterprise Size, 2021 – 2032
10.6.7.3.4 Virtual Studio Market Size & Forecast, By End Use, 2021 – 2032
10.6.7.3.5 Virtual Studio Market Size & Forecast, By Deployment, 2021 – 2032
10.6.7.4 Egypt
10.6.7.4.1 Virtual Studio Market Size & Forecast, By Component, 2021 – 2032
10.6.7.4.2 Virtual Studio Market Size & Forecast, By Application, 2021 – 2032
10.6.7.4.3 Virtual Studio Market Size & Forecast, By Enterprise Size, 2021 – 2032
10.6.7.4.4 Virtual Studio Market Size & Forecast, By End Use, 2021 – 2032
10.6.7.4.5 Virtual Studio Market Size & Forecast, By Deployment, 2021 – 2032
10.6.7.5 South Africa
10.6.7.5.1 Virtual Studio Market Size & Forecast, By Component, 2021 – 2032
10.6.7.5.2 Virtual Studio Market Size & Forecast, By Application, 2021 – 2032
10.6.7.5.3 Virtual Studio Market Size & Forecast, By Enterprise Size, 2021 – 2032
10.6.7.5.4 Virtual Studio Market Size & Forecast, By End Use, 2021 – 2032
10.6.7.5.5 Virtual Studio Market Size & Forecast, By Deployment, 2021 – 2032
10.6.7.6 Rest of Middle East & Africa
10.6.7.6.1 Virtual Studio Market Size & Forecast, By Component, 2021 – 2032
10.6.7.6.2 Virtual Studio Market Size & Forecast, By Application, 2021 – 2032
10.6.7.6.3 Virtual Studio Market Size & Forecast, By Enterprise Size, 2021 – 2032
10.6.7.6.4 Virtual Studio Market Size & Forecast, By End Use, 2021 – 2032
10.6.7.6.5 Virtual Studio Market Size & Forecast, By Deployment, 2021 – 2032
11. Competitive Landscape
11.1 Key Players' Positioning
11.2 Competitive Developments
11.2.1 Key Strategies Adopted (%), By Key Players, 2024
11.2.2 Year-Wise Strategies & Development, 2021 – 2025
11.2.3 Number Of Strategies Adopted By Key Players, 2024
11.3 Market Share Analysis, 2024
11.4 Product/Service & Application Benchmarking
11.4.1 Product/Service Specifications & Features By Key Players
11.4.2 Product/Service Heatmap By Key Players
11.4.3 Application Heatmap By Key Players
11.5 Industry Start-Up & Innovation Landscape
11.6 Key Company Profiles
11.6.1 Adobe Inc.
11.6.1.1 Company Overview & Snapshot
11.6.1.2 Product/Service Portfolio
11.6.1.3 Key Company Financials
11.6.1.4 SWOT Analysis
11.6.2 Autodesk, Inc.
11.6.2.1 Company Overview & Snapshot
11.6.2.2 Product/Service Portfolio
11.6.2.3 Key Company Financials
11.6.2.4 SWOT Analysis
11.6.3 Avid Technology, Inc.
11.6.3.1 Company Overview & Snapshot
11.6.3.2 Product/Service Portfolio
11.6.3.3 Key Company Financials
11.6.3.4 SWOT Analysis
11.6.4 Blackmagic Design Pty Ltd
11.6.4.1 Company Overview & Snapshot
11.6.4.2 Product/Service Portfolio
11.6.4.3 Key Company Financials
11.6.4.4 SWOT Analysis
11.6.5 Chaos Group Ltd.
11.6.5.1 Company Overview & Snapshot
11.6.5.2 Product/Service Portfolio
11.6.5.3 Key Company Financials
11.6.5.4 SWOT Analysis
11.6.6 Emerson Electric Co.
11.6.6.1 Company Overview & Snapshot
11.6.6.2 Product/Service Portfolio
11.6.6.3 Key Company Financials
11.6.6.4 SWOT Analysis
11.6.7 Epic Games, Inc.
11.6.7.1 Company Overview & Snapshot
11.6.7.2 Product/Service Portfolio
11.6.7.3 Key Company Financials
11.6.7.4 SWOT Analysis
11.6.8 Foundry Visionmongers Ltd.
11.6.8.1 Company Overview & Snapshot
11.6.8.2 Product/Service Portfolio
11.6.8.3 Key Company Financials
11.6.8.4 SWOT Analysis
11.6.9 Harmonic Inc.
11.6.9.1 Company Overview & Snapshot
11.6.9.2 Product/Service Portfolio
11.6.9.3 Key Company Financials
11.6.9.4 SWOT Analysis
11.6.10 Luxion, Inc.
11.6.10.1 Company Overview & Snapshot
11.6.10.2 Product/Service Portfolio
11.6.10.3 Key Company Financials
11.6.10.4 SWOT Analysis
11.6.11 Maxon Computer GmbH
11.6.11.1 Company Overview & Snapshot
11.6.11.2 Product/Service Portfolio
11.6.11.3 Key Company Financials
11.6.11.4 SWOT Analysis
11.6.12 Microsoft Corporation
11.6.12.1 Company Overview & Snapshot
11.6.12.2 Product/Service Portfolio
11.6.12.3 Key Company Financials
11.6.12.4 SWOT Analysis
11.6.13 Monarch Innovative Technologies Pvt. Ltd.
11.6.13.1 Company Overview & Snapshot
11.6.13.2 Product/Service Portfolio
11.6.13.3 Key Company Financials
11.6.13.4 SWOT Analysis
11.6.14 Nippon Control System Corporation
11.6.14.1 Company Overview & Snapshot
11.6.14.2 Product/Service Portfolio
11.6.14.3 Key Company Financials
11.6.14.4 SWOT Analysis
11.6.15 OTOY Inc.
11.6.15.1 Company Overview & Snapshot
11.6.15.2 Product/Service Portfolio
11.6.15.3 Key Company Financials
11.6.15.4 SWOT Analysis
11.6.16 PreSonus Audio Electronics, Inc.
11.6.16.1 Company Overview & Snapshot
11.6.16.2 Product/Service Portfolio
11.6.16.3 Key Company Financials
11.6.16.4 SWOT Analysis
11.6.17 SideFX Software Inc.
11.6.17.1 Company Overview & Snapshot
11.6.17.2 Product/Service Portfolio
11.6.17.3 Key Company Financials
11.6.17.4 SWOT Analysis
11.6.18 Unity Technologies
11.6.18.1 Company Overview & Snapshot
11.6.18.2 Product/Service Portfolio
11.6.18.3 Key Company Financials
11.6.18.4 SWOT Analysis
11.6.19 Vizrt Group
11.6.19.1 Company Overview & Snapshot
11.6.19.2 Product/Service Portfolio
11.6.19.3 Key Company Financials
11.6.19.4 SWOT Analysis
11.6.20 Pixotope Technologies AS
11.6.20.1 Company Overview & Snapshot
11.6.20.2 Product/Service Portfolio
11.6.20.3 Key Company Financials
11.6.20.4 SWOT Analysis
12. Analyst Recommendations
12.1 SNS Insider Opportunity Map
12.2 Industry Low-Hanging Fruit Assessment
12.3 Market Entry & Growth Strategy
12.4 Analyst Viewpoint & Suggestions On Market Growth
13. Assumptions
14. Disclaimer
15. Appendix
15.1 List Of Tables
15.2 List Of Figure
Key Segments:
By Component
-
-
Software
-
Services
-
By Deployment
-
-
On-Premises
-
Cloud-based
-
By Enterprise Size
-
-
SMEs
-
Large Enterprise
-
By Application
-
-
Virtual Sets and Environments
-
Motion Capture and Tracking
-
Rendering and Animation
-
Live Streaming and Broadcasting
-
Post-Production Editing
-
By End Use
-
-
Movies
-
TV Shows
-
Commercial Ads
-
Online Videos
-
Others
-
Request for Segment Customization as per your Business Requirement: Segment Customization Request
Regional Coverage:
North America
-
US
-
Canada
Europe
-
Germany
-
France
-
UK
-
Italy
-
Spain
-
Poland
-
Russia
-
Rest of Europe
Asia Pacific
-
China
-
India
-
Japan
-
South Korea
-
Australia
-
ASEAN Countries
-
Rest of Asia Pacific
Middle East & Africa
-
UAE
-
Saudi Arabia
-
Qatar
-
South Africa
-
Rest of Middle East & Africa
Latin America
-
Brazil
-
Argentina
-
Mexico
-
Colombia
-
Rest of Latin America
Request for Country Level Research Report: Country Level Customization Request
Available Customization
With the given market data, SNS Insider offers customization as per the company’s specific needs. The following customization options are available for the report:
-
Detailed Volume Analysis
-
Criss-Cross segment analysis (e.g. Product X Application)
-
Competitive Product Benchmarking
-
Geographic Analysis
-
Additional countries in any of the regions
-
Customized Data Representation
-
Detailed analysis and profiling of additional market players
An accurate research report requires proper strategizing as well as implementation. There are multiple factors involved in the completion of good and accurate research report and selecting the best methodology to compete the research is the toughest part. Since the research reports we provide play a crucial role in any company’s decision-making process, therefore we at SNS Insider always believe that we should choose the best method which gives us results closer to reality. This allows us to reach at a stage wherein we can provide our clients best and accurate investment to output ratio.
Each report that we prepare takes a timeframe of 350-400 business hours for production. Starting from the selection of titles through a couple of in-depth brain storming session to the final QC process before uploading our titles on our website we dedicate around 350 working hours. The titles are selected based on their current market cap and the foreseen CAGR and growth.
The 5 steps process:
Step 1: Secondary Research:
Secondary Research or Desk Research is as the name suggests is a research process wherein, we collect data through the readily available information. In this process we use various paid and unpaid databases which our team has access to and gather data through the same. This includes examining of listed companies’ annual reports, Journals, SEC filling etc. Apart from this our team has access to various associations across the globe across different industries. Lastly, we have exchange relationships with various university as well as individual libraries.

Step 2: Primary Research
When we talk about primary research, it is a type of study in which the researchers collect relevant data samples directly, rather than relying on previously collected data. This type of research is focused on gaining content specific facts that can be sued to solve specific problems. Since the collected data is fresh and first hand therefore it makes the study more accurate and genuine.
We at SNS Insider have divided Primary Research into 2 parts.
Part 1 wherein we interview the KOLs of major players as well as the upcoming ones across various geographic regions. This allows us to have their view over the market scenario and acts as an important tool to come closer to the accurate market numbers. As many as 45 paid and unpaid primary interviews are taken from both the demand and supply side of the industry to make sure we land at an accurate judgement and analysis of the market.
This step involves the triangulation of data wherein our team analyses the interview transcripts, online survey responses and observation of on filed participants. The below mentioned chart should give a better understanding of the part 1 of the primary interview.

Part 2: In this part of primary research the data collected via secondary research and the part 1 of the primary research is validated with the interviews from individual consultants and subject matter experts.
Consultants are those set of people who have at least 12 years of experience and expertise within the industry whereas Subject Matter Experts are those with at least 15 years of experience behind their back within the same space. The data with the help of two main processes i.e., FGDs (Focused Group Discussions) and IDs (Individual Discussions). This gives us a 3rd party nonbiased primary view of the market scenario making it a more dependable one while collation of the data pointers.
Step 3: Data Bank Validation
Once all the information is collected via primary and secondary sources, we run that information for data validation. At our intelligence centre our research heads track a lot of information related to the market which includes the quarterly reports, the daily stock prices, and other relevant information. Our data bank server gets updated every fortnight and that is how the information which we collected using our primary and secondary information is revalidated in real time.

Step 4: QA/QC Process
After all the data collection and validation our team does a final level of quality check and quality assurance to get rid of any unwanted or undesired mistakes. This might include but not limited to getting rid of the any typos, duplication of numbers or missing of any important information. The people involved in this process include technical content writers, research heads and graphics people. Once this process is completed the title gets uploader on our platform for our clients to read it.
Step 5: Final QC/QA Process:
This is the last process and comes when the client has ordered the study. In this process a final QA/QC is done before the study is emailed to the client. Since we believe in giving our clients a good experience of our research studies, therefore, to make sure that we do not lack at our end in any way humanly possible we do a final round of quality check and then dispatch the study to the client.