Carbon Dioxide Utilization Market Report Scope and Overview:
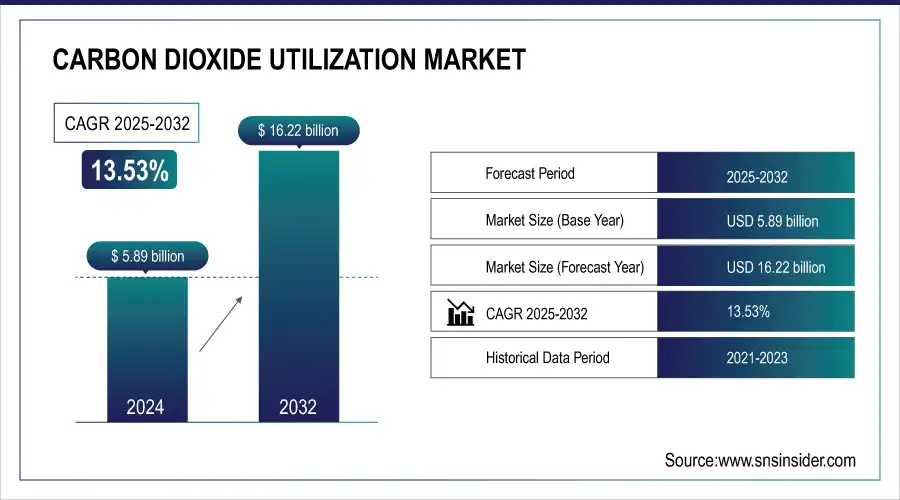
The Carbon Dioxide Utilization Market size was valued at USD 6.69 Billion in 2025E and is projected to reach USD 18.45 Billion by 2033, at 13.53% CAGR from 2026-2033.
Carbon Dioxide Utilization market growth is driven by the goals of decarbonization, growing investments for CO₂-to-fuels and chemicals market, standards and regulations supporting these technologies, and the need for industrial scale. Integration with emerging technologies and circular economy is accelerating adoption around the world in power, cement, and chemical sectors.
To Get more information On Carbon Dioxide Utilization Market - Request Free Sample Report
Carbon monetization, which is the process of converting captured CO₂ into value-added products that can include plastics, polymers, construction materials, and other types of compounds or materials to use as building blocks, is a major growth driver for the Carbon Dioxide Utilization (CDU) market. Recent advances in catalytic and enzymatic conversion are improving efficiency and lowering processing costs, therefore increasing CDU commercial viability. ECU technologies are being adopted by enterprises due to a green manufacturing trend and pressures from ESG investors. In particular, increasingly competitive decentralized CO₂ capture units to be coupled with renewable energy systems provide new revenue opportunities throughout the evolving economies.
Mission Zero Technologies launched a pilot in Norfolk (May 2025) capturing 250 t CO₂/year, converting it into limestone aggregate for concrete and asphalt scalable with reductions in capital cost estimated at two‑thirds lower by the third facility
Carbon Dioxide Utilization Market Size and Forecast:
-
Market Size in 2025E: USD 6.69 Billion
-
Market Size by 2033: USD 18.45 Billion
-
CAGR: 13.53% from 2026 to 2033
-
Base Year: 2025E
-
Forecast Period: 2026–2033
-
Historical Data: 2022–2024
Carbon Dioxide Utilization Market Highlights:
-
According to the International Energy Agency (IEA), global CCUS facilities currently capture more than 50 million tonnes (Mt) of CO₂ annually, with around 45 commercial capture facilities in operation worldwide as of early 2025.
-
IEA data shows that capture and utilisation projects are expanding globally, with CCUS projects now being developed in more than 50 countries, reflecting increasing government engagement and policy support.
-
In its Sustainable Development Scenario, the IEA projects that by 2030, total CO₂ captured could reach around 430–840 Mt per year, highlighting the growing role of CO₂ utilisation in future low‑carbon pathways.
-
Government policies are actively supporting CO₂ utilisation pathways; for example, the U.S. Inflation Reduction Act (IRA) provides federal tax credits under Section 45Q, valuing approximately USD 60 per tonne of CO₂ utilised, promoting investment in synthetic fuels, chemicals, and other utilisation projects.
-
European Union frameworks, including ReFuelEU Aviation and the EU Innovation Fund, are mandating and funding large‑scale CCU projects, such as synthetic fuel production and CO₂‑derived sustainable aviation fuels.
-
Overall, government regulations and climate targets are driving the adoption of CO₂ utilisation technologies, encouraging integration across industrial, chemical, and energy sectors worldwide.
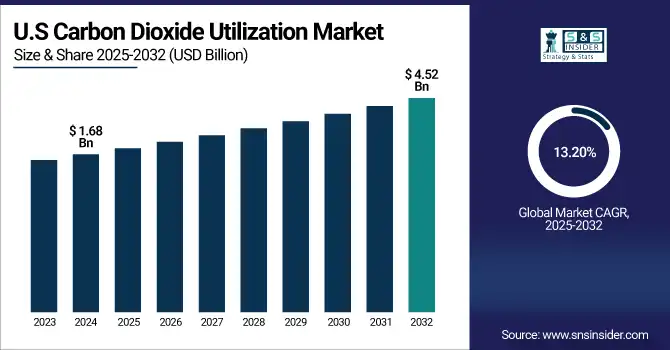
The U.S. Carbon Dioxide Utilization Market size was valued at USD 1.90 billion in 2025E and is projected to grow at a CAGR of 13.20%, reaching USD 5.13 billion by 2033. The U.S. carbon dioxide (CO₂) utilization market is being driven by robust federal incentives, regulation-driven industrial decarbonization, increased investment in clean technologies, and new markets in traditional areas of CO₂ utilization (fuels and chemicals) as well as sustainable construction materials.
Carbon Dioxide Utilization Market Drivers:
-
Driving Net Zero Carbon Dioxide Utilization Gains Momentum Across Cement Steel Oil Gas and Chemical Sectors
The global Carbon Dioxide Utilization market trends is largely driven by the imperative of mitigating and eliminating greenhouse gas emissions contributing to net-zero targets". The penetration of CO₂ utilization technologies has been greatly accelerated by various government policies including carbon pricing, as well as tax credits like the U.S. 45Q credit. This is driving technical maturity in catalytic, biological, and electrochemical conversion processes to enhance the commercial appeal of CDU across sectors. Due to the integration of ESG commitments and circular economy principles, the sectors of cement, steel, oil & gas, and chemicals have been keen to develop products based on CO₂.
-
A U.S. Senate panel proposed raising the 45Q tax credit for CO₂ use in EOR to USD 85/ton, matching sequestration credits intended to support oil & gas companies and drive CO₂ utilization projects
Carbon Dioxide Utilization Market Restraints:
-
Infrastructure Gaps and Policy Uncertainty Limit Scalable Growth of Global Carbon Dioxide Utilization Market
Lack of a common infrastructural set-up for the carbon to be captured, transported and further utilized, is one of the major restraints in the global Carbon Dioxide Utilization market. Scalability is hindered by the fragmented availability of CO₂ sources and by missing integrated supply chains, in particular for applications demanding pure or concentrated CO₂ streams. Regulatory uncertainty in certain regions also contributes to a delay in investment in long-term CDU projects, since there is often quite limited government policy or market incentive promoting the case for use over sequestration.
Carbon Dioxide Utilization Market Opportunities:
-
Emerging Economies Unlock Green Growth Through Decentralized Carbon Conversion and Renewable Powered Industrial Innovation
Green growth potential for emerging economies balancing their emission control and industrialization task. Converting this CO₂ from the air via decentralized CO₂ capture units located near renewable sources (solar, wind, etc.) into fuels and materials at the source would open up new streams of revenue. In addition, the technological advancement of CO₂-to-chemicals and fuels, and production of concrete additives offers new prospects for high-added-value product development, in particular as applied to synthetic fuels and green construction solutions.
-
India’s CO₂-to-methanol pilot plant (2024) converts 1.4 tons of CO₂ daily into 0.65 tons of methanol using thermal plant flue gases.
Carbon Dioxide Utilization Market Segment Analysis:
By Technology
Pre-Combustion Capture led the global Carbon Dioxide Utilization market with a 52.8% share in 2025E. The leadership is directly tied to a higher (typically >90%) CO₂ removal efficiency, and its integration in coal gasification and/or hydrogen production facilities. Large-scale industrial plants and power stations, especially those with integrated gasification combined cycle (IGCC) technology, generally lend themselves to the pre-combustion system. This capability enables CO₂ separation prior to combustion, which facilitates pressurization of the CO₂ and transport via pipeline to downstream utilization applications such as fuel synthesis and other chemical production.
Oxy-Fuel Combustion Capture, it is expected to achieve the fastest CAGR between 2026 to 2033 This technology combusts fuel with pure oxygen rather than air, so the resulting flue gas is primarily made up of water vapour and CO₂, which makes, CO₂ capture easier less complicated. Improvements in the cost effectiveness and scalability of air separation units and heat recovery systems have made it suitable for retrofitting existing plants and scaling up in areas where clean energy transitions can happen.
By Application
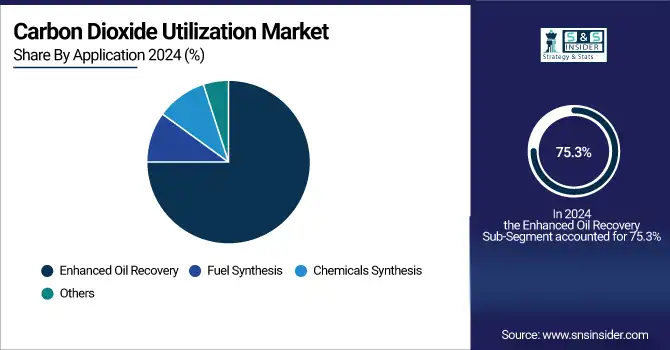
In 2025E, EOR was the most used CDU technology, accounting for 75.3% of the share within the Carbon Dioxide Utilization (CDU) market. This predominance is attributable to the mass application of CO₂-EOR processes in mature oil fields, particularly in North America and the Middle East. In such operations, CO₂ is captured and injected into oil wells to relieve pressure and facilitate the flow of oil, stretching the productive life of fields.
Fuel Synthesis is expected to grow at the fastest compound annual growth rate, from 2026 to 2033. The development of this is fuelled by the rising adoption of green fuels such as synthetic methane, methanol and liquid hydrocarbons produced from captured CO₂ and renewable hydrogen. The increasing adoption of these fuels can be attributed to stringent emissions regulations, the continued emphasis on sustainable aviation fuel (SAF) and the need for circular carbon economies among multiple other reasons.
By End-Use
In 2025E, the Oil & Gas sector had the largest market in the Carbon Dioxide Utilization market share, accounting for 64.2% of the total market. This is primarily thanks to the widespread use of CO₂ for Enhanced Oil Recovery (EOR) activities, where it is pumped into depleted oil fields to recover more crude oil. Infrastructure such as pipelines and injection wells are already needed to move and store the CO₂, so the sector stands to gain too. On top of this, many oil and gas companies are investing in technologies that help manage CO₂ as part of their decarbonization plan to offset emissions by using CO₂ and promote sustainability in operations.
During 2026 to 2033, the fastest growing sector in terms of CDU is expected to be Cement. Direct transport and use of the non-polluting CO₂ effluent from cement production in construction has been shown as commercially promising through the use of concrete additives, carbon-cured concrete and alternative binders to the dominant of cement. There also has been a respectable push for new technologies that mineralize CO₂ directly into products from cement, and these technologies are emerging, spurring rapid innovation and uptake in the sector.
Carbon Dioxide Utilization Market Regional Analysis:
North America Carbon Dioxide Utilization Market Trends:
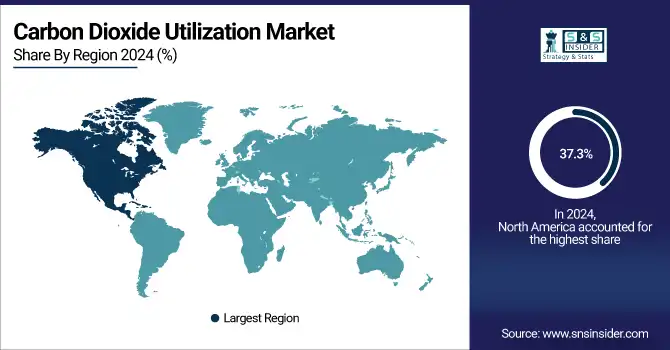
North America held 37.3% share of the global Carbon Dioxide Utilization market in 2025E, driven by robust regulatory frameworks, key investment in carbon capture technologies, and high levels of direct investment from industry. There is a long history of establishing hydrogen demand and carbon capture, transport, and use infrastructure in terms of oil & gas, chemicals, and power generation in the region. Some pilot-scale demonstration projects have been deployed, but financial incentives such as tax credits for carbon sequestration and utilization have expedited deployment across both large-scale industrial plants and pilot-scale demonstration projects. Moreover, continuous research and development and partnerships between public and private actors have allowed for CO₂-to-fuel, chemicals, and concrete applications to progress, making the region a leader in sustainable carbon management and innovations in circular carbon economy approaches.
Get Customized Report as per Your Business Requirement - Enquiry Now
Strong carbon policies, established infrastructure, significant carbon capture and utilization investment,and deployments in both oil recovery and industrial decarbonization projects enabled the U.S. to lead in North America.
Asia-Pacific Carbon Dioxide Utilization Market Trends:
Asia Pacific is estimated to grow with the speedy CAGR of 14.1% during 2026–2033 in the Carbon Dioxide Utilization market owing to swift industrialization, rising rate of CO2 emission, and diligent policy support for decarbonization. Supportive government policy and increasing investments from all sectors over recent years are bringing more CO₂-to-fuel and CO₂-to-chemicals projects to the forefront across the region. Fuel gas consumption for power generation, cement, and petrochemical expansion is also heightening demand for CO₂ use. Furthermore, with an increasing focus on carbon neutrality objectives, renewable integration, and novel clean hydrogen projects in the region are promoting the need for CDU technologies in major economies.
By virtue of its huge industrial base, highest CO₂ emissions, favorable government policies along with investments in carbon capture/utilization and green hydrogen technologies and wide sense of acceptance, the Asia Pacific CDU market was primarily overwhelmed by China.
Europe Carbon Dioxide Utilization Market Trends:
Due to stringent environmental regulations, net-zero objectives, and EU Green Deal programs, Europe serves as one of the prominent regions in the Carbon Dioxide Utilization market. This region is scaling CO₂-to-chemicals, fuels, and building materials driven by a combination of public funding, carbon pricing, and innovation programs such as Horizon Europe. CDU technologies are being adopted to decarbonize operations across major industries, cement, steel, and chemicals. Cement, steel, and chemical industries are areas where efficient reuse of unpredictable abundant emissions are being tackled, for the greater goal of sustainable CO₂ markets for global industrial clusters and carbon capture hubs lighthouse strategic collaborations across governments, research, and private sectors are already ongoing, in order to accelerate deployment of sustainable CO₂ solutions.
Latin America and Middle East & Africa Carbon Dioxide Utilization Market Trends:
Latin America and the Middle East & Africa (MEA) are the two developing regions in the Carbon Dioxide Utilization market, over the past couple of years, these two regions are showing increasing interest in carbon dioxides utilization given the level of industrialization and climate commitment, but their penetration level is not significant yet. The region is not missing out: Latin America also plays on its potential for renewable energy to fuel CO₂-to-fuel and chemical projects. Middle East and Africa (MEA)Investment in CO₂ utilization is high in oil-rich nations, especially for Enhanced Oil Recovery (EOR) and for cement production.
Carbon Dioxide Utilization Market Competitive Landscape:
Climeworks, established in 2009 in Switzerland, is a pioneer in direct air capture (DAC) technology. The company develops modular systems that remove CO₂ from the atmosphere for storage or utilization in products like fuels and beverages. Climeworks’ solutions contribute to scalable carbon removal and climate change mitigation.
-
In May 2025, Swiss air-capture pioneer Climeworks announced a workforce reduction exceeding 10%, citing economic challenges and slower momentum in climate tech; the move followed reports that its flagship DAC plants in Iceland underperformed against expectations.
LanzaTech, established in 2005, is a global leader in carbon recycling and sustainable fuels. The company specializes in converting industrial waste gases and captured CO₂ into ethanol, chemicals, and sustainable aviation fuels using proprietary gas fermentation technology. LanzaTech’s solutions reduce greenhouse gas emissions while creating circular carbon economies.
-
In October 2024, LanzaTech announced expansion of biorefinery capabilities to produce nutritional protein directly from CO₂ via gas fermentation.
Carbon Dioxide Utilization Market Key Players:
-
Carbon Clean
-
LanzaTech
-
CarbonCure Technologies
-
Climeworks
-
Global Thermostat
-
Blue Planet Ltd.
-
Solidia Technologies
-
Twelve (formerly Opus 12)
-
Carbon Recycling International (CRI)
-
SkyNRG
-
Newlight Technologies
-
Carbon Upcycling Technologies
-
Svante
-
Skyonic / CarbonFree Chemicals
-
Econic Technologies
-
Liquid Wind
-
Prometheus Fuels
-
Air Liquide S.A.
-
BASF SE
-
TotalEnergies SE
| Report Attributes | Details |
|---|---|
| Market Size in 2025E | USD 16.87 Billion |
| Market Size by 2033 | USD 38.25 Billion |
| CAGR | CAGR of 10.78% From 2026 to 2033 |
| Base Year | 2025E |
| Forecast Period | 2026-2033 |
| Historical Data | 2022-2024 |
| Report Scope & Coverage | Market Size, Segments Analysis, Competitive Landscape, Regional Analysis, DROC & SWOT Analysis, Forecast Outlook |
| Key Segments | • By Sensor Type(2D sensors, 3D sensors, Multispectral sensors, Near-Infrared (NIR) sensors) • By Device Type(Camera modules, Night vision devices, Thermal imagers and Image intensifiers) • By Technology(CMOS (Complementary Metal-Oxide-Semiconductor), CCD (Charge-Coupled Device), sCMOS (Scientific CMOS), EMCCD (Electron Multiplying CCD), Infrared imaging and Thermal imaging) • By End Use(Surveillance & security, Automotive, Consumer electronics, Medical imaging, Industrial, Military & defense and Others) |
| Regional Analysis/Coverage | North America (US, Canada), Europe (Germany, UK, France, Italy, Spain, Russia, Poland, Rest of Europe), Asia Pacific (China, India, Japan, South Korea, Australia, ASEAN Countries, Rest of Asia Pacific), Middle East & Africa (UAE, Saudi Arabia, Qatar, South Africa, Rest of Middle East & Africa), Latin America (Brazil, Argentina, Mexico, Colombia, Rest of Latin America). |
| Company Profiles | Sony Corporation; Samsung Electronics Co., Ltd.; OmniVision Technologies, Inc.; ON Semiconductor Corporation; STMicroelectronics N.V.; Panasonic Holdings Corporation; Canon Inc.; PixArt Imaging Inc.; Hamamatsu Photonics K.K.; ams OSRAM AG; Tower Semiconductor Ltd.; SK hynix Inc.; GalaxyCore Inc.; Himax Technologies, Inc.; Sharp Corporation; Toshiba Corporation; Infineon Technologies AG; Rohm Semiconductor; iC-Haus GmbH; Teledyne e2v |
Frequently Asked Questions
North America dominated the Carbon Dioxide Utilization Market in 2025.
The Pre-Combustion Capture segment dominated the Carbon Dioxide Utilization Market in 2025.
The major growth factor of the Carbon Dioxide Utilization market is the increasing focus on carbon neutrality and circular carbon economy, driven by stringent climate regulations and sustainability initiatives across industries.
The Carbon Dioxide Utilization Market size was valued at USD 6.69 Billion in 2025E and is projected to reach USD 18.45 Billion by 2033, at 13.53% CAGR from 2026-2033.
The Carbon Dioxide Utilization Market is expected to grow at a CAGR of 13.53% from 2026-2033.
Get in Touch
