image

Carbon Footprint Management Market Report Scope & Overview:

The Carbon Footprint Management Market Size was valued at USD 12.02 Billion in 2023 and is expected to reach USD 54.62 Billion by 2031 and grow at a CAGR of 20.8 % over the forecast period 2024-2031.

The global Carbon Footprint Management Market is driven by Increasing energy demand in industries, the implementation of COP27 (United Nations Climate Change Conference or Conference of the Parties of the UNFCCC) targets for reducing global warming, and increased government initiatives to reduce carbon emissions. Growing concerns about climate change, weather anomalies, and global warming, along with technological advancements and R&D activities, helps to market growth. Industry adoption of sustainable energy solutions and government policies for low-carbon initiatives helps to drive the market. high installation and maintenance costs may be challenges. Major companies are adopting carbon footprint management technology, is drive demand for carbon footprint management.

Carbon Footprint Management Market Revenue Analysis

Get More Information on Carbon Footprint Management Market - Request Sample Report

Market Dynamics

Drivers:

  • Increasing government regulations and policies for reducing carbon emissions.

  • Increasing awareness among businesses about the importance of sustainability and corporate social responsibility (CSR).

  • The technological Advancements, such as IoT, big data analytics, and AI (artificial intelligence), are providing innovative solutions for monitoring and managing carbon emissions.

  • Companies who effectively manage their carbon footprints gain a competitive edge by attracting environmentally conscious investors, partners, and customers.

The Government regulations and policies focused on reducing carbon emissions are drivers for the Carbon Footprint Management market. These regulations help businesses to adopt strategies for managing their carbon footprints more effectively. Governments worldwide implement stricter measures to combat climate change, organizations are compelled to invest in carbon footprint management solutions to ensure compliance and reduce environmental impact. This trend is driving the growth of the market as businesses are looking for ways to align with regulatory requirements and demonstrate their commitment to sustainability.

Restraints:

  • Implementing carbon footprint management solutions often requires significant initial investments in technology, infrastructure, and training.

  • Managing carbon footprints involves dealing with complex data sets, regulatory requirements, and supply chain challenges.

  • Companies with global supply chains may face difficulties in accurately measuring and managing their carbon footprints across diverse geographic locations and regulatory environments.

Implementing carbon footprint management solutions requires high investments in technology, infrastructure, and training. Companies need to acquire and deploy sophisticated tools for data collection, analysis, and reporting, which can be costly. infrastructure upgrades may be necessary to support these solutions effectively. Training programs are essential to ensure employees understand how to use the new technology and comply with carbon footprint management practices. The initial financial commitment, these investments are crucial for businesses aiming to reduce their environmental impact and meet regulatory requirements effectively.

Opportunities:

  • The Consistently Increasing demand for green technologies Creates opportunities for companies offering carbon footprint management solutions.

  • Collaborating with industry partners, technology providers, and sustainability experts can create opportunities for developing comprehensive carbon management strategies and innovative solutions.

  • Because of the increasing environmental regulations and sustainability initiatives In Asia-Pacific and Latin America, creates significant growth opportunities for carbon footprint management.

  • The Growing of green financing and investments in sustainable projects creates opportunities for organizations to secure funding for carbon reduction initiatives.

Challenges:

  • The accuracy and reliability of data related to carbon emissions can be challenging, especially for organizations with complex supply chains and operational processes.

  • Integrating carbon footprint management into existing business processes and systems without disrupting operations or increasing administrative burdens can be a challenge for organizations.

  • There is a lack of customized solutions to meet distinct environmental issues.

Impact of Russia-Ukraine War:

The ongoing conflict between Russia and Ukraine has had a significant impact on the Carbon Footprint Management Market, affecting both environmental factors and market dynamics. On The environmental standpoint, the war has increased the considerable carbon emissions. Estimates that approximately 100 million tons of carbon dioxide were released within the first seven months of the conflict, equivalent to the annual emissions of countries such as the Netherlands. This pollution is not only from direct military activities but also from untamed fires and methane leaks resulting from damaged infrastructure. the reconstruction efforts in Ukraine following the war's devastation contribute to carbon emissions, also present an opportunity to adopt low or negative carbon construction technologies, potentially positioning Ukraine as a leader in energy efficiency within Europe. On the market dynamics, the Carbon Footprint Management Market is influenced by stringent emission regulations, corporate sustainability goals, and the growing adoption of carbon management solutions across various industries. The challenges such as the significant initial capital required for implementing these systems and concerns about data security in cloud-based solutions persist. The Russia-Ukraine conflict has introduced new complexities to these dynamics, impacting market trends and potentially accelerating advancements in carbon reduction technologies, as well as driving increased investments in the energy and utility sectors.

Impact of Economic Downturn:

An economic slowdown can have effects on the Carbon Footprint Management Market some of the Negative Effects such as, during economic slowdowns, companies may postpone or cut back on investments in new technologies and infrastructure upgrades that could enhance their carbon footprint due to the high initial costs involved. Businesses may prioritize short-term cost-cutting measures over sustainability initiatives during economic downturns, leading to a decline in demand for carbon footprint management services.

Some Positive Effects such as the Companies may shift their focus towards improving efficiency to cut costs during economic slowdowns, which can indirectly contribute to reducing energy consumption and waste, thereby improving their carbon footprint. Governments might introduce stimulus packages that prioritize environmental initiatives, potentially boosting the Carbon Footprint Management Market.

Market Segmentation

By Component

  • Solutions

  • Services

    • Consulting

    • Integration & Deployment

    • Support & Maintenance

By Deployment Mode

  • Cloud

  • On-premises

On the basis of Deployment Mode, the cloud segment holds revenue share of more than 53.60% revenue share in the global carbon footprint market, driven by its benefits such as accessibility, scalability, and cost-effectiveness. Cloud solutions offer remote access to real-time environmental data, leading to widespread adoption across industries. On-premises segment expected to grow with the fastest CAGR during Forecast periods.

Carbon-Footprint-Management-Market-Trend-By-deployment-Mode

By Organization Size

  • Corporates/Enterprises

  • Mid-Tier Enterprises

  • Small Businesses

By Vertical

  • Manufacturing

    • Food & Beverages

    • Metals & Mining

    • Chemical & Materials

    • Electronics & Consumer Goods

    • Automotive

    • Pharmaceutical & Healthcare

    • Others

  • Energy and Utilities

  • Residential and Commercial Buildings

  • Transportation and Logistics

  • IT and Telecom

  • Financial Servies

  • Government

On the basis of verticals, the manufacturing sector is dominant the carbon footprint management market with holding revenue share of more than 38%. because of the manufacturing is a major source of carbon emissions globally. While some companies acknowledge and address these emissions, many are still seeking ways to reduce them. The adoption of low-carbon practices in manufacturing is not just about environmental benefits but also about mitigating risks like regulatory, competitive, litigation, reputation, and brand value risks. The iron and steel industry contributed 7% of industrial CO2 emissions, as reported by the IEA and UNIDO.

Carbon-Footprint-Management-Market-Trend-By-Vertical

Get Customized Report as per Your Business Requirement - Request For Customized Report

Regional Analysis

North America Region Dominates the global Carbon Footprint Management Market with holding Revenue share of More than 42%, due to its significant greenhouse gas emissions, driven by increasing climate change concerns and regulatory efforts in the U.S. and Canada. Initiatives such as the EPA's ACE Rule contribute to the region's growing carbon footprint management market. In Asia-Pacific, rapid industrialization and urbanization create opportunities, especially with emerging economies contributing to air quality regulations. China's emissions trading program and India's carbon reduction goals under the Paris Agreement drive market expansion. Europe benefits from stringent environmental regulations, while Latin America and the Middle East & Africa show steady growth due to climate change challenges.

Carbon-Footprint-Management-Market-Share-Regional-Analysis

REGIONAL COVERAGE:

North America

  • US

  • Canada

  • Mexico

Europe

  • Eastern Europe

    • Poland

    • Romania

    • Hungary

    • Turkey

    • Rest of Eastern Europe

  • Western Europe

    • Germany

    • France

    • UK

    • Italy

    • Spain

    • Netherlands

    • Switzerland

    • Austria

    • Rest of Western Europe

Asia Pacific

  • China

  • India

  • Japan

  • South Korea

  • Vietnam

  • Singapore

  • Australia

  • Rest of Asia Pacific

Middle East & Africa

  • Middle East

    • UAE

    • Egypt

    • Saudi Arabia

    • Qatar

    • Rest of the Middle East

  • Africa

    • Nigeria

    • South Africa

    • Rest of Africa

Latin America

  • Brazil

  • Argentina

  • Colombia

  • Rest of Latin America

Key Players

The major key players are Carbon Footprint LtdDakota Software Corporation, ENGIE, IsoMetrix, IBM corporation, Process MAP, Schneider Electric, SAP, Wolters Kluwer N.V. , Carbon Trust and other players mentioned in the final report.

Schneider Electric - Company Financial Analysis

Company Landscape Analysis

Recent Development:

In February 2023, Enablon and Maker site announced a strategic collaboration aimed at assisting enterprises in achieving their ESG goals. These two industry leaders will work together to help organizations manage their Net Zero ambitions by decarbonizing their supply chains. This process involves various tasks such as data collection, modeling, reporting, planning, forecasting, and operational execution across all three Scopes of greenhouse gas (GHG) emissions.

In September 2023, EcoVadis announced the launch of a carbon emission tracking solution designed to help companies monitor their greenhouse gas emissions. This innovative tool is intended to assist businesses in implementing effective carbon reduction strategies and improving emissions reporting for their products and services across a wide range of industries.

In September 2022, Enviance acquired an ESG performance software platform and consultancy known as Reporting 21. The Reporting 21 solution will now be integrated into Enviance/Cority’s Sustainability Cloud, enhancing their ability to support customers in managing, reporting, and implementing their sustainability and ESG initiatives.

Carbon Footprint Management Market Report Scope:

Report Attributes Details
Market Size in 2023  USD 12.12 Billion
Market Size by 2031  USD 54.62 Billion
CAGR  CAGR 20.8 % From 2024 to 2031
Base Year  2023
Forecast Period  2024-2031
Historical Data  2020-2022
Report Scope & Coverage Market Size, Segments Analysis, Competitive  Landscape, Regional Analysis, DROC & SWOT Analysis, Forecast Outlook
Key Segments • By Component (Solution and Services)
• By deployment mode (Cloud, On-premises)
• By organization size (Corporates/Enterprises, Mid-Tier Enterprises, Small Businesses)
• By Vertical (Manufacturing, Energy and Utilities, Residential And Commercial Buildings, Transportation And Logistics, And IT And Telecom, Financial Servies, and Government)
Regional Analysis/Coverage North America (US, Canada, Mexico), Europe (Eastern Europe [Poland, Romania, Hungary, Turkey, Rest of Eastern Europe] Western Europe] Germany, France, UK, Italy, Spain, Netherlands, Switzerland, Austria, Rest of Western Europe]), Asia Pacific (China, India, Japan, South Korea, Vietnam, Singapore, Australia, Rest of Asia Pacific), Middle East & Africa (Middle East [UAE, Egypt, Saudi Arabia, Qatar, Rest of Middle East], Africa [Nigeria, South Africa, Rest of Africa], Latin America (Brazil, Argentina, Colombia, Rest of Latin America)
Company Profiles Carbon Footprint Ltd, Dakota Software Corporation, ENGIE, IsoMetrix, IBM corporation, Process MAP, Schneider Electric, SAP, and Wolters Kluwer N.V.
Key Drivers • Increasing government regulations and policies for reducing carbon emissions.
• Increasing awareness among businesses about the importance of sustainability and corporate social responsibility (CSR).
• The technological Advancements, such as IoT, big data analytics, and AI (artificial intelligence), are providing innovative solutions for monitoring and managing carbon emissions.
• Companies who effectively manage their carbon footprints gain a competitive edge by attracting environmentally conscious investors, partners, and customers.
Market Restraints • Implementing carbon footprint management solutions often requires significant initial investments in technology, infrastructure, and training.
• Managing carbon footprints involves dealing with complex data sets, regulatory requirements, and supply chain challenges.

Frequently Asked Questions

Ans. The Compound Annual Growth rate for the Carbon Footprint Management Market over the forecast period is 20.08%.

Ans. The projected market size for the Carbon Footprint Management Market is USD 54.62 billion by 2031. 

Ans: The Manufacturing Vertical segment dominated the Carbon Footprint Management Market.

Ans: North America region is dominant in Carbon Footprint Management Market.

Ans:

  • The Increasing government regulations and policies aimed at reducing carbon emissions are driving the market.
  • Increasing awareness among businesses about the importance of sustainability and corporate social responsibility (CSR) is encouraging them to adopt carbon footprint management practices.
  • Consumers are increasingly choosing products and services from environmentally responsible companies, pushing organizations to focus on reducing their carbon footprints.

TABLE OF CONTENTS


1. Introduction

1.1 Market Definition

1.2 Scope

1.3 Research Assumptions


2. Industry Flowchart


3. Research Methodology


4. Market Dynamics

4.1 Drivers

4.2 Restraints

4.3 Opportunities

4.4 Challenges


5. Impact Analysis

5.1 Impact of Russia-Ukraine Crisis

5.2 Impact of Economic Slowdown on Major Countries

5.2.1 Introduction

5.2.2 United States

5.2.3 Canada

5.2.4 Germany

5.2.5 France

5.2.6 UK

5.2.7 China

5.2.8 Japan

5.2.9 South Korea

5.2.9 India


6. Value Chain Analysis


7. Porter’s 5 Forces Model


8.  Pest Analysis


9. Carbon Footprint Management Market, By Component

9.1 Introduction

9.2 Trend Analysis

9.3 Solution

9.4 Services

9.4.1 Consulting

9.4.2 Integration & Deployment

9.4.3 Support & Maintenance


10. Carbon Footprint Management Market, By Deployment

10.1 Introduction

10.2 Trend Analysis

10.3 Cloud

10.4 On-premises


11. Carbon Footprint Management Market, By organization size

11.1 Introduction

11.2 Trend Analysis

11.3 Corporates/Enterprises

11.4 Mid-Tier Enterprises

11.5 Small Businesses


12. Carbon Footprint Management Market, By Vertical

12.1 Introduction

12.2 Trend Analysis

12.3 Manufacturing

12.3.1 Food & Beverages

12.3.2 Metals & Mining

12.3.3 Chemical & Materials

12.3.4 Electronics & Consumer Goods

12.3.5 Automotive

12.3.6 Pharmaceutical & Healthcare

12.3.7 Others

12.4 Energy and Utilities

12.5 Residential and Commercial Buildings

12.6 Transportation and Logistics

12.7 IT and Telecom

12.8 Financial Servies

12.9 Government


13. Regional Analysis

13.1 Introduction

14.2 North America

14.2.1 USA

14.2.2 Canada

14.2.3 Mexico

14.3 Europe

14.3.1 Eastern Europe

14.3.1.1 Poland

14.3.1.2 Romania

14.3.1.3 Hungary

14.3.1.4 Turkey

14.3.1.5 Rest of Eastern Europe

14.3.2 Western Europe

14.3.2.1 Germany

14.3.2.2 France

14.3.2.3 UK

14.3.2.4 Italy

14.3.2.5 Spain

14.3.2.6 Netherlands

14.3.2.7 Switzerland

14.3.2.8 Austria

14.3.2.9 Rest of Western Europe

14.4 Asia-Pacific

14.4.1 China

14.4.2 India

14.4.3 Japan

14.4.4 South Korea

14.4.5 Vietnam

14.4.6 Singapore

14.4.7 Australia

14.4.8 Rest of Asia Pacific

14.5 The Middle East & Africa

14.5.1 Middle East

14.5.1.1 UAE

14.5.1.2 Egypt

14.5.1.3 Saudi Arabia

14.5.1.4 Qatar

14.5.1.5 Rest of the Middle East

14.5.2 Africa

14.5.2.1 Nigeria

14.5.2.2 South Africa

14.5.2.3 Rest of Africa

14.6 Latin America

14.6.1 Brazil

14.6.2 Argentina

14.6.3 Colombia

14.6.4 Rest of Latin America


15. Company Profiles

15.1 Carbon Footprint Ltd.

15.1.1 Company Overview

15.1.2 Financials

15.1.3 Products/ Services Offered

15.1.4 SWOT Analysis

15.1.5 The SNS View

15.2 Dakota Software Corporation

15.2.1 Company Overview

15.2.2 Financials

15.2.3 Products/ Services Offered

15.2.4 SWOT Analysis

15.2.5 The SNS View

15.3 IBM Corporation

15.3.1 Company Overview

15.3.2 Financials

15.3.3 Products/ Services Offered

15.3.4 SWOT Analysis

15.3.5 The SNS View

15.4 ENGIE.

15.4 Company Overview

15.4.2 Financials

15.4.3 Products/ Services Offered

15.4.4 SWOT Analysis

15.4.5 The SNS View

15.5 IsoMetrix

15.5.1 Company Overview

15.5.2 Financials

15.5.3 Products/ Services Offered

15.5.4 SWOT Analysis

15.5.5 The SNS View

15.6 Schneider Electric

15.6.1 Company Overview

15.6.2 Financials

15.6.3 Products/ Services Offered

15.6.4 SWOT Analysis

15.6.5 The SNS View

15.7 SAP

15.7.1 Company Overview

15.7.2 Financials

15.7.3 Products/ Services Offered

15.7.4 SWOT Analysis

15.7.5 The SNS View

15.8 Wolters Kluwer N.V.

15.8.1 Company Overview

15.8.2 Financials

15.8.3 Products/ Services Offered

15.8.4 SWOT Analysis

15.8.5 The SNS View

15.9 Process MAP

15.9.1 Company Overview

15.9.2 Financials

15.9.3 Products/ Services Offered

15.9.4 SWOT Analysis

15.9.5 The SNS View

15.10 Carbon Trust.

15.10.1 Company Overview

15.10.2 Financials

15.10.3 Products/ Services Offered

15.10.4 SWOT Analysis

15.10.5 The SNS View


16. Competitive Landscape

16.1 Competitive Benchmarking

16.2 Market Share Analysis

16.3 Recent Developments

16.3.1 Industry News

16.3.2 Company News

16.3.3 Mergers & Acquisitions


17. USE Cases and Best Practices


18. Conclusion

An accurate research report requires proper strategizing as well as implementation. There are multiple factors involved in the completion of good and accurate research report and selecting the best methodology to compete the research is the toughest part. Since the research reports we provide play a crucial role in any company’s decision-making process, therefore we at SNS Insider always believe that we should choose the best method which gives us results closer to reality. This allows us to reach at a stage wherein we can provide our clients best and accurate investment to output ratio.

Each report that we prepare takes a timeframe of 350-400 business hours for production. Starting from the selection of titles through a couple of in-depth brain storming session to the final QC process before uploading our titles on our website we dedicate around 350 working hours. The titles are selected based on their current market cap and the foreseen CAGR and growth.


The 5 steps process:

Step 1: Secondary Research:

Secondary Research or Desk Research is as the name suggests is a research process wherein, we collect data through the readily available information. In this process we use various paid and unpaid databases which our team has access to and gather data through the same. This includes examining of listed companies’ annual reports, Journals, SEC filling etc. Apart from this our team has access to various associations across the globe across different industries. Lastly, we have exchange relationships with various university as well as individual libraries.
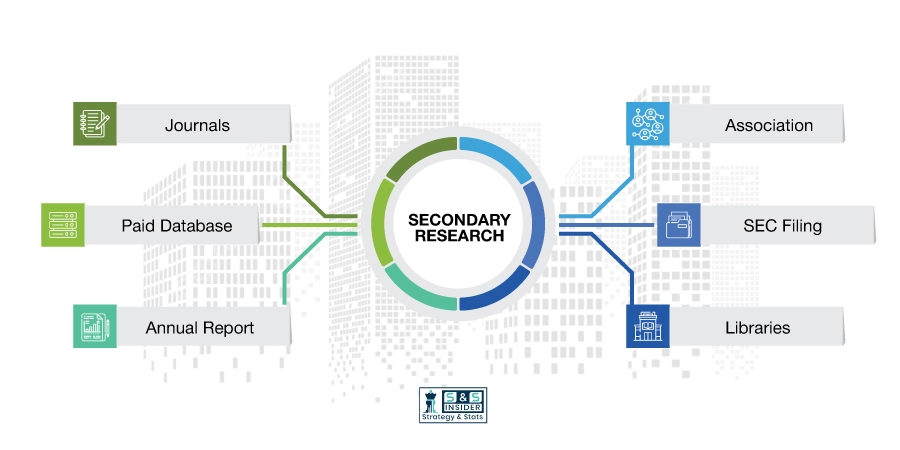
Secondary Research

Step 2: Primary Research

When we talk about primary research, it is a type of study in which the researchers collect relevant data samples directly, rather than relying on previously collected data.  This type of research is focused on gaining content specific facts that can be sued to solve specific problems. Since the collected data is fresh and first hand therefore it makes the study more accurate and genuine.

We at SNS Insider have divided Primary Research into 2 parts.

Part 1 wherein we interview the KOLs of major players as well as the upcoming ones across various geographic regions. This allows us to have their view over the market scenario and acts as an important tool to come closer to the accurate market numbers. As many as 45 paid and unpaid primary interviews are taken from both the demand and supply side of the industry to make sure we land at an accurate judgement and analysis of the market.

This step involves the triangulation of data wherein our team analyses the interview transcripts, online survey responses and observation of on filed participants. The below mentioned chart should give a better understanding of the part 1 of the primary interview.
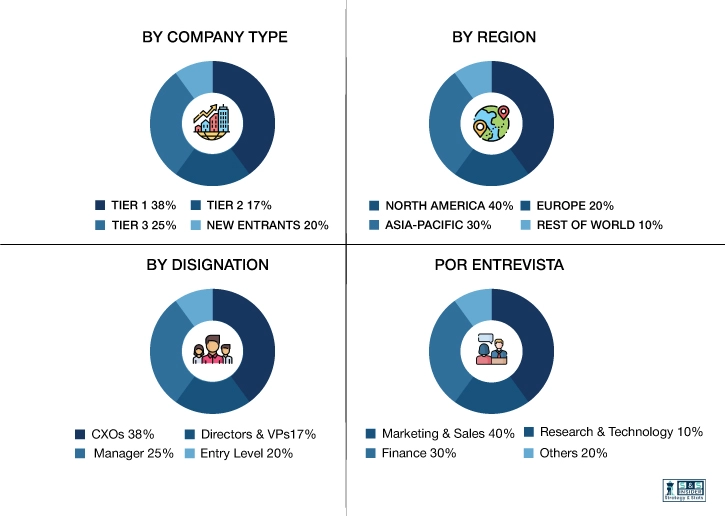
Primary Research

Part 2: In this part of primary research the data collected via secondary research and the part 1 of the primary research is validated with the interviews from individual consultants and subject matter experts.

Consultants are those set of people who have at least 12 years of experience and expertise within the industry whereas Subject Matter Experts are those with at least 15 years of experience behind their back within the same space. The data with the help of two main processes i.e., FGDs (Focused Group Discussions) and IDs (Individual Discussions). This gives us a 3rd party nonbiased primary view of the market scenario making it a more dependable one while collation of the data pointers.

Step 3: Data Bank Validation

Once all the information is collected via primary and secondary sources, we run that information for data validation. At our intelligence centre our research heads track a lot of information related to the market which includes the quarterly reports, the daily stock prices, and other relevant information. Our data bank server gets updated every fortnight and that is how the information which we collected using our primary and secondary information is revalidated in real time.

Data Bank Validation

Step 4: QA/QC Process

After all the data collection and validation our team does a final level of quality check and quality assurance to get rid of any unwanted or undesired mistakes. This might include but not limited to getting rid of the any typos, duplication of numbers or missing of any important information. The people involved in this process include technical content writers, research heads and graphics people. Once this process is completed the title gets uploader on our platform for our clients to read it.

Step 5: Final QC/QA Process:

This is the last process and comes when the client has ordered the study. In this process a final QA/QC is done before the study is emailed to the client. Since we believe in giving our clients a good experience of our research studies, therefore, to make sure that we do not lack at our end in any way humanly possible we do a final round of quality check and then dispatch the study to the client.

Start a Conversation

Hi! Click one of our member below to chat on Phone