Climate Credit Analytics Market Report Scope & Overview:
The Climate Credit Analytics Market size was valued at USD 2.80 billion in 2024 and is projected to reach USD 11.85 billion by 2032, growing at a CAGR of 19.8% from 2025 to 2032.
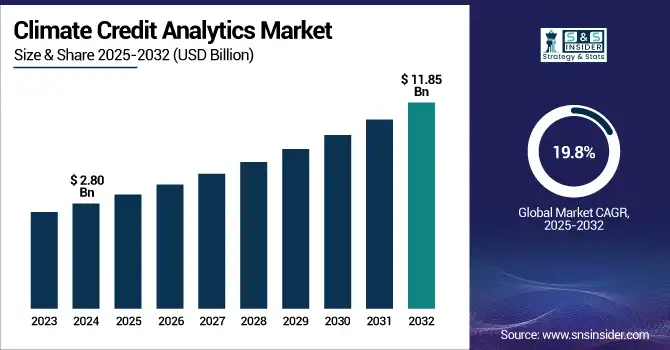
To Get more information on Climate Credit Analytics Market - Request Free Sample Report
A global opportunity occurs due to enterprise efforts to comply with carbon emissions and reduce carbon footprint in their operations, along with corporate sustainability goals as well as government regulatory trends; the market is gaining traction. Such analytics solutions help organizations monitor, assess, and manage their carbon footprints, optimize the utilization of energy, and adopt strategies involving carbon offsetting. Sectors such as energy, manufacturing, and finance are the largest users, using tools for carbon reporting, emissions reduction, and carbon trading. Initiatives like the national carbon market are prompting the fastest growth of this region in the world. Climate credit analytics is changing how companies reach net-zero targets with the applications of AI and Blockchain.
According to research, over 70% of energy firms, 65% of climate platforms, and 78% of large-cap companies use ESG frameworks and AI-blockchain analytics tools for carbon tracking, regulatory compliance, and sustainability reporting.
The U.S Climate Credit Analytics Market was valued at USD 0.82 billion in 2024 and is projected to reach USD 3.26 billion by 2032 with a CAGR of 18.84% during the forecast period of 2025-2032.
Due to the pro-climate policies, regulatory mandates, and early adoption of emerging next-gen technologies such as AI and blockchain in the U.S., the U.S. leads in this market. Policies like the Inflation Reduction Act reward businesses for engaging in carbon accounting and investing in clean energy solutions and corporate sustainability practices. Many of the largest climate credit analytics market companies, such as Microsoft, Google, and Amazon, invest heavily in carbon offsetting and renewable energy certificates, which increases demand for them. A mature digital infrastructure and well-developed ecosystem of ESG-oriented investors and analytics suppliers further strengthen the country for climate credit innovation.
Climate Credit Analytics Market Dynamics
Drivers:
-
Regulatory Pressures and Corporate Sustainability Initiatives Propel Climate Credit Analytics Adoption
Many governments across the globe are intervening with the carbon pricing and climate risk disclosure mandate, etc., forcing organizations to seek advanced analytics tools to monitor and measure emissions. At the same time, companies are responding to ambitious sustainability commitments with an increasing focus on the products needed to accurately account for carbon.
For example, the U.S. Inflation Reduction Act, which encourages companies to do carbon accounting and carbon offsetting, creates demand for climate credit analytics.
Restraints:
-
Lack of Standardization and Transparency Hinders Market Growth
One of the greatest challenges for the climate credit analytics market is the lack of standardized approaches to measuring, reporting, and verifying emissions reductions. Diverse rules and quality standards in every jurisdiction lead to inconsistency in transactions and market confidence. The absence of common practices and visibility can restrict the adoption of carbon credits as a compliance instrument.
Opportunities:
Technological Advancements Enhance Climate Credit Analytics Capabilities
Climate credit innovations in blockchain and AI are changing climate credit analytics. By providing transparency and traceability, blockchain reduces the risk of double-counting and fraud, which in turn improves the integrity of the carbon credit market. Emissions reductions are now much easier to measure accurately with the help of AI-driven analytics platforms, allowing organizations to make better selection choices to achieve sustainability goals.
According to research, Blockchain-based carbon credit systems have reduced offset fraud risk by 40%, improving transparency and buyer trust in voluntary markets.
Challenges:
-
Market Fragmentation and Credibility Issues Undermine Confidence.
Carbon removal technologies can result in a large market (as much as $250 billion), but investor and corporate interest are limited by the significant challenges. At present, reluctance is based on the uncertainty surrounding unproven technologies, and even fear of reputational damage if projects end up failing. Artificial market limitations are caused by a market without sufficient liquidity, a large variety of mutually non-competitive credit types, and a lack of regulatory regimes that incentivize credit as a purchase.
Climate Credit Analytics Market Segment Analysis
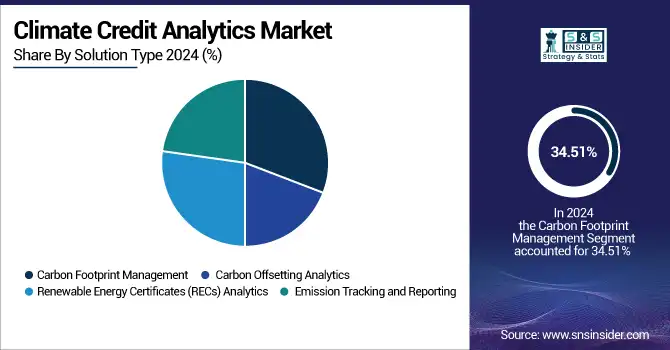
By Solution Type
The carbon footprint management segment accounts for the highest revenue share of 34.51% in 2024 and is expected to continue its dominance, driven by increasing corporate net-zero commitments and stringent regulatory requirements, in the climate credit analytics market. Organizations use these solutions for emissions measurement and tracking toward sustainability objectives. Popular suites include IBM’s Environmental Intelligence Suite and Microsoft Cloud for Sustainability, which have extensive carbon accounting and reporting capabilities.
The carbon offsetting analytics segment is expected to grow at the highest CAGR of 21.12% during the forecast period, based on component, due to rising demand for high-integrity carbon credits and global net-zero pledges. Offsetting analytics to hold carbon credit investments accountable by Shell, Delta Air Lines, and others in a carbon offset world. Now, instead of trading a few offsets for real carbon reductions, Pachama, Sylvera, and others use satellite data and AI to validate the offset projects.
By Industry
In 2024, the energy and utilities segment dominated the market share of 41.84%, because of regulatory policies such as the EU Emissions Trading System and corporate decarbonization handbooks. Climate analytics helps utilities like Enel and NextEra Energy to monitor emissions, maximize the use of renewable sources, and participate in carbon credit trading. The combination of analytics with intelligent grid technologies enriches real-time emissions prediction. These climate credit analytics solutions help meet the needs of carbon pricing regimes while also helping to ensure that business operations are sustainable. This segment is expected to drive the market as rising demand for verification and reporting of clean energy will continue to dominate this market.
BFSI represents the highest CAGR of 21.68% as climate-related financial risks become important to the entire sector. The climate credit analytics of EsG investment platforms are also being embedded into financial institutions to measure carbon exposure by loan portfolios and assets.. These are the tools used by companies such as BlackRock and HSBC to comply with regulatory stress testing and climate risk disclosures. One of the biggest drivers of this trend is growing investor demand for transparency and sustainable financial products, and climate credit analytics are critical to making the connection from global climate goals to individual portfolio decisions.
Regional Analysis
North America is the biggest revenue-generating region in the climate credit analytics market share OF 41.18%, due to a strict regulatory landscape, sustainability reporting routine, and presence of some of the largest tech companies to drive innovation and climate analytics research. The U.S. leads regional growth with strong climate policies, driven by the Inflation Reduction Act, widespread adoption of AI and blockchain for emissions tracking, and advanced climate analytics deployment.
The United States dominates due to aggressive climate policy incentives, a mature carbon trading ecosystem, and corporate leadership in sustainability practices and analytics adoption. North America accounts for 41.18% of the global market share.
Europe is the most successful region in climate credit analytics as it is driven by regulatory governance. The EU ETS and other regimes under the Corporate Sustainability Reporting Directive are some of the mechanisms used across the region to promote analytics. Notably, the focus is on the use of analytics platforms for monitoring emissions and validating carbon offsets.
Germany is the leading country due to industrial decarbonization efforts, robust commitment to renewable energy, and involvement in carbon trading.
The Asia Pacific is projected to witness the fastest climate credit analytics Market growth with a CAGR of 20.54%, owing to the swift industrialization in the region, regulatory evolution, and national carbon markets already established in Asia Pacific. Government-initiated collaboration between the private sector is pushing emissions tracking further in China, Japan, and South Korea.
China leads the way due to the implementation of its national carbon trading program and government-supported policies on carbon neutrality and corporate environmental responsibility.
Climate credit analytics continues to gain momentum in the Middle East & Africa and Latin America as sustainability initiatives, green energy investments, and carbon offsetting projects grow, with the UAE and Brazil taking the lead among them all, committing to more active climate action and integrating climate into national policies.

Get Customized Report as per Your Business Requirement - Enquiry Now
Key Players
The major key players of the Climate credit analytics market are S&P Global Sustainable1, MSCI ESG & Climate Solutions, Moody’s ESG Solutions, ISS ESG, Equifax Climate Risk Solutions, BlackRock, Fitch Ratings, Bloomberg, Verisk Analytics, CareEdge Group and others.
Key Developments
-
In February 2025, Bloomberg launched the MARS Climate, part of Bloomberg's suite of MARS tools to identify climate-related financial risks and opportunities at the portfolio level. It is hosted on the TRACT engine by BloombergNEF, providing scenario analysis consistent with the NGFS frameworks.
-
In October 2024, CareEdge also launched its global sovereign ratings through its subsidiary CareEdge Global IFSC Ltd, covering 39 global countries. It is the first move India has made on the global credit ratings scene, taking on the all-powerful global agencies.
| Report Attributes | Details |
|---|---|
| Market Size in 2024 | USD 2.80 Billion |
| Market Size by 2032 | USD 11.85 Billion |
| CAGR | CAGR of 19.8% From 2025 to 2032 |
| Base Year | 2024 |
| Forecast Period | 2025-2032 |
| Historical Data | 2021-2023 |
| Report Scope & Coverage | Market Size, Segments Analysis, Competitive Landscape, Regional Analysis, DROC & SWOT Analysis, Forecast Outlook |
| Key Segments | •By Solution Type (Carbon Footprint Management, Emission Tracking and Reporting, Renewable Energy Certificates (RECs) Analytics, Carbon Offsetting Analytics) •By Industry (IT & Telecommunications, BFSI, Energy and Utilities, Manufacturing, Transportation, Others |
| Regional Analysis/Coverage | North America (US, Canada, Mexico), Europe (Germany, France, UK, Italy, Spain, Poland, Turkey, Rest of Europe), Asia Pacific (China, India, Japan, South Korea, Singapore, Australia, Rest of Asia Pacific), Middle East & Africa (UAE, Saudi Arabia, Qatar, South Africa, Rest of Middle East & Africa), Latin America (Brazil, Argentina, Rest of Latin America) |
| Company Profiles | S&P Global Sustainable1, MSCI ESG & Climate Solutions, Moody’s ESG Solutions, ISS ESG, Equifax Climate Risk Solutions, BlackRock, Fitch Ratings, Bloomberg, Verisk Analytics, CareEdge Group and others. |
Get in Touch
