Cenospheres Market Report Scope & Overview
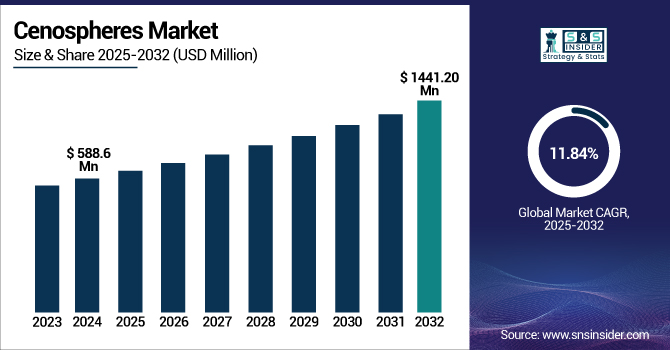
The Cenospheres Market size was USD 588.6 million in 2024 and is expected to reach USD 1441.20 million by 2032 and grow at a CAGR of 11.84% over the forecast period of 2025-2032.
To Get more Information on Cenospheres Market - Request Free Sample Report
Increasing use in automotive components drives the cenospheres market growth. The growing demand for lightweight materials that improve vehicle performance and fuel efficiency is driving cenosphere usage in automotive components. In an era when the automotive industry is striving to reduce vehicle weight amid stricter fuel economy and emissions standards, cenospheres present a very viable solution due to their unique properties of low density combined with high strength. These microscopically small particles are used as fillers in many automotive applications, including bumpers and interior panels, and can reduce weight while still maintaining strength and durability.
For instance, the U.S. Environmental Protection Agency (EPA) and the European Union initiated stringent standards that require light-weighting of vehicles to be applied in automotive production. Automakers are now using cenospheres in numerous components, including bumpers, dashboards, and interior panels, to reduce weight while maintaining strength and safety.
Market Dynamics
Drivers
-
Rising Demand for Lightweight Materials Drives the Market Growth
The primary factors driving the cenospheres market growth include a rising demand for lightweight materials. With industries such as automotive and construction emphasizing efficiency and performance, the demand for materials that are both strong and lightweight continues to rise. Light-weighting is a common requirement in industries such as automotive, where vehicle weight must be minimized to enhance fuel efficiency and comply with stringent emission regulations. Cenospheres market growth are a significant component in ultra-low-density, high-strength-to-weight components such as bumpers, interior panels, and dashboard components.
In July 2024, A report by the U.S. Department of Energy’s National Renewable Energy Laboratory (NREL) highlights the importance of using lightweight materials to improve EV efficiency and lower the cost of ownership. According to the report, if components like hoods and roofs of an average passenger car are made with recyclable carbon fiber composites instead of steel, this could reduce a car's weight by as much as 50% and improve fuel efficiency by up to 35%.
Moreover, these materials are also recyclable, meaning they can be recycled up to three times, and each cycle has the potential to cut costs and emissions by between 90% and 95%. The increasing demand for lightweight materials due to the need for eco-friendly, energy-efficient solutions in the automotive industry is projected to drive the use of cenospheres as a potential replacement for earthy materials in a range of applications.
Restrain
-
Limited Availability of Raw Materials May Hamper The Market Growth
Most industrial cenospheres originate from fly ash, the byproduct of coal combustion at power plants. Meanwhile, the supply of fly ash has become ever scarcer, as the world has moved to a cleaner form of energy and many coal-fired plants have closed due to tougher environmental standards. The shift away from coal and towards renewable sources of energy also cuts supplies of this critical feedstock. The limited fly ash availability can contribute to increasing prices of cenospheres due to a reduction in route competitiveness with other materials. In addition, fly ash supply inconsistency in different regions may create hurdles in the supply chain and lead to price fluctuation, which will adversely affect the overall growth of the market and consequently the adoption of cenospheres across many end-use industries.
Opportunity
-
Adoption In New Applications Creates the Opportunity For the Market
The new application use provides a considerable opportunity to the cenospheres market as they can also be utilized in industries that were traditionally not considered, owing to their special properties. This property of low density and high strength has led to the growth of innovative applications of cenospheres in diverse fields. In the oil & gas industry, cenospheres are utilized in drilling muds and cementing operations, improving the properties of these formulations in high P, T environments. Cenospheres find application in aerospace for the manufacture of light composite aircraft; the ideal combination of low density and strength provides high utility for fuel efficiency and overall performance.
For instance, in October 2023, Omya AG, an international provider of caCO3-based laying materials, developed a new cenosphere coating for oil and gas pipeline corrosion protection. The goal of this innovation is to improve the service life and efficiency of pipelines in tough conditions.
Segmentation Analysis
By Product
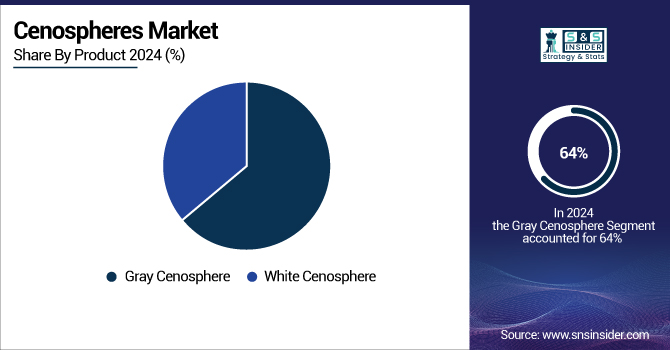
Gray cenospheres held the largest market share, around 64%, in 2024. The gray cenospheres are more widely available, more affordable, and more suitable for a variety of applications across industries. The cenospheres are the products of the combustion of coal in thermal power plants and possess a unique and ideal combination of being lightweight and high-strength. They are therefore ideal for products such as lightweight concrete, coatings, and oil and gas applications.
White cenosphere held a significant market share in the forecast period. These cenospheres are often obtained from thermal power plants burning coal of higher grade and are white in color owing to their pure silica composition. This is especially important in applications like coatings, paints, and plastics where ultimate appearance and consistency are critical properties. They further dominate the market such as automotive and aerospace due to their excellent thermal and electrical insulation properties and their capacity to enhance the durability and functionality of end products.
By End-Use Industry
Construction held the largest market share, around 32%, in 2024. With the growing importance of sustainable and energy-efficient construction projects, cenospheres are often in demand for enabling buildings to consume less energy by enhancing their insulation properties. Moreover, in construction, cenospheres are used in the manufacture of high-performance cement, coatings, and paints.
The automotive segment held a significant market share. It is owing to increasing preferences for lightweight materials in vehicles, which help in improving fuel efficiency and reducing emissions. Cenospheres are used in the manufacturing of automotive components due to their low density and high strength (i.e., bumpers, dashboards, and interior parts). Since governments across the planet implement stricter standards concerning fuel efficiency and emissions, the factor of lowering car weights is followed by essential.
Regional Analysis
North America cenospheres market held the largest market share, around 34.20% in 2024. It is owing to the presence of a robust industrial ecosystem, high demand across diverse industries, and stringent regulations for lightweight and sustainable materials, which encourage adoption in the region. Cenospheres are mainly consumed by the automotive, construction, and oil & gas industries in the region, as these industries have a growing demand for materials of high performance to meet the sustainability and regulatory needs. As an example in the automotive sector, there is a big push for energy-efficient vehicles, which creates demand for lightweight materials such as cenospheres.
U.S held the largest market share, around 74%, in 2024, with the highest CAGR of 11.56% during the forecast period. In U.S., companies are focused on production of cenospheres for various applications. For instance, CenoStar is engaged in the production and supply of cenospheres. The company specializes in providing premium-grade products for different industrial applications such as construction, oil & gas, and the automotive industry. CenoStar is a domestic supplier who is providing domestic support to the U.S. cenospheres market.
Asia Pacific held a significant market share and is the fastest-growing segment over the forecast period. It is owing to increasing industrialization, infrastructure development, and high demand from the construction, oil & gas, and automotive industries. Fly ash is the predominant raw material for cenospheres, and so nations such as China and India are highly competitive on the supply side of the equation due to their fly ash production scale. In addition, growing government initiatives regarding sustainable construction materials, low-cost production facilities, coupled with growing investments in lightweight composites, further drive the growth of the market in the region. The Asia Pacific region remains a stronghold for the global cenospheres market growth, with a rapidly developing export base, coupled with continuous R&D activities.
According to the Automotive Component Manufacturers Association of India (ACMA), India’s auto component industry recorded a turnover of USD 74.1 billion in FY24, marking a 9.8% year-on-year growth. This surge is driven by strong domestic vehicle demand, a resilient aftermarket, and increasing exports.
Europe held a significant market share during the forecast period. It is owing to a very strong focus on sustainability, manufacturing strategies and strict regulations for eco-friendly materials. A well-established infrastructure already exists for recycling and processing industrial by-products like fly ash, which serves as the primary feedstock for cenospheres. Industrial sectors like automotive, construction, and aerospace in Germany, France, UK have gained higher adoption of cenospheres to create lightweight and long-lasting energy-efficient products. Moreover, EU directives aimed at minimizing greenhouse gases and promoting green materials have further propelled the usage of cenospheres, making Europe home to the largest global market.

Get Customized Report as per Your Business Requirement - Enquiry Now
Key Players
Cenospheres companies include CenoStar Corporation, Omya AG, Envirospheres Pty Ltd, Petra Buildcare Products, Durgesh Merchandise Pvt. Ltd., Reslab Microfiller, Zhengzhou Hollowlite Materials Co., Ltd., Qingdao Eastchem Inc., Vipra Cenospheres, and Cenosphere India Pvt. Ltd.
These key players help to understand the cenospheres market share, cenospheres market analysis, cenospheres market trends, and cenospheres industry trends.
Recent Development:
-
In 2024, Zhengzhou Hollowlite Materials launched solid glass microspheres for fireproof additives. From construction to automotive, aerospace to healthcare, these microspheres offer high strength, chemical inertness, thermal stability, and many more benefits.
-
In 2022, Nouryon B.V. launched Expancel HP92 microspheres for the automotive industry in June 2022. These high-performance lightweight fillers can help meet stringent emission regulations and consumer demand for more fuel-efficient vehicles without degrading performance.
| Report Attributes | Details |
|---|---|
| Market Size in 2024 | USD 588.76 Million |
| Market Size by 2032 | USD 1441.20 Million |
| CAGR | CAGR of11.84% From 2025 to 2032 |
| Base Year | 2024 |
| Forecast Period | 2025-2032 |
| Historical Data | 2021-2023 |
| Report Scope & Coverage | Market Size, Segments Analysis, Competitive Landscape, Regional Analysis, DROC & SWOT Analysis, Forecast Outlook |
| Key Segments | • By Product (Gray Cenosphere, White Cenosphere) • By End-use Industry (Oil & Gas, Construction, Automotive, Refractory, Aerospace, Others) |
| Regional Analysis/Coverage | North America (US, Canada, Mexico), Europe (Germany, France, UK, Italy, Spain, Poland, Turkey, Rest of Europe), Asia Pacific (China, India, Japan, South Korea, Singapore, Australia, Rest of Asia Pacific), Middle East & Africa (UAE, Saudi Arabia, Qatar, South Africa, Rest of Middle East & Africa), Latin America (Brazil, Argentina, Rest of Latin America) |
| Company Profiles | CenoStar Corporation, Omya AG, Envirospheres Pty Ltd, Petra Buildcare Products, Durgesh Merchandise Pvt. Ltd., Reslab Microfiller, Zhengzhou Hollowlite Materials Co., Ltd., Qingdao Eastchem Inc., Vipra Cenospheres, Cenosphere India Pvt. Ltd. |
Get in Touch
