To Get more information on Childcare Management Software Market - Request Free Sample Report
Childcare Management Software (CMS) addresses these challenges by streamlining operations such as attendance tracking, billing, enrollment, and parent communication. By improving efficiency, transparency, and accountability, CMS ensures that limited resources are better managed and that children receive consistent, high-quality care. In low-resource settings with growing young populations, CMS is not optional it is a vital tool for sustainable childcare delivery.
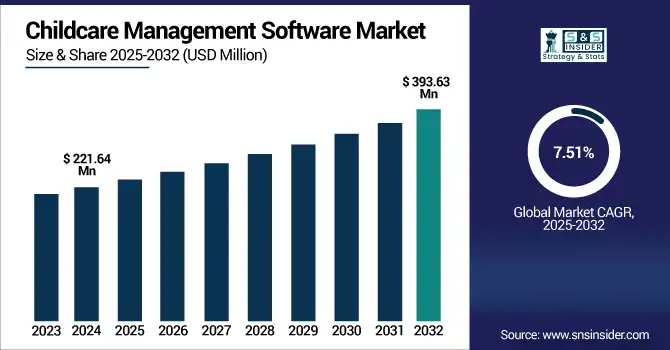
The Childcare Management Software Market, valued at USD 221.64 million in 2024, is projected to grow to USD 393.63 million by 2032, at a CAGR of 7.51% from 2025–2032.
This growth reflects the increasing recognition of CMS platforms as essential tools for operating modern childcare environments. Key drivers include the shift to cloud-based systems, which enable real-time access to data, better security, and easier scalability especially valuable for providers managing large and distributed child populations.
This model illustrates how digital platforms can improve operational control, parental trust, and service delivery. As child populations expand and family dynamics evolve, CMS is becoming essential infrastructure for effective, future-ready childcare systems worldwide.
Rising parental expectations and demand for streamlined childcare operations are fueling rapid adoption of childcare management software globally.
Rising parental expectations for safety, communication, and transparency are driving rapid adoption of childcare management software worldwide. Parents today want real-time updates on their child’s activities, attendance, and learning progress, pushing childcare providers to digitize daily operations for greater visibility and trust.
Platforms like Brightwheel are leading this shift. According to its official website, 95% of administrators report improved parent communication, while providers save up to 20 hours monthly on admin tasks. Additionally, 90% of preschools using Brightwheel say more families pay on time through its digital billing tools.
This aligns with broader trends, the U.S. Bureau of Labor Statistics reports that 62% of mothers with children under 6 were employed in 2023. As dual-income households grow, working parents prioritize centers offering reliable, tech-enabled engagement and efficient management.
Accelerated digital transformation in early childhood education is boosting demand for cloud-based and mobile-friendly childcare software platforms.
Childcare providers are increasingly adopting digital platforms to modernize operations, enhance efficiency, and meet compliance standards. Cloud-based tools now offer mobile check-ins, secure data storage, and integrated communication all critical for today’s fast paced childcare environments.
Notable examples include:
These platforms provide the scalability, efficiency, and transparency required to meet increasing parental expectations and strict regulatory demands, making digital tools not just convenient additions but critical components for delivering high-quality, compliant, and competitive childcare services today.
High implementation costs and limited IT expertise among small providers constrain adoption of advanced childcare management solutions.
Many small and independent childcare providers encounter financial and technical challenges when adopting childcare management software. High setup costs, ongoing subscription fees, and the need for staff training often discourage investment. In rural and underserved areas, limited access to reliable internet makes cloud-based solutions difficult to implement. As of June 2023, over 14% of rural and nearly 12% of Tribal households still lacked broadband, compared to just 3% in metro areas. Without adequate IT support, many centers stick to manual systems, slowing digital transformation across the sector.
Childcare Software Cost Comparison
Software Provider |
Subscription Cost |
Pricing Basis |
Childcare Application Suite |
USD 8.88 per user/month |
Per staff user |
Connect Childcare (UK) |
USD 95 per month |
Flat monthly fee |
DaycareTech (US) |
USD 199.99 per location/month |
Per center |
Childcare Software (generic) |
USD 1.05–USD 1.40 per child/month |
Per enrolled child |
HiMama |
USD 9–USD 12 per classroom/month |
Per classroom |
These costs, while reasonable for large organizations, can quickly become prohibitive for small providers especially when paired with extra charges for onboarding, data migration, and training. As a result, many centers delay or avoid adopting digital systems, slowing the industry's broader modernization.
Regulatory complexities and frequent compliance updates create uncertainty around long-term system sustainability and investment confidence.
Childcare providers navigate complex, changing regulations on safety, staffing, and curriculum. Frequent policy shifts require constant software updates and investments, raising concerns about system longevity and upgrade costs. Data privacy issues add complexity, discouraging long-term commitments and limiting adoption particularly among risk-averse or budget-constrained providers slowing digital transformation in the sector.
Regulatory Impact on Childcare Software Adoption
Region/Country |
Key Regulation |
Compliance Requirement |
Implication for Software Providers |
United States |
COPPA |
Fines up to USD 53,088 per violation |
Must ensure secure child data handling and strict privacy controls |
United States |
Child Care Regulation Index |
Every 1-point increase adds USD 774/year in infant care costs |
Software must constantly adapt to cost-driving policy updates |
European Union |
GDPR |
Fines up to USD 21.5or 4% of global turnover; 72-hr breach notice |
Requires privacy by design, default settings, and audit readiness |
Canada (Quebec) |
Provincial Child Ratio Laws |
Infant ratio of 1:5 (under 17 months) |
Software must support detailed staff–child ratio tracking |
Australia |
ACECQA Staffing Standards |
Infant ratio as strict as 1:4 |
Frequent updates needed to track qualifications and ratios |
Growing urbanization and working parent populations in emerging markets are expanding the addressable base for childcare management software adoption.
Rapid urbanization and rising female workforce participation in developing economies are increasing the need for formal childcare services. This growing demand pressures providers to streamline operations and comply with evolving regulations. It presents strong opportunities for scalable, multilingual, mobile-first software solutions that enable real-time communication, digital payments, and policy compliance across urban centers in Asia-Pacific, Latin America, and Africa.
In 2024, Play Schools led the Childcare Management Software Market with 52% revenue share due to their adoption of digital tools for administrative efficiency, enrollment management, and parent communication. Real-time updates, attendance tracking, and compliance needs have made software integration essential in delivering high-quality, structured early education services.
In 2024, Family and Child Data Management segment led with a 23% market share, driven by the growing need for centralized records on health, enrollment, and emergency contacts. These modules support compliance, personalized care, and efficient documentation. Rising regulatory scrutiny makes secure child profile management critical for operational accountability and improved provider performance.
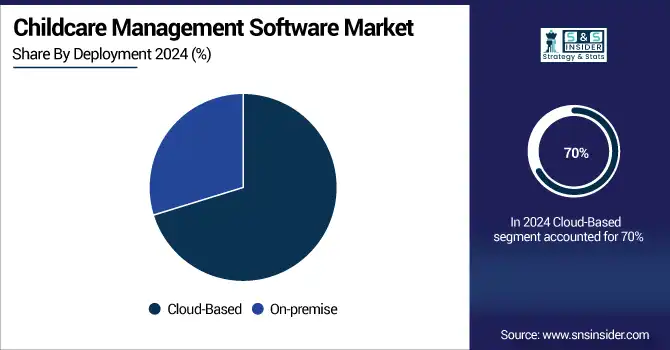
In 2024, the Cloud-Based segment dominated the Childcare Management Software Market with a 70% share. Its success is attributed to remote access, scalability, and mobile compatibility. Offering real-time updates and automated backups, cloud platforms empower providers with efficient, secure, and future-ready solutions aligned with rising mobile-first childcare trends.
From 2025–2032, the Parents segment is projected to grow at a CAGR of 9.85%, driven by rising demand for real-time child updates, digital communication, and safety alerts. As tech-savvy parents seek transparency, platforms offering mobile apps and digital tools are becoming essential for enhancing engagement and caregiver-parent interaction.
Expected to grow at a 9.55% CAGR from 2025–2032, Time and Activity Management segment benefits from increasing demand for structured scheduling and real-time tracking. Digital tools help childcare centers manage routines, optimize staff time, and track learning progress. The focus on personalized activity insights is accelerating adoption of these performance-focused software modules.
The Cloud-Based segment of the Childcare Management Software Market is projected to grow at a CAGR of 8.23% from 2025 to 2032. This growth is driven by rising demand for flexible, scalable, and mobile-compatible platforms that offer real-time updates, secure data access, and seamless management for providers and parents alike.
Get Customized Report as per Your Business Requirement - Enquiry Now
Key Players
Procare Software, Jackrabbit Technologies, Smartcare, ECCE Software, Cirrus Group, Eleyo Inc., Himama Pvt Ltd, Bloomz Inc., Childcare Sage, EZChildTrack, Kangarootime, Kids Note Inc., KidReports LLC, KINDERLIME, Kindertales
In 2025, Procare Solutions launched Procare Professional Development accredited online training for child care providers with instant certification and compliance tracking via interactive dashboard.
In 2023, Procare introduced major enhancements supporting ECE providers, covering software improvements and advocacy effort.
Report Attributes | Details |
---|---|
Market Size in 2024 | USD 221.64 Million |
Market Size by 2032 | USD 393.63 Million |
CAGR | CAGR of 7.51% From 2025 to 2032 |
Base Year | 2024 |
Forecast Period | 2025-2032 |
Historical Data | 2021-2023 |
Report Scope & Coverage | Market Size, Segments Analysis, Competitive Landscape, Regional Analysis, DROC & SWOT Analysis, Forecast Outlook |
Key Segments | • By Deployment (On-premise, Cloud-Based) • By Solution (Family and Child Data Management, Time and Activity Management, Nutrition Management, Attendance Tracker, Employee Data Management, Payroll, Accounting, Others) • By End-user (Parents, Daycare Centers, Play Schools) |
Regional Analysis/Coverage | North America (US, Canada, Mexico), Europe (Germany, France, UK, Italy, Spain, Poland, Turkey, Rest of Europe), Asia Pacific (China, India, Japan, South Korea, Singapore, Australia, Rest of Asia Pacific), Middle East & Africa (UAE, Saudi Arabia, Qatar, South Africa, Rest of Middle East & Africa), Latin America (Brazil, Argentina, Rest of Latin America) |
Company Profiles | Procare Software, Jackrabbit Technologies, Smartcare, ECCE Software, Cirrus Group, Eleyo Inc., Himama Pvt Ltd, Bloomz Inc., Childcare Sage, EZChildTrack, Kangarootime, Kids Note Inc., KidReports LLC, KINDERLIME, Kindertales |
Ans: The market is projected to grow at a CAGR of 7.51% from 2025 to 2032, driven by increasing digital adoption.
Ans: The market size reached USD 221.64 Million in 2024 due to growing demand for efficient and digital childcare management systems.
Ans: Increasing demand for digital platforms that simplify childcare tasks and improve parent communication is a key market growth factor.
Ans: The Play Schools segment dominated in 2024 with 52% share, due to strong adoption of digital tools in structured learning settings.
Ans: North America led the market in 2024 with 39% share, supported by digital maturity, regulations, and high working parent population.
Table of Contents
1. Introduction
1.1 Market Definition
1.2 Scope (Inclusion and Exclusions)
1.3 Research Assumptions
2. Executive Summary
2.1 Market Overview
2.2 Regional Synopsis
2.3 Competitive Summary
3. Research Methodology
3.1 Top-Down Approach
3.2 Bottom-up Approach
3.3. Data Validation
3.4 Primary Interviews
4. Market Dynamics Impact Analysis
4.1 Market Driving Factors Analysis
4.1.1 Drivers
4.1.2 Restraints
4.1.3 Opportunities
4.1.4 Challenges
4.2 PESTLE Analysis
4.3 Porter’s Five Forces Model
5. Statistical Insights and Trends Reporting
5.1 Average Implementation Time
5.2 Pricing Models and Distribution
5.3 Customer Retention and Churn Rates
5.4 Data Security & Compliance Adoption Rates
5.5 Software Feature Utilization Rates
6. Competitive Landscape
6.1 List of Major Companies, By Region
6.2 Market Share Analysis, By Region
6.3 Product Benchmarking
6.3.1 Product specifications and features
6.3.2 Pricing
6.4 Strategic Initiatives
6.4.1 Marketing and promotional activities
6.4.2 Distribution and Supply Chain Strategies
6.4.3 Expansion plans and new Product launches
6.4.4 Strategic partnerships and collaborations
6.5 Technological Advancements
6.6 Market Positioning and Branding
7. Childcare Management Software Market Segmentation By Solution
7.1 Chapter Overview
7.2 Family and Child Data Management
7.2.1 Family and Child Data Management Market Trends Analysis (2021-2032)
7.2.2 Family and Child Data Management Market Size Estimates and Forecasts to 2032 (USD Million)
7.3 Time and Activity Management
7.3.1 Time and Activity Management Market Trends Analysis (2021-2032)
7.3.2 Time and Activity Management Market Size Estimates and Forecasts to 2032 (USD Million)
7.4 Nutrition Management
7.4.1 Nutrition Management Market Trends Analysis (2021-2032)
7.4.2 Nutrition Management Market Size Estimates and Forecasts to 2032 (USD Million)
7.5 Attendance Tracker
7.5.1 Attendance Tracker Market Trends Analysis (2021-2032)
7.5.2 Attendance Tracker Market Size Estimates and Forecasts to 2032 (USD Million)
7.6 Employee Data Management
7.6.1 Employee Data Management Market Trends Analysis (2021-2032)
7.6.2 Employee Data Management Market Size Estimates and Forecasts to 2032 (USD Million)
7.7 Payroll
7.7.1 Payroll Market Trends Analysis (2021-2032)
7.7.2 Payroll Market Size Estimates and Forecasts to 2032 (USD Million)
7.8 Accounting
7.8.1 Accounting Market Trends Analysis (2021-2032)
7.8.2 Accounting Market Size Estimates and Forecasts to 2032 (USD Million)
7.9 Others
7.9.1 Others Market Trends Analysis (2021-2032)
7.9.2 Others Market Size Estimates and Forecasts to 2032 (USD Million)
8. Childcare Management Software Market Segmentation By Deployment
8.1 Chapter Overview
8.2 On-premise
8.2.1 On-premise Market Trend Analysis (2021-2032)
8.2.2 On-premise Market Size Estimates and Forecasts to 2032 (USD Million)
8.3 Cloud-Based
8.3.1 Cloud-Based Market Trends Analysis (2021-2032)
8.3.2 Cloud-Based Market Size Estimates and Forecasts to 2032 (USD Million)
9. Childcare Management Software Market Segmentation By End-user
9.1 Chapter Overview
9.2 Parents
9.2.1 Parents Market Trends Analysis (2021-2032)
9.2.2 Parents Market Size Estimates and Forecasts to 2032 (USD Million)
9.3 Daycare Centers
9.3.1 Daycare Centers Market Trends Analysis (2021-2032)
9.3.2 Daycare Centers Market Size Estimates and Forecasts to 2032 (USD Million)
9.4 Play Schools
9.4.1 Play Schools Market Trends Analysis (2021-2032)
9.4.2 Play Schools Market Size Estimates and Forecasts to 2032 (USD Million)
10. Regional Analysis
10.1 Chapter Overview
10.2 North America
10.2.1 Trends Analysis
10.2.2 North America Childcare Management Software Market Estimates and Forecasts, by Country (2021-2032) (USD Million)
10.2.3 North America Childcare Management Software Market Estimates and Forecasts, By Solution (2021-2032) (USD Million)
10.2.4 North America Childcare Management Software Market Estimates and Forecasts, By Deployment (2021-2032) (USD Million)
10.2.5 North America Childcare Management Software Market Estimates and Forecasts, By End-user (2021-2032) (USD Million)
10.2.6 USA
10.2.6.1 USA Childcare Management Software Market Estimates and Forecasts, By Solution (2021-2032) (USD Million)
10.2.6.2 USA Childcare Management Software Market Estimates and Forecasts, By Deployment (2021-2032) (USD Million)
10.2.6.3 USA Childcare Management Software Market Estimates and Forecasts, By End-user (2021-2032) (USD Million)
10.2.7 Canada
10.2.7.1 Canada Childcare Management Software Market Estimates and Forecasts, By Solution (2021-2032) (USD Million)
10.2.7.2 Canada Childcare Management Software Market Estimates and Forecasts, By Deployment (2021-2032) (USD Million)
10.2.7.3 Canada Childcare Management Software Market Estimates and Forecasts, By End-user (2021-2032) (USD Million)
10.2.8 Mexico
10.2.8.1 Mexico Childcare Management Software Market Estimates and Forecasts, By Solution (2021-2032) (USD Million)
10.2.8.2 Mexico Childcare Management Software Market Estimates and Forecasts, By Deployment (2021-2032) (USD Million)
10.2.8.3 Mexico Childcare Management Software Market Estimates and Forecasts, By End-user (2021-2032) (USD Million)
10.3 Europe
10.3.1 Trends Analysis
10.3.2 Europe Childcare Management Software Market Estimates and Forecasts, by Country (2021-2032) (USD Million)
10.3.3 Europe Childcare Management Software Market Estimates and Forecasts, By Solution (2021-2032) (USD Million)
10.3.4 Europe Childcare Management Software Market Estimates and Forecasts, By Deployment (2021-2032) (USD Million)
10.3.5 Europe Childcare Management Software Market Estimates and Forecasts, By End-user(2021-2032) (USD Million)
10.3.6 Germany
10.3.1.6.1 Germany Childcare Management Software Market Estimates and Forecasts, By Solution (2021-2032) (USD Million)
10.3.1.6.2 Germany Childcare Management Software Market Estimates and Forecasts, By Deployment (2021-2032) (USD Million)
10.3.1.6.3 Germany Childcare Management Software Market Estimates and Forecasts, By End-user (2021-2032) (USD Million)
10.3.7 France
10.3.7.1 France Childcare Management Software Market Estimates and Forecasts, By Solution (2021-2032) (USD Million)
10.3.7.2 France a Childcare Management Software Market Estimates and Forecasts, By Deployment (2021-2032) (USD Million)
10.3.7.3 France Childcare Management Software Market Estimates and Forecasts, By End-user (2021-2032) (USD Million)
10.3.8 UK
10.3.8.1 UK Childcare Management Software Market Estimates and Forecasts, By Solution (2021-2032) (USD Million)
10.3.8.2 UK Childcare Management Software Market Estimates and Forecasts, By Deployment (2021-2032) (USD Million)
10.3.8.3 UK Childcare Management Software Market Estimates and Forecasts, By End-user (2021-2032) (USD Million)
10.3.9 Italy
10.3.9.1 Italy Childcare Management Software Market Estimates and Forecasts, By Solution (2021-2032) (USD Million)
10.3.9.2 Italy Childcare Management Software Market Estimates and Forecasts, By Deployment (2021-2032) (USD Million)
10.3.9.3 Italy Childcare Management Software Market Estimates and Forecasts, By End-user (2021-2032) (USD Million)
10.3.10 Spain
10.3.10.1 Spain Childcare Management Software Market Estimates and Forecasts, By Solution (2021-2032) (USD Million)
10.3.10.2 Spain Childcare Management Software Market Estimates and Forecasts, By Deployment (2021-2032) (USD Million)
10.3.10.3 Spain Childcare Management Software Market Estimates and Forecasts, By End-user (2021-2032) (USD Million)
10.3.12 Poland
10.3.12.1 Poland Childcare Management Software Market Estimates and Forecasts, by Country (2021-2032) (USD Million)
10.3.12.1 Poland Childcare Management Software Market Estimates and Forecasts, By Solution (2021-2032) (USD Million)
10.3.12.3 Poland Childcare Management Software Market Estimates and Forecasts, By Deployment (2021-2032) (USD Million)
10.3.12.3 Poland Childcare Management Software Market Estimates and Forecasts, By End-user (2021-2032) (USD Million)
10.3.13 Turkey
10.3.13.1 Turkey Childcare Management Software Market Estimates and Forecasts, By Solution (2021-2032) (USD Million)
10.3.13.2 Turkey Childcare Management Software Market Estimates and Forecasts, By Deployment (2021-2032) (USD Million)
10.3.13.3 Turkey Childcare Management Software Market Estimates and Forecasts, By End-user (2021-2032) (USD Million)
10.3.14 Rest of Europe
10.3.14.1 Rest of Europe Childcare Management Software Market Estimates and Forecasts, By Solution (2021-2032) (USD Million)
10.3.14.2 Rest of Europe Childcare Management Software Market Estimates and Forecasts, By Deployment (2021-2032) (USD Million)
10.3.14.3 Rest of Europe Childcare Management Software Market Estimates and Forecasts, By End-user(2021-2032) (USD Million)
10.4 Asia-Pacific
10.4.1 Trends Analysis
10.4.2 Asia-Pacific Childcare Management Software Market Estimates and Forecasts, by Country (2021-2032) (USD Million)
10.4.3 Asia-Pacific Childcare Management Software Market Estimates and Forecasts, By Solution (2021-2032) (USD Million)
10.4.4 Asia-Pacific Childcare Management Software Market Estimates and Forecasts, By Deployment (2021-2032) (USD Million)
10.4.5 Asia-Pacific Childcare Management Software Market Estimates and Forecasts, By End-user (2021-2032) (USD Million)
10.4.6 China
10.4.6.1 China Childcare Management Software Market Estimates and Forecasts, By Solution (2021-2032) (USD Million)
10.4.6.2 China Childcare Management Software Market Estimates and Forecasts, By Deployment (2021-2032) (USD Million)
10.4.6.3 China Childcare Management Software Market Estimates and Forecasts, By End-user (2021-2032) (USD Million)
10.4.7 India
10.4.7.1 India Childcare Management Software Market Estimates and Forecasts, By Solution (2021-2032) (USD Million)
10.4.7.2 India Childcare Management Software Market Estimates and Forecasts, By Deployment (2021-2032) (USD Million)
10.4.7.3 India Childcare Management Software Market Estimates and Forecasts, By End-user (2021-2032) (USD Million)
10.4.8 Japan
10.4.8.1 Japan Childcare Management Software Market Estimates and Forecasts, By Solution (2021-2032) (USD Million)
10.4.8.2 Japan Childcare Management Software Market Estimates and Forecasts, By Deployment (2021-2032) (USD Million)
10.4.8.3 Japan Childcare Management Software Market Estimates and Forecasts, By End-user (2021-2032) (USD Million)
10.4.9 South Korea
10.4.9.1 South Korea Childcare Management Software Market Estimates and Forecasts, By Solution (2021-2032) (USD Million)
10.4.9.2 South Korea Childcare Management Software Market Estimates and Forecasts, By Deployment (2021-2032) (USD Million)
10.4.9.3 South Korea Childcare Management Software Market Estimates and Forecasts, By End-user (2021-2032) (USD Million)
10.4.10 Singapore
10.4.10.1 Singapore Childcare Management Software Market Estimates and Forecasts, By Solution (2021-2032) (USD Million)
10.4.10.2 Singapore Childcare Management Software Market Estimates and Forecasts, By Deployment (2021-2032) (USD Million)
10.4.10.3 Singapore Childcare Management Software Market Estimates and Forecasts, By End-user (2021-2032) (USD Million)
10.4.11 Australia
10.4.11.1 Australia Childcare Management Software Market Estimates and Forecasts, By Solution (2021-2032) (USD Million)
10.4.11.2 Australia Childcare Management Software Market Estimates and Forecasts, By Deployment (2021-2032) (USD Million)
10.4.11.3 Australia Childcare Management Software Market Estimates and Forecasts, By End-user (2021-2032) (USD Million)
10.4.12 Rest of Asia-Pacific
10.4.12.1 Rest of Asia-Pacific Childcare Management Software Market Estimates and Forecasts, By Solution (2021-2032) (USD Million)
10.4.12.2 Rest of Asia-Pacific Childcare Management Software Market Estimates and Forecasts, By Deployment (2021-2032) (USD Million)
10.4.12.3 Rest of Asia-Pacific Childcare Management Software Market Estimates and Forecasts, By End-user (2021-2032) (USD Million)
10.5 Middle East and Africa
10.5.1 Trends Analysis
10.5.2 Middle East and Africa East Childcare Management Software Market Estimates and Forecasts, by Country (2021-2032) (USD Million)
10.5.3Middle East and Africa Childcare Management Software Market Estimates and Forecasts, By Solution (2021-2032) (USD Million)
10.5.4 Middle East and Africa Childcare Management Software Market Estimates and Forecasts, By Deployment (2021-2032) (USD Million)
10.5.5 Middle East and Africa Childcare Management Software Market Estimates and Forecasts, By End-user (2021-2032) (USD Million)
10.5.6 UAE
10.5.6.1 UAE Childcare Management Software Market Estimates and Forecasts, By Solution (2021-2032) (USD Million)
10.5.6.2 UAE Childcare Management Software Market Estimates and Forecasts, By Deployment (2021-2032) (USD Million)
10.5.6.3 UAE Childcare Management Software Market Estimates and Forecasts, By End-user (2021-2032) (USD Million)
10.5.7 Saudi Arabia
10.5.7.1 Saudi Arabia Childcare Management Software Market Estimates and Forecasts, By Solution (2021-2032) (USD Million)
10.5.7.2 Saudi Arabia Childcare Management Software Market Estimates and Forecasts, By Deployment (2021-2032) (USD Million)
10.5.7.3 Saudi Arabia Childcare Management Software Market Estimates and Forecasts, By End-user (2021-2032) (USD Million)
10.5.8 Qatar
10.5.8.1 Qatar Childcare Management Software Market Estimates and Forecasts, By Solution (2021-2032) (USD Million)
10.5.8.2 Qatar Childcare Management Software Market Estimates and Forecasts, By Deployment (2021-2032) (USD Million)
10.5.8.3 Qatar Childcare Management Software Market Estimates and Forecasts, By End-user (2021-2032) (USD Million)
10.5.9 South Africa
10.5.9 1 South Africa Childcare Management Software Market Estimates and Forecasts, By Solution (2021-2032) (USD Million)
10.5.9 2 South Africa Childcare Management Software Market Estimates and Forecasts By Deployment (2021-2032) (USD Million)
10.5.9 3 South Africa Childcare Management Software Market Estimates and Forecasts, By End-user (2021-2032) (USD Million)
10.5.10 Rest of Middle East & Africa
10.5.10.1 Rest of Middle East & Africa Childcare Management Software Market Estimates and Forecasts, By Solution (2021-2032) (USD Million)
10.5.10.2 Rest of Middle East & Africa Childcare Management Software Market Estimates and Forecasts, By Deployment (2021-2032) (USD Million)
10.5.10.3 Rest of Middle East & Africa Childcare Management Software Market Estimates and Forecasts, By End-user (2021-2032) (USD Million)
10.6 Latin America
10.6.1 Trends Analysis
10.6.2 Latin America Childcare Management Software Market Estimates and Forecasts, by Country (2021-2032) (USD Million)
10.6.3 Latin America Childcare Management Software Market Estimates and Forecasts, By Solution (2021-2032) (USD Million)
10.6.4 Latin America Childcare Management Software Market Estimates and Forecasts, By Deployment (2021-2032) (USD Million)
10.6.5 Latin America Childcare Management Software Market Estimates and Forecasts, By End-user (2021-2032) (USD Million)
10.6.6 Brazil
10.6.6.1 Brazil Childcare Management Software Market Estimates and Forecasts, By Solution (2021-2032) (USD Million)
10.6.6.2 Brazil Childcare Management Software Market Estimates and Forecasts, By Deployment (2021-2032) (USD Million)
10.6.6.3 Brazil Childcare Management Software Market Estimates and Forecasts, By End-user (2021-2032) (USD Million)
10.6.7 Argentina
10.6.7.1 Argentina Childcare Management Software Market Estimates and Forecasts, By Solution (2021-2032) (USD Million)
10.6.7.2 Argentina Childcare Management Software Market Estimates and Forecasts, By Deployment (2021-2032) (USD Million)
10.6.7.3 Argentina Childcare Management Software Market Estimates and Forecasts, By End-user (2021-2032) (USD Million)
10.6.8 Rest of Latin America
10.6.8.1 Rest of Latin America Childcare Management Software Market Estimates and Forecasts, By Solution (2021-2032) (USD Million)
10.6.8.2 Rest of Latin America Childcare Management Software Market Estimates and Forecasts, By Deployment (2021-2032) (USD Million)
10.6.8.3 Rest of Latin America Childcare Management Software Market Estimates and Forecasts, By End-user (2021-2032) (USD Million)
12. Company Profiles
12.1 Procare Software
12.1.1 Company Overview
12.1.2 Financial
12.1.3 Products/ Services Offered
12.1.4 SWOT Analysis
12.2 Jackrabbit Technologies
12.2.1 Company Overview
12.2.2 Financial
12.2.3 Products/ Services Offered
12.2.4 SWOT Analysis
12.3 Smartcare
12.3.1 Company Overview
12.3.2 Financial
12.3.3 Products/ Services Offered
12.3.4 SWOT Analysis
12.4 ECCE Software
12.4.1 Company Overview
12.4.2 Financial
12.4.3 Products/ Services Offered
12.4.4 SWOT Analysis
12.5 Cirrus Group
12.5.1 Company Overview
12.5.2 Financial
12.5.3 Products/ Services Offered
12.5.4 SWOT Analysis
12.6 Eleyo Inc
12.6.1 Company Overview
12.6.2 Financial
12.6.3 Products/ Services Offered
12.6.4 SWOT Analysis
12.7 Himama Pvt Ltd
12.7.1 Company Overview
12.7.2 Financial
12.7.3 Products/ Services Offered
12.7.4 SWOT Analysis
12.8 Childcare Sage
12.8.1 Company Overview
12.8.2 Financial
12.8.3 Products/ Services Offered
12.8.4 SWOT Analysis
12.9 EZChildTrack
12.9.1 Company Overview
12.9.2 Financial
12.9.3 Products/ Services Offered
12.9.4 SWOT Analysis
12.10 Kangarootime
12.10.1 Company Overview
12.10.2 Financial
12.10.3 Products/ Services Offered
12.10.4 SWOT AnalysiS
12. Use Cases and Best Practices
13. Conclusion
An accurate research report requires proper strategizing as well as implementation. There are multiple factors involved in the completion of good and accurate research report and selecting the best methodology to compete the research is the toughest part. Since the research reports we provide play a crucial role in any company’s decision-making process, therefore we at SNS Insider always believe that we should choose the best method which gives us results closer to reality. This allows us to reach at a stage wherein we can provide our clients best and accurate investment to output ratio.
Each report that we prepare takes a timeframe of 350-400 business hours for production. Starting from the selection of titles through a couple of in-depth brain storming session to the final QC process before uploading our titles on our website we dedicate around 350 working hours. The titles are selected based on their current market cap and the foreseen CAGR and growth.
The 5 steps process:
Step 1: Secondary Research:
Secondary Research or Desk Research is as the name suggests is a research process wherein, we collect data through the readily available information. In this process we use various paid and unpaid databases which our team has access to and gather data through the same. This includes examining of listed companies’ annual reports, Journals, SEC filling etc. Apart from this our team has access to various associations across the globe across different industries. Lastly, we have exchange relationships with various university as well as individual libraries.
Step 2: Primary Research
When we talk about primary research, it is a type of study in which the researchers collect relevant data samples directly, rather than relying on previously collected data. This type of research is focused on gaining content specific facts that can be sued to solve specific problems. Since the collected data is fresh and first hand therefore it makes the study more accurate and genuine.
We at SNS Insider have divided Primary Research into 2 parts.
Part 1 wherein we interview the KOLs of major players as well as the upcoming ones across various geographic regions. This allows us to have their view over the market scenario and acts as an important tool to come closer to the accurate market numbers. As many as 45 paid and unpaid primary interviews are taken from both the demand and supply side of the industry to make sure we land at an accurate judgement and analysis of the market.
This step involves the triangulation of data wherein our team analyses the interview transcripts, online survey responses and observation of on filed participants. The below mentioned chart should give a better understanding of the part 1 of the primary interview.
Part 2: In this part of primary research the data collected via secondary research and the part 1 of the primary research is validated with the interviews from individual consultants and subject matter experts.
Consultants are those set of people who have at least 12 years of experience and expertise within the industry whereas Subject Matter Experts are those with at least 15 years of experience behind their back within the same space. The data with the help of two main processes i.e., FGDs (Focused Group Discussions) and IDs (Individual Discussions). This gives us a 3rd party nonbiased primary view of the market scenario making it a more dependable one while collation of the data pointers.
Step 3: Data Bank Validation
Once all the information is collected via primary and secondary sources, we run that information for data validation. At our intelligence centre our research heads track a lot of information related to the market which includes the quarterly reports, the daily stock prices, and other relevant information. Our data bank server gets updated every fortnight and that is how the information which we collected using our primary and secondary information is revalidated in real time.
Step 4: QA/QC Process
After all the data collection and validation our team does a final level of quality check and quality assurance to get rid of any unwanted or undesired mistakes. This might include but not limited to getting rid of the any typos, duplication of numbers or missing of any important information. The people involved in this process include technical content writers, research heads and graphics people. Once this process is completed the title gets uploader on our platform for our clients to read it.
Step 5: Final QC/QA Process:
This is the last process and comes when the client has ordered the study. In this process a final QA/QC is done before the study is emailed to the client. Since we believe in giving our clients a good experience of our research studies, therefore, to make sure that we do not lack at our end in any way humanly possible we do a final round of quality check and then dispatch the study to the client.
Key Segments:
By Deployment
On-premise
Cloud-Based
By Solution
Family and Child Data Management
Time and Activity Management
Nutrition Management
Attendance Tracker
Employee Data Management
Payroll
Accounting
Others
By End-user
Parents
Daycare Centers
Play Schools
Request for Segment Customization as per your Business Requirement: Segment Customization Request
Regional Coverage:
North America
US
Canada
Mexico
Europe
Germany
France
UK
Italy
Spain
Poland
Turkey
Rest of Europe
Asia Pacific
China
India
Japan
South Korea
Singapore
Australia
Rest of Asia Pacific
Middle East & Africa
UAE
Saudi Arabia
Qatar
South Africa
Rest of Middle East & Africa
Latin America
Brazil
Argentina
Rest of Latin America
Request for Country Level Research Report: Country Level Customization Request
Available Customization
With the given market data, SNS Insider offers customization as per the company’s specific needs. The following customization options are available for the report:
Detailed Volume Analysis
Criss-Cross segment analysis (e.g. Product X Application)
Competitive Product Benchmarking
Geographic Analysis
Additional countries in any of the regions
Customized Data Representation
Detailed analysis and profiling of additional market players