Chromic Materials Market Report Scope & Overview:
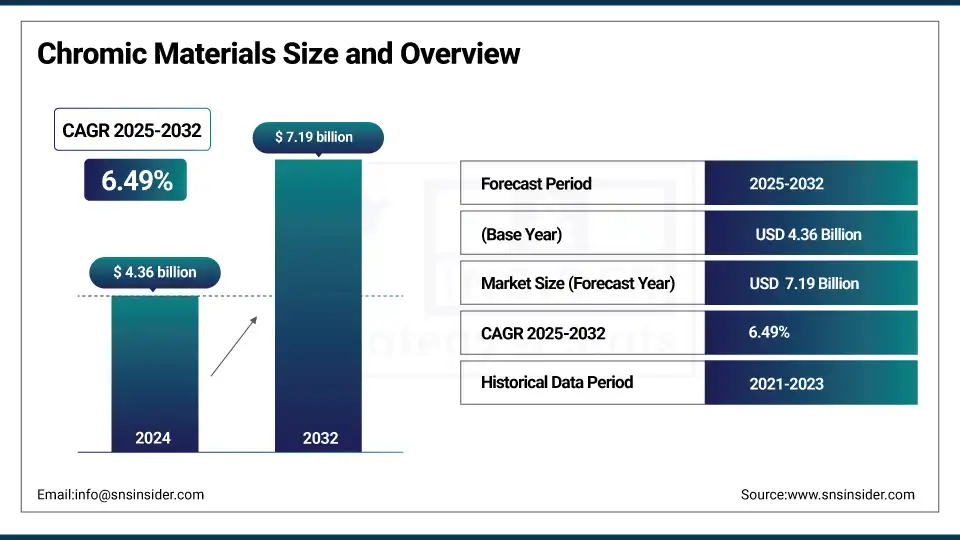
The Chromic Materials market size was valued at USD 4.36 billion in 2024 and is expected to reach USD 7.19 billion by 2032, growing at a CAGR of 6.49% over the forecast period of 2025-2032.
The chromic materials industry is advancing with the growing need for responsive intelligent systems in both architecture and automotive applications. Chromic materials for the automotive applications, e.g., the electrochromic panoramic roof on Volkswagen ID. 7, demonstrate IoT integration and user-oriented innovation. Smart windows are integrating with electrochromic materials to cut HVAC energy loads, with AR displays and wearables are attracting photochromic materials. Companies working with chromic materials are coming together to expand embedded sensor capabilities, supporting the growth of the chromic materials market and technology uptake.
To Get more information On Chromic Materials Market - Request Free Sample Report
Electrochromic films, for example, can cut building energy losses by 30% and the required size of an HVAC system by 50%, according to the U.S. Department of Energy. Adding further momentum, Sage Electrochromics obtained a USD 72 million conditional loan guarantee to expand production. These events strengthen the positive trends and prospects in the chromic materials market. Growing demand will support growth in the size of the chromic materials market and chromic materials market share over the forecast period, supported by advances in technology and environmentally friendly solutions. Chromic materials market--analysis of demand confirms continued growth.
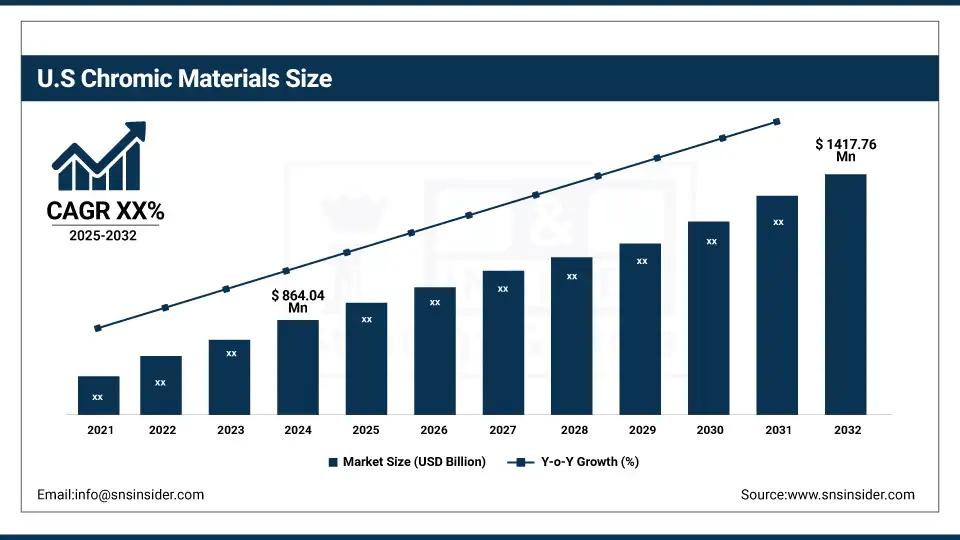
The U.S. is the leading country in North America for chromic materials adoption, supported by significant federal investments in energy-efficient technologies. The U.S. leads with a market size of USD 864.04 million and is projected to reach a value of USD 1417.76 million by 2032 with a market share of around 67%. The DOE’s Building Technologies Office invests in research on electrochromic and photochromic materials that can improve a building’s performance. US firm Sage Electrochromics said that it received a $72 million conditional loan guarantee from the U.S. Department of Energy to increase production on its smart glass product, in a show of solid state governmental backing for the tech. These efforts add to the commanding stance of the U.S. in the chromic materials market, indicative of its strong chromic materials market size and growth trends.
Market Dynamics:
Drivers:
-
Increasing Adoption of Automotive Chromic Materials Enhances Comfort and Energy Efficiency in Vehicles
Increasing the use of automotive chromic materials, particularly electrochromic materials, in vehicles would substantially increase occupant comfort and reduce energy use. For example, Volkswagen’s ID. 7 The Electrochromic Panoramic Roof that manages sunlight and heat for optimal comfort not to mention fuel efficiency. The chromic materials industry is growing with advancements such as integration of IoT for a personalized fit. Smart glazing technologies can save up to 30% of the HVAC energy, according to the U.S. Department of Energy, which emphasizes the sustainability factor. These developments further expand the chromic materials market size and share because demand is driving automotive applications, which is consistent with the larger chromic materitals market trends in smarter, more energy-efficient solutions.
-
Expanding Use of Photochromic Materials in Wearable and Consumer Electronics Fuels Market Growth
Photochromic materials have seen rising popularity in wearable and consumer electronics, as the popularity of adaptive lenses and smart displays have been surging. Their self-coloration and bleaching with UV light provides sunglasses and AR devices with the possibility to adapt automatically,thusincreasing users’ convenience and experience. Growth of this industry is one of few key factors driving the chromic materials market, with companies in the chromic materials market working to develop materials that are longer lasting and more reactive than earlier materials. The incorporation of IoT technology facilitates in addition the dynamic adaptation of the WPAN to the operating environment, which fosters market developments. This transmission has led to the usage of chromic materials in markets outside of the standard markets, expanding the market for chromic materials and also the share of the market.
Restraints:
-
Regulatory and Certification Delays Hinder Timely Market Entry for Chromic Materials Technologies
Stringent regulations and certification needs for chromic content, particularly aimed at automotive and construction applications, continue to impede rapid market uptake. Safety, environmental and performance standard compliance is onerous and involves exhaustive testing, resulting in long lead times and high costs for chromic materials companies wishing to bring new products to market. This decelerates market growth of chromic materials and hamstrings chromic materials market share expansion due to complications involved in approvals which manufacturers have to deal with. For instance, smart glazing require energy codes and automotive safety to clear, delaying market introduction despite growing demand fueled by IoT integration and chromic materials market trends.
Segmentation Analysis:
By Type
The colored state segment dominated the chromic materials market in 2024 with a market share of 54.8%. This domination is fueled by its wide usage in smart windows, automotive glazing, and smart labels. The U.S. Department of Energy notes that chromic coatings that reduce solar heat gain save energy, helping to drive an increased market share. Prominent chromic materials manufacturers are investing in colored state technology, in line with the chromic materials market trend for energy efficiency solutions coupled with IoT.
The transparent segment is the fastest-growing with a CAGR of 6.69% from 2025 to 2032. This growth is fueled by rising demand for clear smart windows and displays in commercial buildings. Government incentives promoting energy-efficient smart building materials boost adoption. Electrochromic technologies enabling transparency control are widely adopted in architectural applications, supported by regulatory frameworks promoting green building solutions. This trend is pivotal to chromic materials market growth and expanding market size.
By Technology
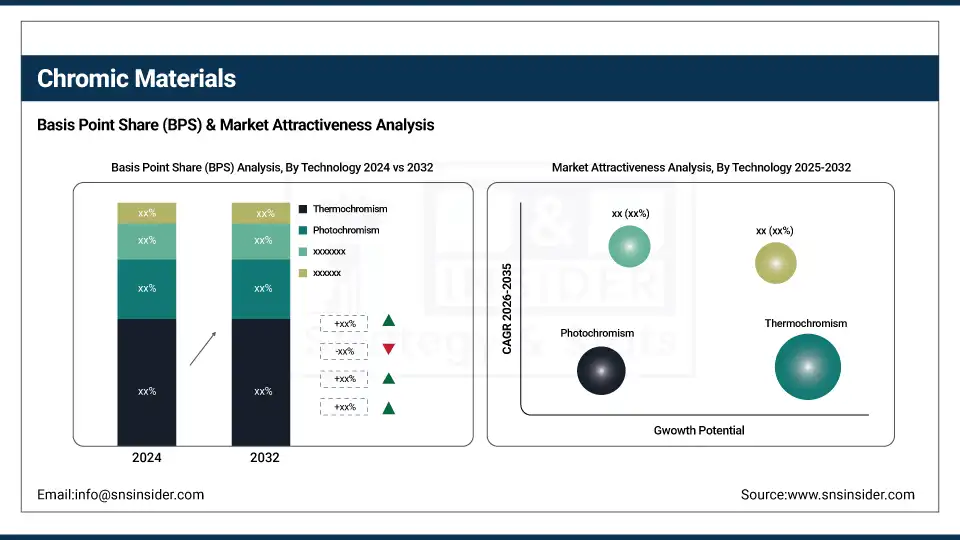
The thermochromism segment dominated the chromic materials market in 2024 with a market share of 38.2%, primarily due to its use in temperature-responsive smart fabrics, automotive components, and packaging. Dynamic response to changing conditions of the environment lead to energy saving, which is supported by the U.S. Department of Energy who have verified the energy efficiency of smart materials. Chromic materials manufacturers are making innovative use of this technology in accordance with the emerging trends in the chromic materials market for sustainability and intelligent properties.
The electrochromism segment is the fastest-growing with a CAGR of 7.01% during 2025–2032. Its applications in smart windows and automotive chromic materials are rapidly expanding due to IoT integration and increasing energy regulation compliance. The U.S. Department of Energy reports that electrochromic windows can cut cooling costs by up to 30%, driving demand and chromic materials market growth. This aligns with chromic materials market analysis emphasizing smart building innovations.
By Material
The indium tin oxide segment dominated the chromic materials market in 2024 with a market share of 41.1% due to its widespread use as a transparent conductor in electrochromic devices and smart displays. The long-lasting nature and conductivity of it adhere to industry standards as set forth by the National Institute of Standards and Technology. Chromic materials companies are focusing on indium tin oxide for the purpose of next-generation smart windows and displays, thereby reinforcing chromic materials market share and size.
The vanadium dioxide segment is the fastest-growing with a CAGR of 7.52% from 2025 to 2032. Its thermochromic and metal-insulator transition characteristics are exploited in smart coatings for energy-efficient windows and sensors. This is how it is driving market growth, the U.S. Department of Energy points out in a paper about possible building energy savings. This new technology is consistent with powerful trends in the chromic materials market: sustainability and high performance materials.
By Application
The smart windows segment dominated the chromic materials market in 2024 with a market share of 45.9%, driven by demand for energy-efficient building technologies and occupant comfort enhancements. Government policies and initiatives to encourage green building materials, such as those from U.S. Department of Energy, are favoring the use of the smart window using the electrochromic or the thermochromic materials. The enabling integrated IoT technologies are real-time controlling of chromic materials, therefore driving the market for the same.
The displays segment is the fastest-growing with a CAGR of 7.24% from 2025 to 2032. Rising adoption of consumer electronics, AR/VR devices, and automotive displays also drive the market growth. The combination of photochromic and electrochromic materials also serves to enhance the user-engagement and energy-efficiency. High adoption of energy conservation electronics will propel market growth, with the displays sector being one of the primary contributors to chromic materials industry share.
Regional Analysis:
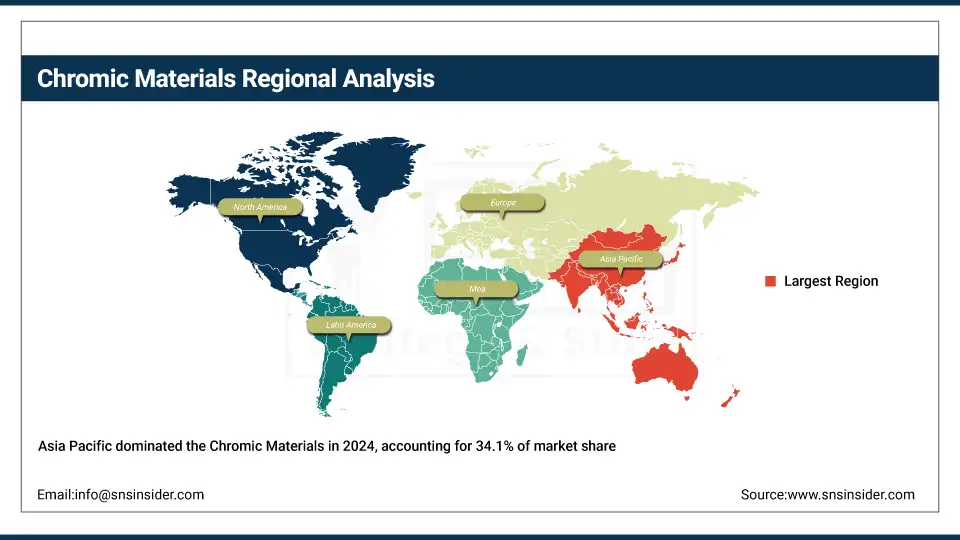
Asia Pacific dominates the chromic materials market with a 34.1% market share in 2024 and is the fastest growing region with a CAGR of 6.87%. The regional development is supported by the development of smart city and rapid urbanization, in addition, the increasing requirement of energy-efficient infrastructure in power sector is driving growing demand for electrochromic and photochromic materials. China is leading the region with large investments, financed under its 14th Five-Year Plan, to promote green construction. Firms such as Shenzhen O-film Tech Co. Ltd. are also contributing to smart glass development, with robust IoT incorporation and state-sponsored R&D aiding chromic materials market expansion.
Get Customized Report as per Your Business Requirement - Enquiry Now
North America ranked as the second dominating region in the Chromic Materials Market in 2024, holding a 29.6% market share. The market in the region is fueled by high usage of energy-efficient smart building materials and automotive chromic materials interfacing IoT. U.S. federal programs, such as the Department of Energy’s smart windows work, show that electrochromic glazing cuts HVAC energy demand by as much as 30%, supporting the green sustainable trend architecture and design. In addition, chromic materials market growth and technological innovation is also driven by the advanced infrastructure, strict energy regulations, and surging environmental consciousness of the region.
Key Players:
The major chromic materials market competitors include Chromatic Technologies Inc. (CTI), Olikrom Industry, H.W. Sands Corp., Matsui International Company, LCR Hallcrest LLC, New Color Chemical Co., Ltd., QCR Solutions Corp., Kolorjet Chemicals Pvt. Ltd., Smarol Industry Co., Ltd., and Zhuhai Wanda Technology Co., Ltd.
Recent Developments:
-
In June 2025, Shenzhen YuGuang New Material Co., Ltd. introduced PDLC‑based Clear Switchable Smart Glass, achieving 0.1 s switching and 60% glare reduction in automotive tests, and demonstrating 22% cooling‑load savings in a Phoenix office case study.
-
In April 2024, Chromatic Technologies Inc. launched BPA‑free, printable BlindSpotz thermochromic inks for pharmaceutical packaging, meeting stringent FDA and CE compliance
| Report Attributes | Details |
|---|---|
| Market Size in 2024 | USD 4.36 billion |
| Market Size by 2032 | USD 7.19 billion |
| CAGR | CAGR of 6.49% From 2025 to 2032 |
| Base Year | 2024 |
| Forecast Period | 2025-2032 |
| Historical Data | 2021-2023 |
| Report Scope & Coverage | Market Size, Segments Analysis, Competitive Landscape, Regional Analysis, DROC & SWOT Analysis, Forecast Outlook |
| Key Segments | •By Type (Transparent, Colored State) •By Technology (Photochromism, Thermochromism, Electrochromism, Piezochromism, Gasochromism, and Others), •By Material (Tungsten Oxide, Vanadium Dioxide, Liquid Crystal Polymers, Carbazoles, Methoxy Biphenyls, Indium Tin Oxide, and Others), •By Application (Smart Windows, Smart Fabrics, Smart Label Indicators, Displays, Ophthalmic Lenses, and Others), |
| Regional Analysis/Coverage | North America (US, Canada, Mexico), Europe (Germany, France, UK, Italy, Spain, Poland, Turkey, Rest of Europe), Asia Pacific (China, India, Japan, South Korea, Singapore, Australia, Rest of Asia Pacific), Middle East & Africa (UAE, Saudi Arabia, Qatar, South Africa, Rest of Middle East & Africa), Latin America (Brazil, Argentina, Rest of Latin America) |
| Company Profiles | Chromatic Technologies Inc. (CTI), Olikrom Industry, H.W. Sands Corp., Matsui International Company, LCR Hallcrest LLC, New Color Chemical Co., Ltd., QCR Solutions Corp., Kolorjet Chemicals Pvt. Ltd., Smarol Industry Co., Ltd., and Zhuhai Wanda Technology Co., Ltd. |
Frequently Asked Questions
Asia Pacific dominates with 34.1% market share and fastest CAGR of 6.87% during the forecast period.
IoT integration, smart city initiatives, and energy-efficient innovations in automotive and architecture drive market growth.
Photochromic materials are used in wearables, thermochromic in packaging and fabrics, and electrochromic in smart windows.
Thermochromism dominated the chromic materials market in 2024 with a market share of 38.2%.
The chromic materials market size was valued at USD 4.36 billion in 2024.
Get in Touch
